
The US dollar against 14 currencies, year by year since 1971
Updated October 16, 2026, with rates through October 16, 2026. The year-end and annual-average tables are refreshed every January; the 2026 row is updated during the year.
Short answer: On October 16, 2026, one US dollar bought ₹94.96, Rp18,031, ₱63.05, ¥158.02, 6.6862 yuan, ₩1,332.10, 18.3836 Mexican pesos and 49.3573 Turkish lira, and one euro cost $1.1253. At the end of 2025 the dollar stood at ₹89.84, Rp16,782, ₱58.81, ¥156.80 and 42.8457 lira. Since each series starts (the end of 1970 for 11 of them; 1989 for the dong, 1992 for the rouble, 1994 for the real) the dollar has risen against 11 of these 14 currencies (the rupee went from ₹7.58 to ₹94.96, 12.5× as many rupees per dollar) and fallen against three: the yen (¥357.65 to ¥158.02), the New Taiwan dollar and the euro measured through its Deutsche Mark predecessor. The worst single years for a currency were the Russian rouble in 1998 (+246% for the dollar), the Mexican peso in 1982 (+268%), the Turkish lira in 1994 (+168%) and the Korean won in 1997 (+100%).
This page lists the US dollar's exchange rate against 14 currencies for every year since 1970: the rate on the last trading day of each year, the average for the year, and the change from one year-end to the next. Rates are units of local currency per US dollar, except the euro, which is quoted the way Europeans quote it (US dollars per euro). Every value comes from an official or institutional source (US Federal Reserve H.10 via FRED, the IMF, the BIS, the European Central Bank and the central banks of Taiwan, the Philippines, Turkey, Russia and Brazil) and was checked against a second source. The first two tables are the full year-by-year tables for the Indian rupee and the Philippine peso, the two English-speaking markets that search for these numbers most; the translated versions of this page lead with their own currency (rupiah, dong, baht, lira, real, rouble, won, yen, yuan, Taiwan dollar, Mexican peso and euro).
Dollar to Indian rupee and Philippine peso by year, 1970–2026
These two tables give the year-end rate, the annual average and the year-end change for every year since 1970. Both currencies hit record lows against the dollar in 2026.
Dollar to rupee by year (₹ per US$)
The table lists how many Indian rupees one US dollar bought at the end of each year since 1970, the average for the year and the change from one year-end to the next. On October 16, 2026 the rate was ₹94.96; at the end of 2025 it was ₹89.84, and the 2025 average was ₹87.15. Since the end of 1970 the dollar has become 12.5× as expensive in rupees: the rupee has lost 92.0% of its dollar value, and 54.2% since the end of 1999. The rupee weakened in 37 of 55 full years; its worst year was 1991 (+42.1% for the dollar) and its best 2007 (−10.7%).
| Year | Year-end (₹ per US$) | Annual average (₹ per US$) | Change in year (dollar vs rupee) |
|---|---|---|---|
| 2026 (to Oct 16) | 94.96 | 94.08 | +5.7% |
| 2025 | 89.84 | 87.15 | +5.0% |
| 2024 | 85.55 | 83.66 | +2.8% |
| 2023 | 83.19 | 82.57 | +0.6% |
| 2022 | 82.72 | 78.58 | +11.2% |
| 2021 | 74.39 | 73.94 | +1.9% |
| 2020 | 73.01 | 74.14 | +2.3% |
| 2019 | 71.36 | 70.38 | +2.6% |
| 2018 | 69.58 | 68.37 | +9.0% |
| 2017 | 63.83 | 65.07 | −6.0% |
| 2016 | 67.92 | 67.16 | +2.6% |
| 2015 | 66.19 | 64.11 | +5.0% |
| 2014 | 63.04 | 61.00 | +1.8% |
| 2013 | 61.92 | 58.51 | +12.9% |
| 2012 | 54.86 | 53.37 | +3.5% |
| 2011 | 53.01 | 46.58 | +18.3% |
| 2010 | 44.80 | 45.65 | −3.4% |
| 2009 | 46.40 | 48.33 | −4.5% |
| 2008 | 48.58 | 43.39 | +23.3% |
| 2007 | 39.41 | 41.18 | −10.7% |
| 2006 | 44.11 | 45.19 | −1.9% |
| 2005 | 44.95 | 44.00 | +3.9% |
| 2004 | 43.27 | 45.26 | −5.0% |
| 2003 | 45.55 | 46.59 | −5.1% |
| 2002 | 48.00 | 48.63 | −0.6% |
| 2001 | 48.27 | 47.22 | +3.3% |
| 2000 | 46.75 | 45.00 | +7.4% |
| 1999 | 43.51 | 43.13 | +2.3% |
| 1998 | 42.52 | 41.36 | +8.2% |
| 1997 | 39.30 | 36.36 | +9.3% |
| 1996 | 35.95 | 35.51 | +2.2% |
| 1995 | 35.18 | 32.42 | +12.1% |
| 1994 | 31.37 | 31.39 | −0.2% |
| 1993 | 31.44 | 31.29 | +8.4% |
| 1992 | 29.00 | 28.16 | +12.6% |
| 1991 | 25.76 | 22.71 | +42.1% |
| 1990 | 18.13 | 17.49 | +6.9% |
| 1989 | 16.96 | 16.21 | +13.1% |
| 1988 | 14.99 | 13.90 | +17.6% |
| 1987 | 12.75 | 12.95 | −2.8% |
| 1986 | 13.12 | 12.60 | +8.3% |
| 1985 | 12.11 | 12.33 | −2.2% |
| 1984 | 12.38 | 11.35 | +18.0% |
| 1983 | 10.49 | 10.10 | +9.0% |
| 1982 | 9.62 | 9.48 | +5.4% |
| 1981 | 9.13 | 8.68 | +15.0% |
| 1980 | 7.94 | 7.89 | −0.8% |
| 1979 | 8.00 | 8.16 | −2.8% |
| 1978 | 8.23 | 8.20 | +0.0% |
| 1977 | 8.23 | 8.77 | −7.8% |
| 1976 | 8.93 | 8.97 | −0.4% |
| 1975 | 8.97 | 8.41 | +10.3% |
| 1974 | 8.13 | 8.03 | −0.4% |
| 1973 | 8.16 | 7.65 | +1.0% |
| 1972 | 8.08 | 7.59 | +11.0% |
| 1971 | 7.28 | 7.49 | −3.9% |
| 1970 | 7.58 | 7.50 | — |
Dollar to Philippine peso by year (₱ per US$)
The table lists how many Philippine pesos one US dollar bought at the end of each year since 1970, the average for the year and the change from one year-end to the next. On October 16, 2026 the rate was ₱63.05; at the end of 2025 it was ₱58.81, and the 2025 average was ₱57.51. The October 16, 2026 close was the weakest for the peso in Bangko Sentral ng Pilipinas data. Since the end of 1970 the dollar has become 9.80× as expensive in pesos (the peso has lost 89.8% of its dollar value), and since the end of 1999 the peso has lost 36.1%. The peso weakened in 37 of 55 full years; its worst year was 1983 (+52.7% for the dollar) and its best 2007 (−15.7%).
| Year | Year-end (₱ per US$) | Annual average (₱ per US$) | Change in year (dollar vs peso) |
|---|---|---|---|
| 2026 (to Oct 16) | 63.05 | 60.76 | +7.2% |
| 2025 | 58.81 | 57.51 | +1.4% |
| 2024 | 58.01 | 57.29 | +4.4% |
| 2023 | 55.57 | 55.63 | −1.0% |
| 2022 | 56.12 | 54.48 | +10.5% |
| 2021 | 50.77 | 49.25 | +5.7% |
| 2020 | 48.04 | 49.62 | −5.3% |
| 2019 | 50.74 | 51.80 | −3.8% |
| 2018 | 52.72 | 52.66 | +5.6% |
| 2017 | 49.92 | 50.40 | +0.2% |
| 2016 | 49.81 | 47.49 | +5.6% |
| 2015 | 47.17 | 45.50 | +5.7% |
| 2014 | 44.62 | 44.40 | +0.5% |
| 2013 | 44.41 | 42.45 | +7.8% |
| 2012 | 41.19 | 42.23 | −6.2% |
| 2011 | 43.93 | 43.31 | +0.1% |
| 2010 | 43.89 | 45.11 | −5.3% |
| 2009 | 46.36 | 47.64 | −2.4% |
| 2008 | 47.49 | 44.47 | +14.7% |
| 2007 | 41.40 | 46.15 | −15.7% |
| 2006 | 49.13 | 51.31 | −7.4% |
| 2005 | 53.07 | 55.09 | −5.7% |
| 2004 | 56.27 | 56.04 | +1.3% |
| 2003 | 55.57 | 54.20 | +4.7% |
| 2002 | 53.10 | 51.60 | +3.3% |
| 2001 | 51.40 | 50.99 | +2.8% |
| 2000 | 50.00 | 44.19 | +24.0% |
| 1999 | 40.31 | 39.09 | +3.2% |
| 1998 | 39.06 | 40.89 | −2.3% |
| 1997 | 39.98 | 29.47 | +52.1% |
| 1996 | 26.29 | 26.22 | +0.3% |
| 1995 | 26.21 | 25.71 | +7.4% |
| 1994 | 24.42 | 26.42 | −11.8% |
| 1993 | 27.70 | 27.12 | +10.4% |
| 1992 | 25.10 | 25.51 | −5.8% |
| 1991 | 26.65 | 27.48 | −4.8% |
| 1990 | 28.00 | 24.31 | +24.8% |
| 1989 | 22.44 | 21.74 | +5.2% |
| 1988 | 21.34 | 21.09 | +2.6% |
| 1987 | 20.80 | 20.57 | +1.3% |
| 1986 | 20.53 | 20.39 | +7.9% |
| 1985 | 19.03 | 18.61 | −3.7% |
| 1984 | 19.76 | 16.70 | +41.1% |
| 1983 | 14.00 | 11.11 | +52.7% |
| 1982 | 9.17 | 8.54 | +11.8% |
| 1981 | 8.20 | 7.90 | +7.9% |
| 1980 | 7.60 | 7.51 | +2.5% |
| 1979 | 7.42 | 7.38 | +0.5% |
| 1978 | 7.38 | 7.37 | +0.1% |
| 1977 | 7.37 | 7.40 | −0.8% |
| 1976 | 7.43 | 7.44 | −0.9% |
| 1975 | 7.50 | 7.25 | +6.1% |
| 1974 | 7.07 | 6.79 | +5.0% |
| 1973 | 6.73 | 6.76 | −0.8% |
| 1972 | 6.78 | 6.67 | +5.4% |
| 1971 | 6.44 | 6.43 | +0.0% |
| 1970 | 6.44 | 6.02 | — |
Rupee notes. Before 1970: India's initial par value, announced through the IMF in December 1946, was 30.225 US cents per rupee, about ₹3.31 per dollar. From September 1949 the parity was ₹4.76190 per dollar (IMF press release, September 1949), and after the devaluation of June 1966 the IMF's month-end rate moved from ₹4.80 (May) to ₹7.58 (June). Sources: year-end 1973–2025 = Federal Reserve H.10 noon buying rate in New York (FRED DEXINUS); 1970–72 = IMF end-of-period rate; 2026 = ECB reference cross rate on October 16, 2026. Averages = Federal Reserve annual averages (IMF before 1973); 2026 average = January 1 to October 16. Every year-end and average was compared with a second publisher (the IMF, the ECB, Taiwan's central bank or the BIS): the largest year-end gap is 1.2% (1979) and the largest gap in the averages 1.1% (1973). 1992–93 dual rate: from March 1992 to March 1993 India ran an official rate alongside a market rate (the Liberalised Exchange Rate Management System, Reserve Bank of India); the table shows the market rate, ₹29.00 at the end of 1992, while the IMF's official end-1992 rate was ₹26.20. Reserve Bank of India reference rates can differ slightly from these New York figures.
Philippine peso notes. Sources: year-end = Bangko Sentral ng Pilipinas closing rate (daily data from 1978; BSP end-of-period rate before), including the October 16, 2026 close; averages = BSP annual averages (1970, the year of the devaluation and managed float, is the one year where BSP and IMF averages differ by 2%); 2026 average = mean of daily BSP rates from January 1 to October 16. Every year-end and average was compared with a second publisher (the IMF, the ECB, Taiwan's central bank or the BIS): the largest year-end gap is 1.1% (2002) and the largest gap in the averages 2.0% (1970).
Why the rupee and the peso moved
Indian rupee
- 1971–1975: after the dollar's link to gold ended, the rupee stayed tied to sterling until September 1975, when it was delinked and managed against a basket of trading partners' currencies (Reserve Bank of India); the dollar ended 1975 at ₹8.97.
- 1991 balance-of-payments crisis: with reserves nearly exhausted, India devalued the rupee in two steps in July 1991 and began opening its economy (1991 Indian economic crisis). The dollar went from ₹18.13 at the end of 1990 to ₹25.76 at the end of 1991 (+42.1%, the rupee's worst year in the table).
- 1992–1993, a market-determined rupee: the dual-rate system introduced in March 1992 ended with the convergence of the two rates on March 1, 1993 (Reserve Bank of India); the dollar ended 1993 at ₹31.44.
- 2008 and 2013: the global financial crisis (+23.3% for the dollar in 2008, Federal Reserve History) and the 2013 "taper tantrum", when hints of slower Fed bond buying pulled money out of emerging markets (+12.9%; ₹61.92 at the end of 2013).
- 2022–2026: the Fed's 2022 hikes lifted the dollar 11.2% against the rupee; the weakest daily close in the Federal Reserve series came on May 20, 2026 (₹96.82), and on October 16, 2026 the rate was ₹94.96.
Philippine peso
- 1970, end of decontrol: the decontrol era ended in 1970 with a devaluation and a move to a managed float with no fixed parity (Philippine peso); the dollar ended 1970 at ₱6.44.
- 1983–1984 debt and confidence crisis: the peso lost more than half of its dollar value in two years (Philippine peso); the dollar rose 52.7% in 1983 and 41.1% in 1984.
- 1997 Asian financial crisis: +52.1% for the dollar in 1997, from ₱26.29 to ₱39.98 (Federal Reserve History).
- 2000 and 2007: the dollar rose 24.0% in 2000 and then fell 15.7% in 2007, the peso's best year in the table.
- 2022–2026: +10.5% for the dollar in 2022; on October 16, 2026 the peso closed at a record ₱63.05 per dollar.
The dollar against 14 currencies at a glance
Year-end rates every five years since 1970, then every year from 2020. The 2026 row is the latest rate (October 16, 2026). A dash means the currency did not exist yet in its current form or the table starts later (Vietnamese dong 1989, Russian rouble 1992, Brazilian real 1994, euro 1999). Turkish lira, Russian rouble and Mexican peso values are in today's units, so pre-redenomination rates look tiny; the Turkish, Russian and Mexican tables (on the Turkish, Russian and Spanish versions of this page) give the old-currency figures.
Asia
| Year-end | INR | IDR | PHP | THB | VND | CNY | JPY | KRW | TWD |
|---|---|---|---|---|---|---|---|---|---|
| 2026 (to Oct 16) | 94.96 | 18,031 | 63.05 | 33.42 | 25,890 | 6.6862 | 158.02 | 1,332.10 | 32.338 |
| 2025 | 89.84 | 16,782 | 58.81 | 31.49 | 26,301 | 6.9931 | 156.80 | 1,444.55 | 31.438 |
| 2024 | 85.55 | 16,162 | 58.01 | 34.32 | 25,490 | 7.2993 | 157.37 | 1,477.86 | 32.781 |
| 2023 | 83.19 | 15,416 | 55.57 | 34.35 | 24,245 | 7.0999 | 140.92 | 1,290.97 | 30.735 |
| 2022 | 82.72 | 15,731 | 56.12 | 34.59 | 23,575 | 6.8972 | 131.81 | 1,260.18 | 30.708 |
| 2021 | 74.39 | 14,269 | 50.77 | 33.33 | 22,800 | 6.3726 | 115.17 | 1,188.59 | 27.690 |
| 2020 | 73.01 | 14,105 | 48.04 | 30.02 | 23,083 | 6.5250 | 103.19 | 1,086.11 | 28.508 |
| 2015 | 66.19 | 13,795 | 47.17 | 36.08 | 22,485 | 6.4778 | 120.27 | 1,169.26 | 33.066 |
| 2010 | 44.80 | 8,991 | 43.89 | 30.16 | 19,498 | 6.6000 | 81.67 | 1,130.60 | 30.368 |
| 2005 | 44.95 | 9,830 | 53.07 | 40.99 | 15,916 | 8.0702 | 117.88 | 1,010.00 | 32.850 |
| 2000 | 46.75 | 9,595 | 50.00 | 43.45 | 14,514 | 8.2774 | 114.35 | 1,267.00 | 32.992 |
| 1995 | 35.18 | 2,308 | 26.21 | 25.20 | 11,015 | 8.3374 | 103.28 | 775.80 | 27.265 |
| 1990 | 18.13 | 1,901 | 28.00 | 25.31 | 8,084 | 5.2352 | 135.75 | 719.20 | 27.129 |
| 1985 | 12.11 | 1,125 | 19.03 | 26.70 | — | 3.2095 | 200.25 | 892.50 | 39.900 |
| 1980 | 7.94 | 627 | 7.60 | 20.63 | — | 1.5303 | 203.10 | 659.90 | 35.952 |
| 1975 | 8.97 | 415 | 7.50 | 20.40 | — | 1.9663 | 305.16 | 484.00 | 38.000 |
| 1970 | 7.58 | 378 | 6.44 | 20.93 | — | 2.4618 | 357.65 | 316.65 | 40.000 |
Europe, the Americas, Turkey and Russia
| Year-end | EUR | DEM | MXN | BRL | TRY | RUB |
|---|---|---|---|---|---|---|
| 2026 (to Oct 16) | 1.1253 | — | 18.3836 | 5.0826 | 49.3573 | 83.62 |
| 2025 | 1.1750 | — | 18.0057 | 5.5024 | 42.8457 | 78.79 |
| 2024 | 1.0389 | — | 20.8557 | 6.1923 | 35.2803 | 102.29 |
| 2023 | 1.1050 | — | 16.8998 | 4.8413 | 29.4382 | 90.40 |
| 2022 | 1.0666 | — | 19.4960 | 5.2177 | 18.6983 | 70.30 |
| 2021 | 1.1326 | — | 20.5140 | 5.5805 | 13.3290 | 75.13 |
| 2020 | 1.2271 | — | 19.8920 | 5.1967 | 7.4194 | 73.88 |
| 2015 | 1.0887 | — | 17.1950 | 3.9048 | 2.9181 | 72.93 |
| 2010 | 1.3362 | — | 12.3825 | 1.6662 | 1.5376 | 30.35 |
| 2005 | 1.1797 | — | 10.6275 | 2.3407 | 1.3418 | 28.48 |
| 2000 | 0.9305 | — | 9.6180 | 1.9554 | 0.6718 | 28.16 |
| 1995 | — | 1.4335 | 7.7400 | 0.9725 | 0.0597 | 4.66 |
| 1990 | — | 1.4940 | 2.9454 | — | 0.00293 | — |
| 1985 | — | 2.4613 | 0.3717 | — | 0.000577 | — |
| 1980 | — | 1.9590 | 0.0233 | — | 0.0000901 | — |
| 1975 | — | 2.6223 | 0.0125 | — | 0.0000152 | — |
| 1970 | — | 3.6480 | 0.0125 | — | 0.0000149 | — |
EUR = US dollars per euro (from 1999). DEM = Deutsche Marks per US dollar (to 1998). All other columns: local currency per US dollar.
How much each currency has gained or lost against the dollar
"Value vs USD" answers the question people usually mean: how much less (or more) one unit of the local currency buys in dollars than it did then. A currency that needs twice as many units per dollar has lost 50% of its dollar value, even though the exchange-rate number has risen 100%. Since the end of 1999 the Turkish lira has lost 98.9% of its dollar value, the Russian rouble 67.7% and the Brazilian real 64.8%. Three currencies in the table are worth more in dollars than at the end of 1999: the Chinese yuan (+23.8%), the Thai baht (+13.0%) and the euro (+12.0%).
| Currency | First year-end in table | End-1999 | End-2025 | Oct 16, 2026 | Value vs USD since end-1999 | Value vs USD since first year | Worst year for the currency |
|---|---|---|---|---|---|---|---|
| Indian rupee (INR) | 7.58 (1970) | 43.51 | 89.84 | 94.96 | −54.2% | −92.0% | 1991 (+42.1%) |
| Indonesian rupiah (IDR) | 378 (1970) | 7,085 | 16,782 | 18,031 | −60.7% | −97.9% | 1997 (+95.1%) |
| Philippine peso (PHP) | 6.44 (1970) | 40.31 | 58.81 | 63.05 | −36.1% | −89.8% | 1983 (+52.7%) |
| Thai baht (THB) | 20.93 (1970) | 37.75 | 31.49 | 33.42 | +13.0% | −37.4% | 1997 (+82.5%) |
| Vietnamese dong (VND) | 5,348 (1989) | 14,028 | 26,301 | 25,890 | −45.8% | −79.3% | 1990 (+51.2%) |
| Chinese yuan (CNY) | 2.4618 (1970) | 8.2795 | 6.9931 | 6.6862 | +23.8% | −63.2% | 1994 (+45.6%) |
| Japanese yen (JPY) | 357.65 (1970) | 102.16 | 156.80 | 158.02 | −35.3% | +126% | 1979 (+23.7%) |
| South Korean won (KRW) | 316.65 (1970) | 1,136.00 | 1,444.55 | 1,332.10 | −14.7% | −76.2% | 1997 (+100%) |
| New Taiwan dollar (TWD) | 40.000 (1970) | 31.395 | 31.438 | 32.338 | −2.9% | +23.7% | 1997 (+18.7%) |
| Euro (EUR), US dollars per euro | 0.5361 (1970) | 1.0046 | 1.1750 | 1.1253 | +12.0% | +110% | 1999 (−14.1%) |
| Mexican peso (MXN) | 0.0125 (1970) | 9.4800 | 18.0057 | 18.3836 | −48.4% | −99.9% | 1982 (+268%) |
| Brazilian real (BRL) | 0.8460 (1994) | 1.7890 | 5.5024 | 5.0826 | −64.8% | −83.4% | 2002 (+52.3%) |
| Turkish lira (TRY) | 0.0000149 (1970) | 0.5401 | 42.8457 | 49.3573 | −98.9% | −99.99997% | 1994 (+168%) |
| Russian rouble (RUB) | 0.417 (1992) | 27.00 | 78.79 | 83.62 | −67.7% | −99.5% | 1998 (+246%) |
The euro row starts with the Deutsche Mark-based rate for 1970; measured through the French franc the euro has lost 4.7% of its dollar value since 1970, and through the Spanish peseta 52.8%. Worst year = the largest one-year rise in the dollar's price in that currency (for the euro, the largest one-year fall of the euro).
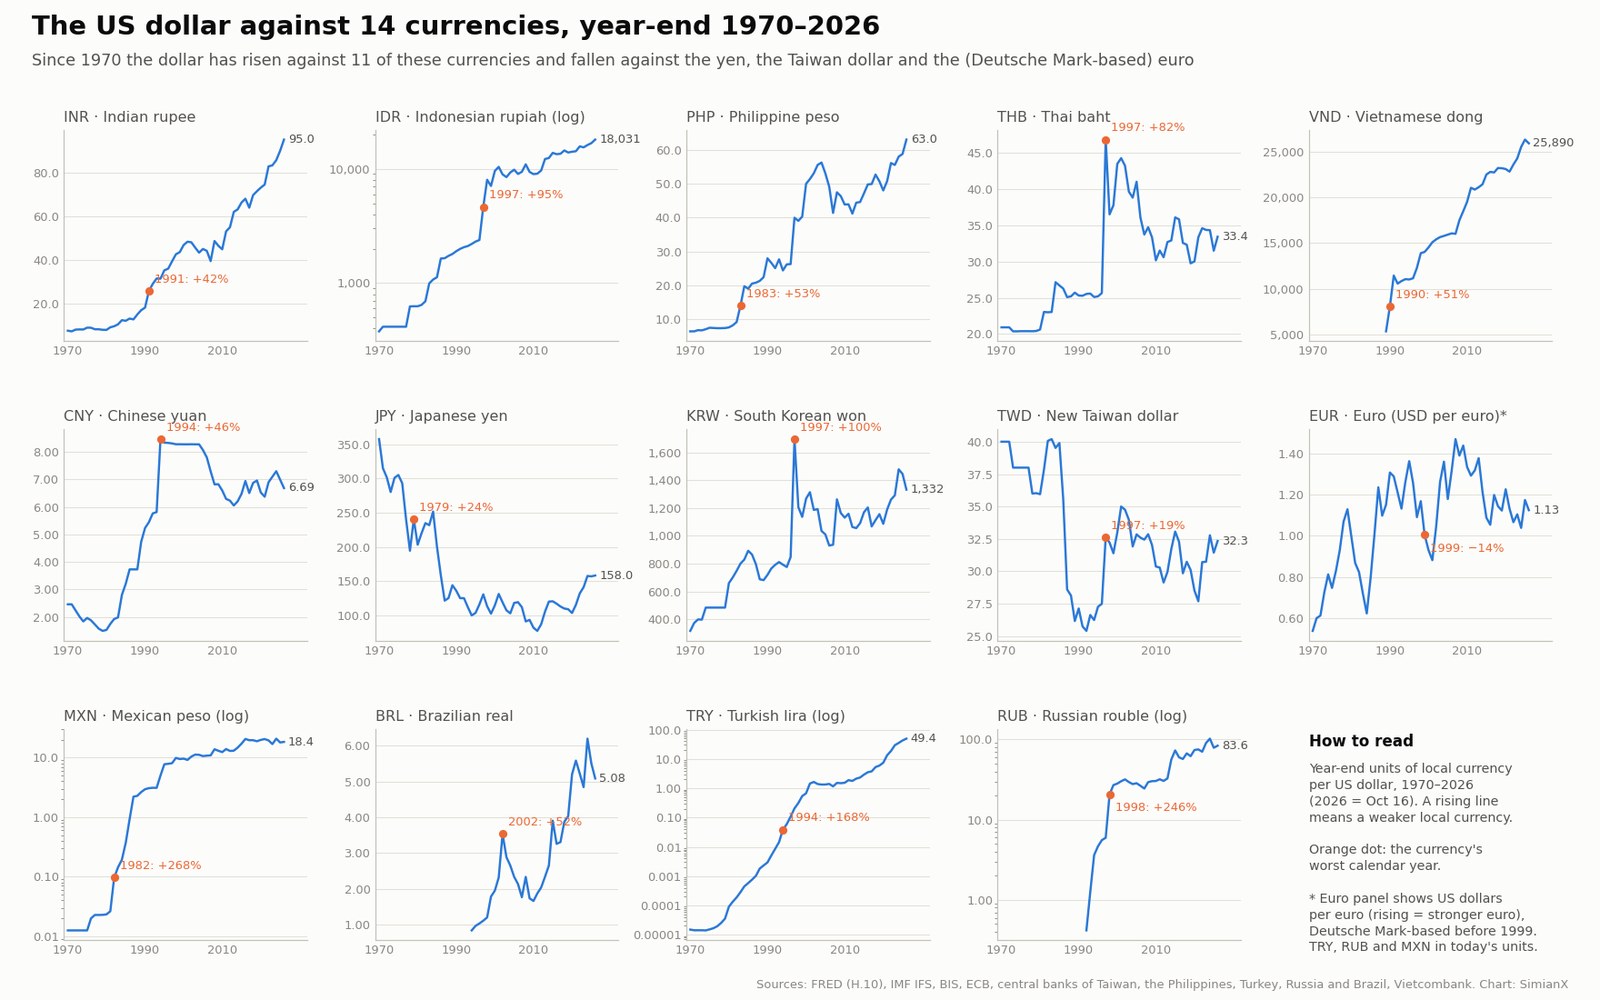
Why the dollar's exchange rate moves: the big episodes since 1971
The same handful of global events shows up in almost every column of the tables.
- The end of Bretton Woods (1971–1973). On August 15, 1971 the United States stopped converting dollars into gold, the Smithsonian Agreement of December 1971 set new parities, and the major currencies floated from 1973 (Federal Reserve History: gold convertibility ends, the Smithsonian Agreement). The yen, fixed at 360 per dollar since 1949, ended 1971 at ¥315.01 and 1973 at ¥280.27.
- The Plaza Accord (September 1985). Five governments agreed to push the dollar down (Plaza Accord). The yen went from ¥240.10 on September 20, 1985 to ¥121.25 at the end of 1987, and the Deutsche Mark from DM 3.1480 at the end of 1984 to DM 1.5815.
- The Latin American debt crisis (1982). Mexico's devaluations started a decade of crises in emerging markets (Federal Reserve History: Latin American debt crisis). The dollar's price in Mexican pesos rose 268% in 1982 and the Philippine peso lost ground in 1983–84 (+52.7% and +41.1%).
- The Asian financial crisis (1997–1998). Thailand let the baht float on July 2, 1997: FRED's noon rate went from ฿24.52 on July 1 to ฿30.18 on July 2 (Federal Reserve History: Asian financial crisis). In calendar 1997 the dollar rose 82.5% against the baht, 95.1% against the rupiah, 100% against the won, 52.1% against the Philippine peso and 18.7% against the Taiwan dollar.
- Russia's default (August 1998). The rouble went from 6.29 per dollar (Bank of Russia rate of August 15, 1998) to 20.65 at the end of 1998 (1998 Russian financial crisis).
- Pegs that broke: Brazil (January 1999) and Turkey (February 2001). The dollar rose 48.0% against the real in 1999 and 115% against the lira in 2001 (Plano Real, US Congressional Research Service on Turkey).
- The global financial crisis (2008). Investors ran to the dollar and the yen (Federal Reserve History: the Great Recession). In 2008 the dollar rose 34.9% against the won, 31.9% against the real, 31.3% against the lira, 26.7% against the Mexican peso and 23.3% against the rupee, but fell 18.7% against the yen.
- The 2022 Fed hiking cycle. As US rates rose fastest since the 1980s (every Fed hike since 1994), the dollar gained 14.4% against the yen and 11.2% against the rupee in 2022, and the euro fell to $0.9565 on September 28, 2022, below parity for the first time since 2002.
- 2025, a weak-dollar year. The euro gained 13.1% against the dollar, and the dollar fell 23.0% against the rouble, 13.7% against the Mexican peso and 11.1% against the real; it still rose 21.4% against the lira and 5.0% against the rupee.
Behind these episodes sit three slower forces: inflation differences (a country with persistently higher inflation than the US sees its currency lose value over time, which is the main story of the lira, the rouble and the Mexican peso before 1994), interest-rate differences, and the exchange-rate regime a central bank chooses (pegs, crawling bands or free floats). The country sections of the translated pages list the specific devaluations, regime changes and redenominations behind each currency.
Year-end rate or annual average: which number to use
The two numbers answer different questions. The year-end rate is what one dollar cost on the last trading day of the year; it is the right number for valuing something held at year-end (a bank balance, a portfolio, a debt). The annual average smooths out the year and is the number used to convert a whole year's income, prices or GDP. They can be far apart in a crisis year: in 1997 the won ended the year at ₩1,695.00 per dollar but averaged ₩953.19, and in 1998 the rupiah ended at Rp8,025 but averaged Rp10,014. A search for "1 dollar in rupees in 2000" therefore has two correct answers: ₹46.75 at the end of 2000 and ₹45.00 on average during 2000.
Rates also differ slightly between sources because they are taken at different times of day and in different markets: the Federal Reserve's H.10 series records New York noon buying rates, the ECB publishes reference rates at 14:15 Frankfurt time, and central banks such as Taiwan's and Brazil's publish their own closing or fixing rates. Gaps of a few tenths of a percent are normal; larger gaps usually mean an official rate and a market rate existed side by side, and the notes under each table say where that happened.
The same tables for gold, Bitcoin and the S&P 500 in your currency
The translated versions of three companion pages carry local-currency tables built from the same exchange rates. Gold price by year converts the London gold price at each year-end into 15 local currencies and units, back to 1970. Bitcoin returns by year shows Bitcoin's year-end price and return in each local currency since 2010. S&P 500 returns by year shows what the index returned in each local currency since 2011 and compares it with the local stock index.
FAQ
What was the dollar rate in 1947 in India?
About ₹3.31 per US dollar. India's initial par value, announced through the IMF in December 1946, was 30.225 US cents per rupee, and it held until the sterling devaluation of September 1949, when the IMF announced a new parity of ₹4.76190 per dollar (IMF press release, September 1949, via FRASER). That rate lasted until the devaluation of June 1966, when the IMF's month-end rate went from ₹4.80 (May 1966) to ₹7.58 (June 1966). The popular claim that one rupee equalled one dollar in 1947 is not supported by these records.
How much was 1 dollar in rupees in 2000?
₹46.75 at the end of 2000 and ₹45.00 on average during the year (Federal Reserve H.10 data). At the end of 1999 it was ₹43.51, and on October 16, 2026 it was ₹94.96.
When was the dollar at its highest against these currencies?
For several currencies the record is recent. The rupee's weakest daily close in the Federal Reserve series was ₹96.82 on May 20, 2026; the Philippine peso closed at a record ₱63.05 on October 16, 2026 (Bangko Sentral ng Pilipinas); the rupiah's weakest rate in ECB reference data was Rp18,150 on June 8, 2026, above the 1998 crisis month-end peak of Rp14,900 (June 1998, IMF). The won's crisis peak was ₩1,960.00 on December 23, 1997, and the yen's strongest close was ¥75.72 on October 28, 2011.
Which currency has lost the most against the dollar?
The Turkish lira. One dollar cost 0.0000149 new lira at the end of 1970 (14.93 old lira, before six zeros were removed in 2005) and 49.3573 on October 16, 2026, so the dollar costs 3,307,022× as many lira. Since the end of 1999 alone the lira has lost 98.9% of its dollar value. The rouble and the Mexican peso follow, both of which also dropped three zeros (in 1998 and 1993).
Which currencies are stronger against the dollar than in 1971?
The Japanese yen (+126% in dollar value since the end of 1970), the New Taiwan dollar (+23.7%) and the euro measured through the Deutsche Mark (+110%). All three economies ran persistent trade surpluses and lower inflation than most of the other economies in the table.
Why do two websites show different rates for the same year?
Usually because one shows the year-end rate and the other the annual average, or because they use different sources (an official fixing versus a market rate). In a few periods official and market rates genuinely differed: India's dual rate in 1992–93, Mexico's controlled and free rates in 1982–1991, China before the 1994 unification, Thailand's onshore and offshore baht in 2006–2007, and Vietnam's central rate versus the market rate. The notes under each country table name the source used for every period.
Why do old Turkish, Russian and Mexican rates look so small?
Because the tables use today's currency units. Turkey removed six zeros on January 1, 2005 (1,000,000 old lira = 1 new lira), Russia removed three on January 1, 1998, and Mexico three on January 1, 1993. A 2001 year-end rate of 1.4466 new lira is the same as 1,446,638 old lira per dollar.
Will the dollar go up or down next year?
This page does not forecast exchange rates. It records what happened. For the interest-rate decisions that move the dollar, see the latest Fed decision page.
Methodology and sources
- Year-end rate: the rate on the last trading day on or before December 31. For the euro (from 1999): ECB reference rate (cross-checked with Federal Reserve H.10). Rupee, yen, won, yuan, baht and Mexican peso: Federal Reserve H.10 noon buying rates in New York via FRED, with IMF end-of-month rates before the H.10 series starts (rupee 1970–72, won/yuan/baht 1970–80, Mexican peso 1970–92). Rupiah: IMF end-of-period rate (Bank Indonesia's rate). New Taiwan dollar: Central Bank of the Republic of China (Taiwan) Taipei interbank close from 1993, H.10 for 1983–92, CBC December average before 1983. Philippine peso: Bangko Sentral ng Pilipinas closing rate. Turkish lira: Central Bank of the Republic of Türkiye indicative buying rate from 1996, IMF before. Rouble: Bank of Russia official rate set on the last working day. Real: Banco Central do Brasil PTAX. Dong: the market rate in the Central Bank of the Republic of China (Taiwan)'s daily table of interbank rates for Asian currencies, from November 2006, Vietcombank for the latest rate, IMF (State Bank of Vietnam central rate) before. Deutsche Mark, French franc and peseta 1970–98: IMF end-of-period rates.
- Annual average: Federal Reserve annual averages of daily H.10 rates where available (euro, rupee, yen, won, yuan, baht, Mexican peso), the CBC annual average for the Taiwan dollar, Bangko Sentral ng Pilipinas for the Philippine peso, the mean of daily Bank of Russia and Banco Central do Brasil rates for the rouble and the real, the mean of daily CBC market quotes for the dong from 2007, and IMF annual averages otherwise. The 2026 average runs from January 1 to October 16, 2026 (ECB reference rates, or the same daily source as the year-end column).
- Second source: every year-end and every average was compared with a second source from a different publisher where one exists (the IMF, the ECB, the CBC or the BIS exchange-rate statistics), plus Vietcombank and Yahoo Finance for the latest rates. Most gaps are below 1%; the larger ones are explained in the notes under each country table.
- Change in year: year-end to year-end change in the dollar's price in that currency (for the euro, the change in the euro's price in dollars). A positive number means a stronger dollar, except in euro tables.
- Redenominations: Turkish lira (2005, 1,000,000:1), Russian rouble (1998, 1,000:1) and Mexican peso (1993, 1,000:1) are shown in today's units. The Brazilian real starts in July 1994, the dong in 1989 (when Vietnam unified its official and market rates) and the rouble in July 1992 (first Bank of Russia market rate).
- Euro before 1999: a synthetic rate built from the Deutsche Mark, the French franc or the Spanish peseta at their irrevocable conversion rates (1 euro = 1.95583 DM = 6.55957 francs = 166.386 pesetas, European Central Bank). German, French and Spanish versions of this page each use their own former currency.
- Daily highs and lows quoted in the text come from one daily series each (FRED, ECB, Bangko Sentral ng Pilipinas, Bank of Russia, CBC or Banco Central do Brasil) and are cross-checked with Yahoo Finance where Yahoo has data.
Related Reading
- Gold Price by Year: Every Year 1971–2026 With Returns Table
- Bitcoin Returns by Year: Every Year 2011–2026 Table
- S&P 500 Returns by Year: Every Year 1928–2026 Table
- Nasdaq Returns by Year: Every Year 1972–2026 Table
- Dow Jones Returns by Year: Every Year 1915–2026 Table
- Fed Interest Rate Decision: Latest FOMC Result and History
- Market history: all SimianX reference pages
References
- Federal Reserve Board — H.10 historical exchange rates
- FRED — Federal Reserve Bank of St. Louis economic data
- BIS — exchange-rate statistics
- IMF — International Financial Statistics, exchange rates
- World Bank — official exchange rate, period average
- European Central Bank — euro reference exchange rates
- Central Bank of the Republic of China (Taiwan) — NTD/USD interbank closing rate
- Bangko Sentral ng Pilipinas
- Central Bank of the Republic of Türkiye
- Bank of Russia — official exchange rates
- Banco Central do Brasil — historical exchange rates
- Wikipedia — the Plaza Accord
- Federal Reserve History — the Asian financial crisis
- IMF press releases on par value changes, September 1949 (FRASER)