
Bitcoin Annual Returns: Every Calendar Year Since 2011 and 2026 So Far
Updated October 2026. Data through the October 15, 2026 close (UTC). The 2026 row will be finalized after the December 31, 2026 close.
Short answer: Bitcoin rose in 11 of the 15 calendar years from 2011 to 2025. Its median annual return was +121%; from the end of 2013 it compounded at 49% a year. Best year: 2013, +5,286%. Worst: 2018, −73.5%. 2026 through October 15: −6.2%, at $82,116.
This page lists Bitcoin returns by year for every calendar year since 2011, the first full year of exchange trading, plus 2026 to date. For each year it gives the year-end price, the calendar-year return, the highest and lowest daily close, and the largest decline inside the year, with every year-end price checked against at least two independent data sources. It also compares Bitcoin with the S&P 500 and gold in the same years, groups the years by their position in the four-year halving cycle, and lists the dates of every all-time high. For the quarter-by-quarter view, see our Bitcoin quarterly returns table.
Bitcoin historical returns at a glance
| Measure (calendar-year price return) | 2011–2025 | 2014–2025 | 2016–2025 | 2018–2025 | 2020–2025 |
|---|---|---|---|---|---|
| Years | 15 | 12 | 10 | 8 | 6 |
| Up years | 11 (73%) | 8 (67%) | 7 (70%) | 5 (63%) | 4 (67%) |
| Median annual return | +121% | +77.1% | +108% | +77.1% | +90.5% |
| Compound annual growth | +131% | +49.0% | +70.2% | +25.8% | +51.7% |
| Best year | +5,286% (2013) | +1,337% (2017) | +1,337% (2017) | +305% (2020) | +305% (2020) |
| Worst year | −73.5% (2018) | −73.5% (2018) | −73.5% (2018) | −73.5% (2018) | −64.4% (2022) |
The arithmetic average of Bitcoin's yearly returns is not shown because a few early years distort it: averaged over 2011–2025 it comes to +598% a year, driven by 2013 (+5,286%), 2011 (+1,471%) and 2017 (+1,337%). The median and the compound rate describe the record better. From the 2010 year-end price of $0.30 to the 2025 year-end price of $87,517, Bitcoin compounded at 131% a year; from the end of 2013 ($729.56), at 49.0% a year. The start date changes the rate: from the end of 2017, after that year's rally, it was 25.8%.
Bitcoin returns by year: the complete table, 2011–2026
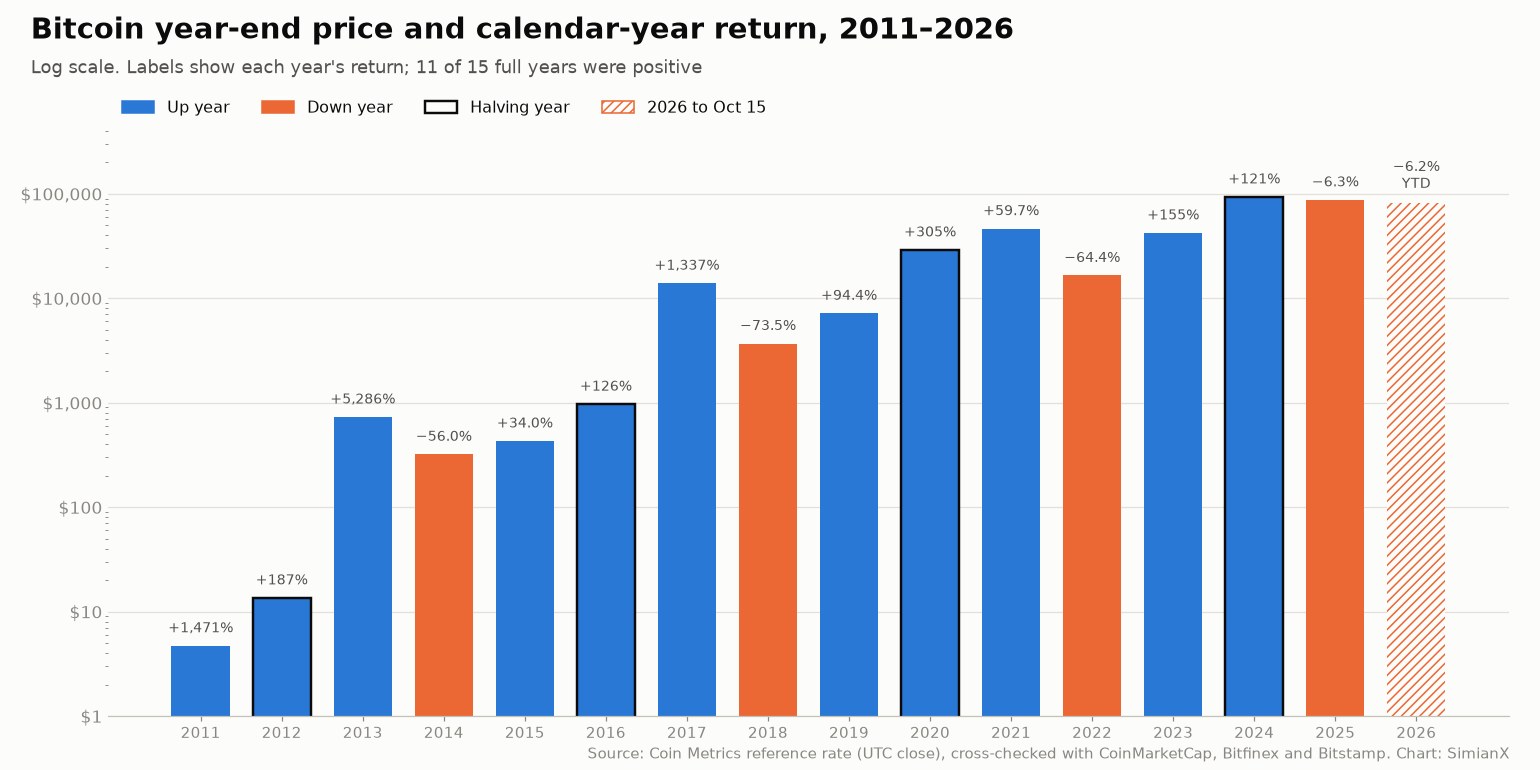
Newest first. Down years are in bold. Prices are in U.S. dollars at the end of each UTC day; "largest decline within the year" is the deepest fall from a high close to a later low close inside the calendar year, starting from the previous year-end price.
| Year | Year-end price | Calendar-year return | Highest close | Lowest close | Largest decline within the year |
|---|---|---|---|---|---|
| 2026 (to Oct 15) | $82,116 | −6.2% | $97,044 | $58,525 | −39.7% |
| 2025 | $87,517 | −6.3% | $124,824 | $76,351 | −32.1% |
| 2024 | $93,390 | +121% | $106,116 | $39,577 | −26.3% |
| 2023 | $42,217 | +155% | $44,205 | $16,607 | −20.0% |
| 2022 | $16,524 | −64.4% | $47,560 | $15,758 | −66.9% |
| 2021 | $46,355 | +59.7% | $67,542 | $29,381 | −53.1% |
| 2020 | $29,023 | +305% | $29,023 | $4,959 | −52.1% |
| 2019 | $7,167 | +94.4% | $12,863 | $3,359 | −48.6% |
| 2018 | $3,687 | −73.5% | $17,104 | $3,185 | −81.4% |
| 2017 | $13,921 | +1,337% | $19,641 | $788.31 | −35.8% |
| 2016 | $968.97 | +126% | $979.96 | $366.34 | −31.3% |
| 2015 | $429.68 | +34.0% | $464.62 | $175.64 | −45.2% |
| 2014 | $320.66 | −56.0% | $914.46 | $310.44 | −66.1% |
| 2013 | $729.56 | +5,286% | $1,135 | $13.28 | −71.2% |
| 2012 | $13.55 | +187% | $13.76 | $4.26 | −41.8% |
| 2011 | $4.71 | +1,471% | $29.03 | $0.29 | −92.7% |
Notes: Year-end prices are the Coin Metrics reference rate at 00:00 UTC, cross-checked with CoinMarketCap daily closes, Bitfinex (from 2013) and Bitstamp (2011–2014). Before 2020 the sources differ more, because trading was spread across fewer, less connected exchanges. CoinMarketCap's closes give these returns where the two disagree by more than one point (or more than 1% of a three- or four-digit figure): 2011 +1,437%, 2012 +193%, 2013 +5,474%, 2014 −57.5%, 2016 +124%, 2017 +1,369% and 2019 +92.2%. For the 2013 year-end, CoinMarketCap shows $754.01, while Coin Metrics ($729.56), Bitfinex ($729.99) and Bitstamp ($732.00) agree within 0.5%; the three-source value is used. Highest and lowest closes before 2020 also differ by up to 4% between sources; the largest gap is the 2014 high ($914 here, $953 on CoinMarketCap, which then included Mt. Gox prices). From 2020 to 2026 every return agrees within 2 points in all sources. The 2010 year-end price of $0.30 is the same in Coin Metrics and CoinMarketCap.
Bitcoin vs. S&P 500 vs. gold: the same-year comparison
| Year | Bitcoin | S&P 500 | Gold |
|---|---|---|---|
| 2026 (to Oct 15) | −6.2% | +13.1% | −3.4% |
| 2025 | −6.3% | +16.4% | +64.5% |
| 2024 | +121% | +23.3% | +27.2% |
| 2023 | +155% | +24.2% | +13.1% |
| 2022 | −64.4% | −19.4% | −0.2% |
| 2021 | +59.7% | +26.9% | −3.6% |
| 2020 | +305% | +16.3% | +25.0% |
| 2019 | +94.4% | +28.9% | +18.3% |
| 2018 | −73.5% | −6.2% | −1.5% |
| 2017 | +1,337% | +19.4% | +13.1% |
| 2016 | +126% | +9.5% | +8.5% |
| 2015 | +34.0% | −0.7% | −10.4% |
| 2014 | −56.0% | +11.4% | −1.8% |
| 2013 | +5,286% | +29.6% | −28.0% |
| 2012 | +187% | +13.4% | +7.1% |
| 2011 | +1,471% | −0.003% | +10.2% |
| 2014–2025 (12 years) | Bitcoin | S&P 500 | Gold |
|---|---|---|---|
| Up years | 8 | 9 | 7 |
| Median annual return | +77.1% | +16.3% | +10.8% |
| Compound annual growth | +49.0% | +11.5% | +11.2% |
| Best year | +1,337% (2017) | +28.9% (2019) | +64.5% (2025) |
| Worst year | −73.5% (2018) | −19.4% (2022) | −10.4% (2015) |
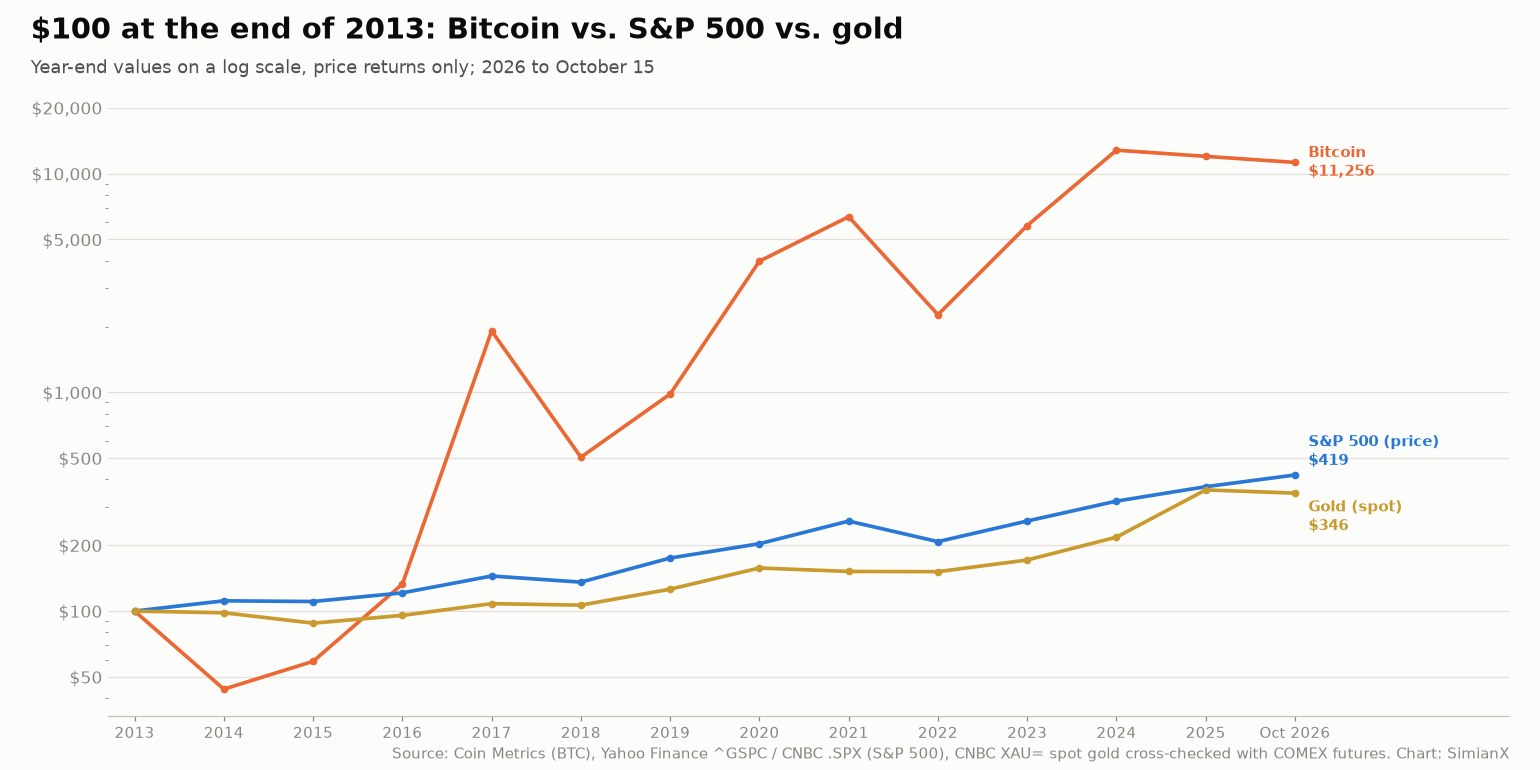
| $100 at the end of 2013 grew to | $11,996 | $370 | $358 |
Bitcoin had the highest return of the three in 11 of the 15 years from 2011 to 2025, and the lowest in the other four — 2014, 2018, 2022 and 2025, its four down years. In each of those four years both the S&P 500 and gold did better. In 2018 and 2022 all three ended lower; in 2014 and 2025 Bitcoin fell while the S&P 500 rose. The widest gap came in 2025: Bitcoin −6.3%, the S&P 500 +16.4% and gold +64.5%, gold's best year in the period. From 2011 to 2025, the S&P 500 compounded at 12.0% a year and gold at 7.7%, against 131% for Bitcoin.
The S&P 500 figures are the price returns from our S&P 500 returns by year table. Gold is the year-end spot price (CNBC, XAU=), which closed 2025 at $4,314.86 and stood at $4,170.20 on October 15, 2026 (−3.4% for the year); COMEX gold futures (Yahoo Finance, GC=F) give returns within 0.7 point of the spot figures in every year. How gold has behaved in recessions is covered in our gold safe-haven scorecard.
How often does Bitcoin fall in a year?
From 2011 to 2025 Bitcoin finished 4 of 15 calendar years lower: 2014 (−56.0%), 2018 (−73.5%), 2022 (−64.4%) and 2025 (−6.3%). The first three were deep losses that followed a record-setting year; 2025 was a small loss in a year that also set a record. Bitcoin has never had two down years in a row. If 2026, down 6.2% through October 15, ends lower, it will be the first time.
The other eleven years were gains, and ten of them were gains of more than 50%; only 2015 (+34.0%) rose by less. A typical up year for Bitcoin would rank among the best years on record for the S&P 500 or gold.
Every year had a deep decline inside it
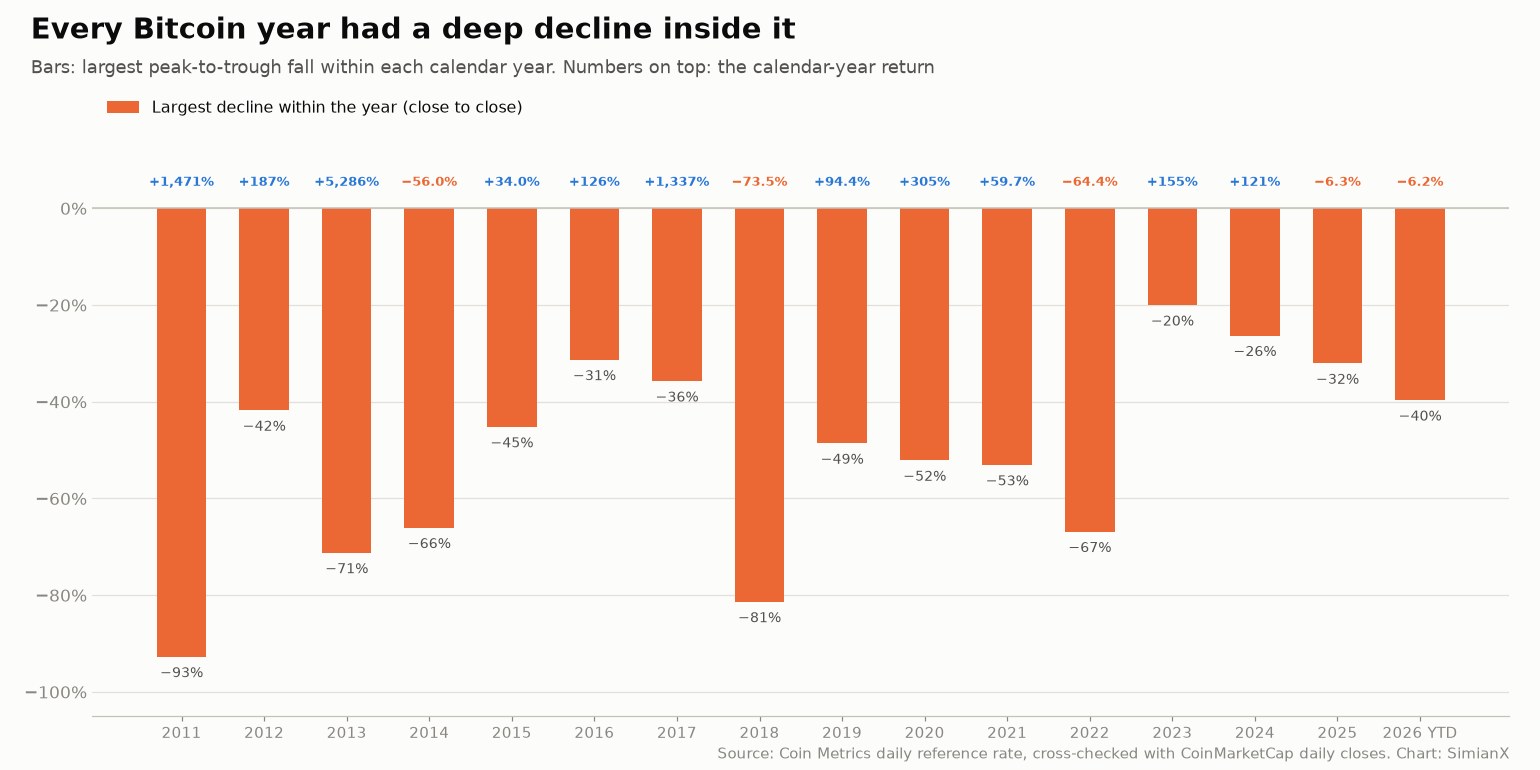
Even in its strongest years, Bitcoin fell sharply at some point between January and December. The median largest decline inside a calendar year from 2011 to 2025 was 48.6%. The smallest was 20.0%, in 2023; in every other year the price fell more than 25% from a high close at some point. In 2013 it rose 5,286% for the year but lost 71.2% between April 9 and July 6; in 2017 it gained 1,337% but fell 35.8% between June 11 and July 16; in 2021 it gained 59.7% after a 53.1% fall between April 13 and July 20.
The deepest declines inside a year were 2011 (−92.7%, from $29.03 on June 8 to $2.11 on November 18) and 2018 (−81.4%, from $17,104 on January 6 to $3,185 on December 15). The full list of declines of 50% or more, with recovery times, is in our Bitcoin crash history.
Bitcoin returns by halving cycle
Bitcoin's issuance falls by half every 210,000 blocks, about every four years. The four halvings so far were mined on November 28, 2012 (block 210,000), July 9, 2016 (block 420,000), May 11, 2020 (block 630,000) and April 20, 2024 UTC (block 840,000; the evening of April 19 in U.S. time zones), according to the block timestamps on mempool.space and Blockstream's explorer. Grouping the calendar years by their position in that cycle gives this pattern:
| Position in the cycle | Years | Calendar-year returns | Up years | Median |
|---|---|---|---|---|
| Year before a halving | 2011¹, 2015, 2019, 2023 | +1,471%, +34.0%, +94.4%, +155% | 4 of 4 | +125% |
| Halving year | 2012, 2016, 2020, 2024 | +187%, +126%, +305%, +121% | 4 of 4 | +156% |
| Year after a halving | 2013, 2017, 2021, 2025 | +5,286%, +1,337%, +59.7%, −6.3% | 3 of 4 | +698% |
| Second year after a halving | 2014, 2018, 2022, 2026 | −56.0%, −73.5%, −64.4%, −6.2% (to Oct 15) | 0 of 3 completed | −64.4% |
¹ 2011 preceded the first halving; there was no earlier one.
Every halving year and every year before a halving has been positive. The year after a halving produced the largest gains, and each of the three completed second years after a halving lost more than 50%. Four cycles are a small sample, and the pattern has weakened: the year-after gain fell from +5,286% to +1,337% to +59.7% to −6.3%, and 2026 is down far less than 2014, 2018 or 2022 were at the same point of the year (−6.2% on October 15, against −45.9%, −53.7% and −58.9%). The next halving is expected in 2028; peak dates, prices and timing for each cycle are in our halving cycles reference, and every SimianX crypto-cycle reference page is listed on the crypto cycles topic hub.
Bitcoin all-time highs: every record year
| Year | First record close of the year | Highest close of the year (record) |
|---|---|---|
| 2011 | January 21, 2011 | June 8, 2011: $29.03 |
| 2013 | February 19, 2013 | December 4, 2013: $1,135 |
| 2017 | February 23, 2017 | December 16, 2017: $19,641 |
| 2020 | November 30, 2020 | December 31, 2020: $29,023 |
| 2021 | January 1, 2021 | November 8, 2021: $67,542 |
| 2024 | March 4, 2024 | December 17, 2024: $106,116 |
| 2025 | May 20, 2025 | October 6, 2025: $124,824 |
Bitcoin set new record closes in 7 of its 16 calendar years of trading; the other nine — 2012, 2014, 2015, 2016, 2018, 2019, 2022, 2023 and 2026 so far — passed without one. The current record close is $124,824 on October 6, 2025; the intraday high that day was above $126,000 on both CoinMarketCap ($126,198) and Bitfinex ($126,110). On CoinMarketCap's closes, the first 2011 record falls on January 22 and the 2011 high on June 9 ($30.06), the first 2013 record on February 22, the first 2017 record comes on January 4 and the first 2025 record on January 21, when its close passed the December 2024 record by about $5.
After each cycle high, Bitcoin fell far before setting the next one: −92.7% after June 2011 (to November 18, 2011), −84.5% after December 2013 (to January 14, 2015), −83.8% after December 2017 (to December 15, 2018), −76.7% after November 2021 (to November 9, 2022), and −53.1% so far after October 2025 (to June 30, 2026). How the current decline compares with earlier cycles one year after the peak is covered in our Bitcoin one-year-after-the-peak study.
2026 so far
Through October 15, 2026, Bitcoin stood at $82,116, down 6.2% from its 2025 year-end price of $87,517. Its highest close of the year was $97,044 on January 14; its lowest, $58,525 on June 30, a decline of 39.7% within the year. On October 15 it was 34.2% below its record close of October 6, 2025. Over the same period the S&P 500 gained 13.1% and gold lost 3.4%.
2026 is the second year after the April 2024 halving, the position in which 2014, 2018 and 2022 each lost more than 50%; on October 15 of those years Bitcoin was down 45.9%, 53.7% and 58.9% for the year. If 2026 ends lower, it will be Bitcoin's first pair of consecutive down years. Live analysis of the current market is on the Bitcoin page of the SimianX crypto leaderboard, and Market Pulse scores crypto-moving news as it breaks.
How to read Bitcoin's historical returns
- The start date dominates the answer. Starting in 2011 gives a compound rate of 131% a year; starting at the end of 2013 gives 49%; starting at the end of 2017 gives 25.8%. Quoting a Bitcoin return without its period says little.
- Averages mislead more than medians. A single year such as 2013 (+5,286%) raises the arithmetic average of 15 years by more than 350 points.
- Year-end prices depend on the time and the source. Bitcoin trades around the clock, so this page uses the price at 00:00 UTC; a U.S. close or a single exchange can differ by a few percent, especially before 2020.
- Calendar years hide the path. Every year on record contained a decline of at least 20%, and most a decline of more than 40%.
- Returns are in nominal U.S. dollars. Inflation is not removed, and there is no dividend or yield component.
Frequently asked questions
What is Bitcoin's average annual return?
From 2011 to 2025 the median calendar-year return was +121% and the compound annual growth rate 131%. From the end of 2013 to the end of 2025 Bitcoin compounded at 49.0% a year, and from the end of 2017 at 25.8%. The arithmetic average (+598%) is distorted by 2013, 2011 and 2017.
What was Bitcoin's best year?
2013, when the price rose 5,286%, from $13.55 to $729.56. The next best were 2011 (+1,471%), 2017 (+1,337%) and 2020 (+305%). Since 2018 the best year was 2020.
What was Bitcoin's worst year?
2018, at −73.5% (from $13,921 to $3,687). The other down years were 2022 (−64.4%), 2014 (−56.0%) and 2025 (−6.3%).
How many years has Bitcoin gone down?
Four of 15 full calendar years from 2011 to 2025: 2014, 2018, 2022 and 2025. It has never fallen in two consecutive years; 2026 was down 6.2% through October 15.
What is Bitcoin's return in 2026 so far?
−6.2% through October 15, 2026 ($82,116 vs. $87,517 at the end of 2025). The year's highest close was $97,044 on January 14 and its lowest $58,525 on June 30.
What was Bitcoin's price at the end of each year?
$4.71 (2011), $13.55 (2012), $729.56 (2013), $320.66 (2014), $429.68 (2015), $968.97 (2016), $13,921 (2017), $3,687 (2018), $7,167 (2019), $29,023 (2020), $46,355 (2021), $16,524 (2022), $42,217 (2023), $93,390 (2024) and $87,517 (2025).
How does Bitcoin do in halving years?
All four halving years — 2012, 2016, 2020 and 2024 — were positive, with returns of +121% to +305%. The year before each halving was also positive every time, while each completed second year after a halving (2014, 2018, 2022) lost more than 50%.
Has Bitcoin beaten gold and the S&P 500?
Over 2014–2025, $100 grew to $11,996 in Bitcoin, $370 in the S&P 500 and $358 in gold. But Bitcoin had the lowest return of the three in each of its four down years, including 2025, when gold gained 64.5%.
Methodology and sources
- Bitcoin prices are the Coin Metrics community reference rate in U.S. dollars at the end of each UTC day (00:00 UTC). Each year-end price was cross-checked against CoinMarketCap daily closes (the source Yahoo Finance displays, so Yahoo is not counted separately), Bitfinex daily candles (from March 2013), Bitstamp daily candles (August 2011 to April 2014) and blockchain.com's market price series. Disagreements are footnoted under the main table.
- Returns are calendar-year changes from the December 31 price of the previous year to the December 31 price of the year. Highest and lowest closes and declines within the year use the same daily series; declines start from the previous year-end price.
- Halving dates are the UTC timestamps of blocks 210,000, 420,000, 630,000 and 840,000, which mempool.space and Blockstream report identically.
- S&P 500 returns come from our S&P 500 table (Yahoo Finance ^GSPC, cross-checked with CNBC .SPX). Gold is the CNBC spot price (XAU=) on the last trading day of each year, cross-checked with COMEX front-month futures on Yahoo Finance (GC=F).
- Data compiled October 16, 2026. This page is for information only and is not investment advice.
Related Reading
- Bitcoin Quarterly Returns: Full History Table 2013–2026
- Bitcoin Halving Cycles: Complete Returns Reference 2012-2028
- Every Bitcoin Crash Over 50%: Recovery Times Since 2011
- Bitcoin One Year After Its $126K Peak vs Every Past Cycle
- S&P 500 Returns by Year: Every Year 1928–2026 Table
- Gold in Every US Recession Since 1973: Safe-Haven Scorecard
- Altcoin Season History: Bitcoin Dominance Cycles 2017-2026
- Crypto cycles: all SimianX reference pages
References
- Coin Metrics — Community network data (BTC PriceUSD)
- CoinMarketCap — Bitcoin historical data
- Bitfinex — BTC/USD
- Bitstamp — BTC/USD market
- Blockchain.com — Bitcoin market price chart
- mempool.space — Block 840,000
- CNBC — Gold spot price (XAU=)
- Yahoo Finance — Gold futures (GC=F)
- Bitcoin: A Peer-to-Peer Electronic Cash System (bitcoin.org)
- Wikipedia — Bitcoin
- Wikipedia — Mt. Gox