
Testing the Safe-Haven Claim: Gold's Real Recession Record
Does gold go up in a recession? It is one of the most repeated beliefs in markets: when the economy contracts and equities fall, gold supposedly rides to the rescue. The idea is intuitive — but it is not automatically true. To find out how dependable gold really is, we scored it against the S&P 500 across all seven US recessions since 1973, the era in which gold has traded freely after the collapse of the Bretton Woods system.
The short answer: gold is a good recession hedge, not a guaranteed one. Across the seven downturns, gold delivered an average return of about +16% while the S&P 500 averaged roughly −7%. But that average hides an enormous spread — a single recession (1973–75) did most of the heavy lifting, and in two recessions gold actually lagged stocks. This reference lays out the full scorecard, the charts, a recession-by-recession breakdown, and — most importantly — why gold wins some recessions and loses others.
How we measured it (methodology)
A reference table is only useful if the rules are explicit, so here are ours:
- Recession dates come from the National Bureau of Economic Research (NBER), the official arbiter of US business cycles. We measure each downturn from its peak month to its trough month.
- Gold is the London PM fix (LBMA), measured over that same peak-to-trough window.
- The S&P 500 is the price index (excluding dividends) over the identical window, so gold and stocks are compared on the same footing.
- Figures are month-level and rounded to the nearest percent. They describe the official recession window itself — not the full peak-to-trough drawdown of a bear market, which usually starts before and ends after the recession.
Measuring inside the NBER window matters. A bear market and a recession are not the same thing: stocks typically peak before the economy does and bottom before the recession officially ends. Anchoring every row to the same business-cycle dates keeps the comparison honest. For the equity-only view, see our companion reference on every S&P 500 bear market since 1929.
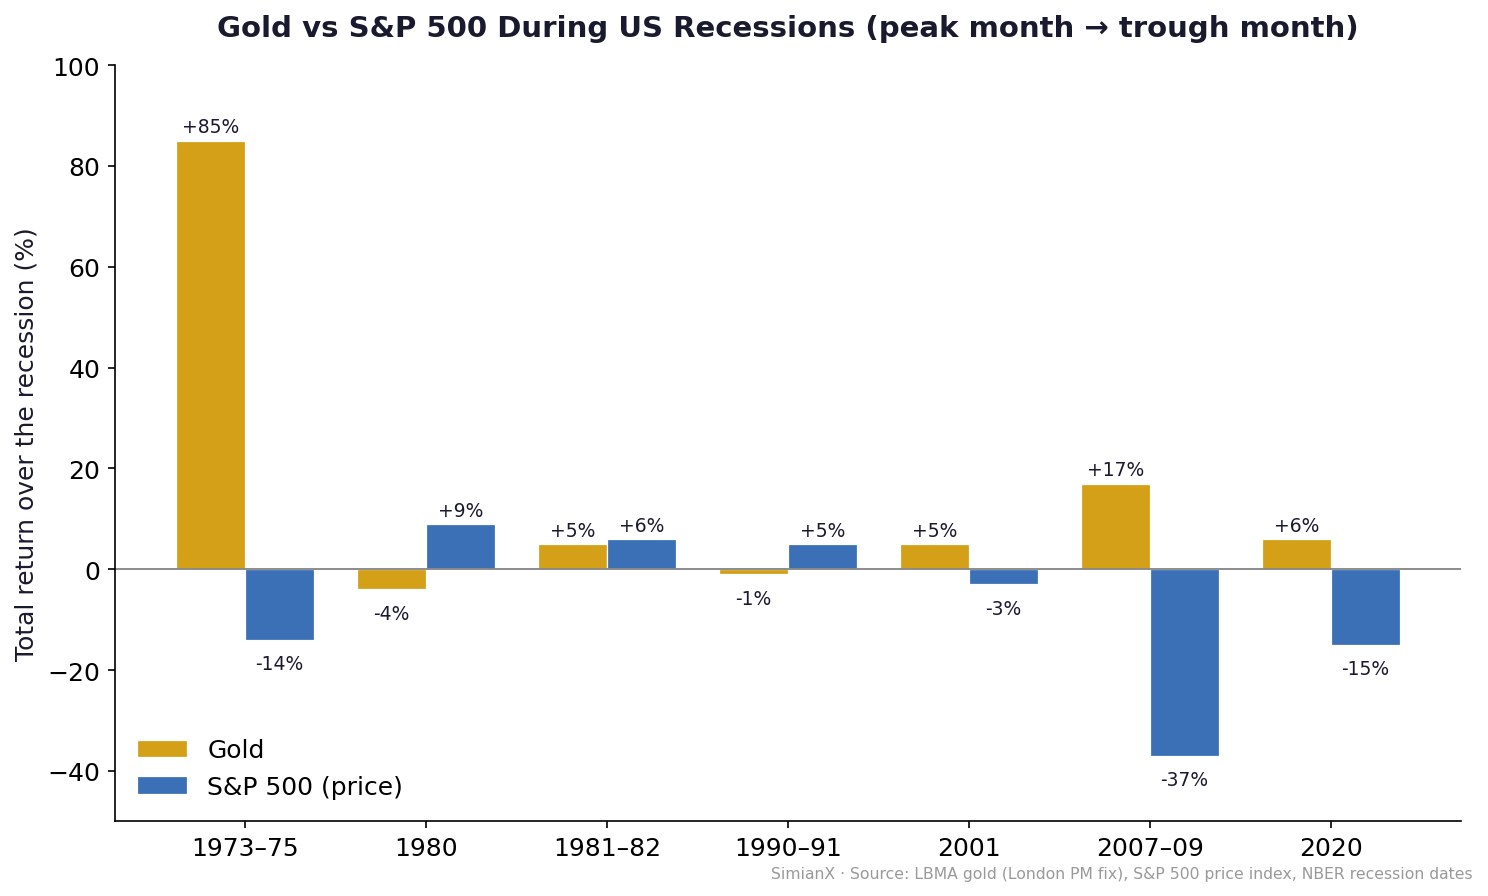
The scorecard: gold vs the S&P 500 in every recession since 1973
| Recession (NBER) | Length | Gold | S&P 500 | Gold − S&P | Macro backdrop |
|---|---|---|---|---|---|
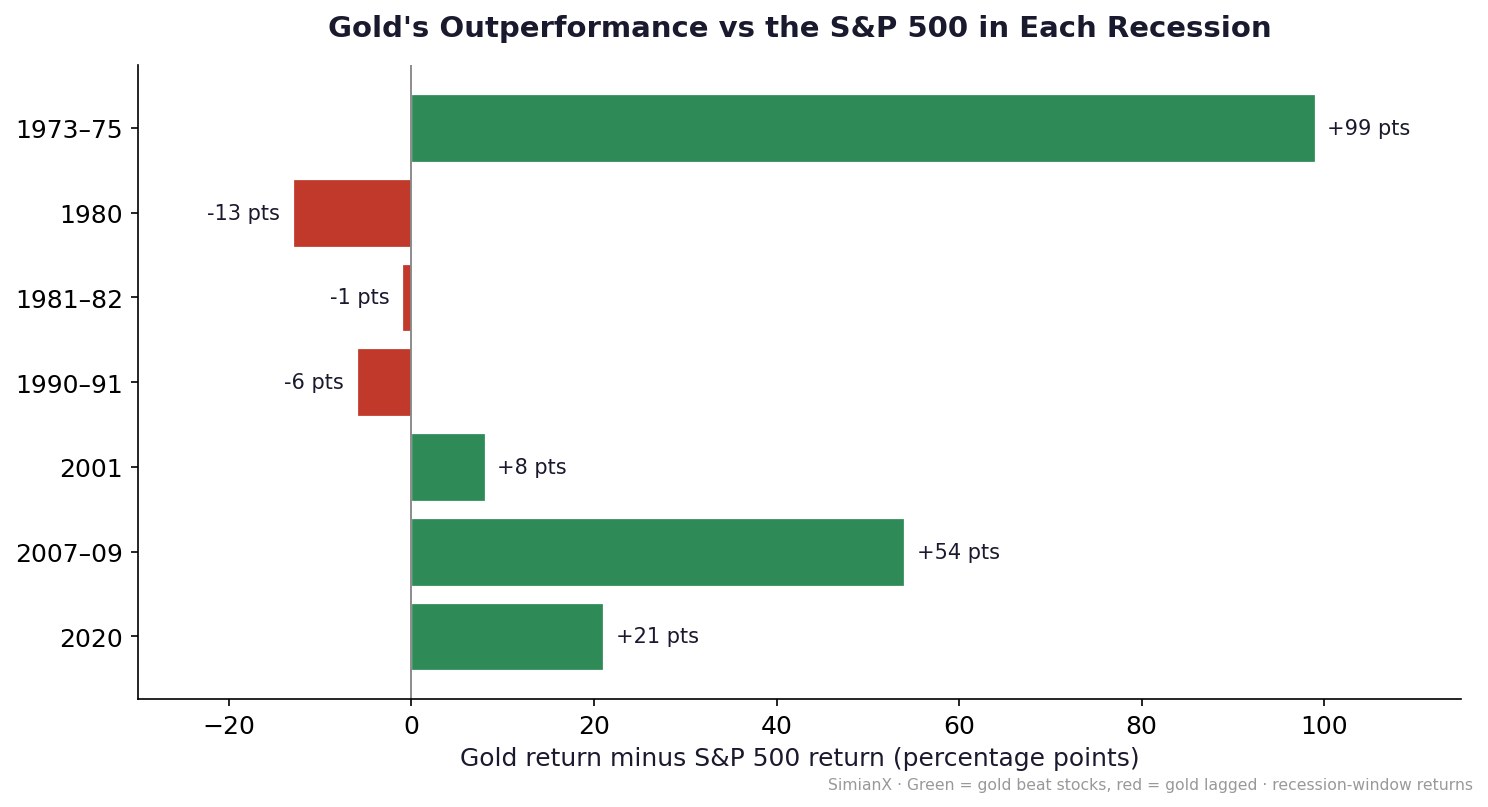
| Nov 1973 – Mar 1975 | 16 mo | +85% | −14% | +99 pts | Oil embargo, stagflation, deeply negative real rates |
| Jan 1980 – Jul 1980 | 6 mo | −4% | +9% | −13 pts | Gold just blew off an $850 top; sharp but brief slump |
| Jul 1981 – Nov 1982 | 16 mo | +5% | +6% | −1 pt | Volcker's double-digit real rates crush gold |
| Jul 1990 – Mar 1991 | 8 mo | −1% | +5% | −6 pts | Gulf War spike fades; fast equity recovery |
| Mar 2001 – Nov 2001 | 8 mo | +5% | −3% | +8 pts | Dot-com bust; gold quietly ends a 20-year bear |
| Dec 2007 – Jun 2009 | 18 mo | +17% | −37% | +54 pts | Global financial crisis; zero rates and QE begin |
| Feb 2020 – Apr 2020 | 2 mo | +6% | −15% | +21 pts | COVID crash; gold dips in the scramble, then records |
Gold finished positive in 5 of the 7 recessions and beat the S&P 500 in 4 of them, with one virtual tie (1981–82). The averages — gold +16% vs the S&P's −7% — are flattered by the 1973–75 outlier, so the medians are the more honest summary: gold +5%, S&P −3%. Even stripped of the outlier, gold has tended to hold its value while stocks fell.
Recession by recession
1973–75: gold's defining moment
Gold had only floated freely since 1971. The OPEC oil embargo, surging inflation, and deeply negative real interest rates produced the perfect environment, and gold roughly doubled off its early-1970s base while the S&P ground through one of the worst bears of the postwar era. This single episode is the origin of the phrase "gold protects you in a recession." It also overlapped the first great oil shock — see how the S&P 500 performs during oil shocks.
1980: the blow-off top backfires
The January 1980 spike to roughly $850 — driven by runaway inflation, the Soviet invasion of Afghanistan, and the Iranian revolution — was a top, not a base. When the brief 1980 recession arrived, gold was already wildly over-extended; it drifted lower while equities, helped by a fast policy turn, rallied. The lesson is timeless: starting valuation matters, and a euphoric, over-owned asset has little room left to run.
1981–82: high real rates, dead gold
Federal Reserve Chair Paul Volcker pushed the fed funds rate toward 19–20% and held real (inflation-adjusted) rates sharply positive to break inflation. Positive real rates are gold's kryptonite: a non-yielding metal cannot compete with double-digit real returns on cash and bonds. Gold went essentially nowhere, and the recession ended with the launch of an 18-year equity bull market. For the policy mirror image — what happens when the Fed cuts — see every Fed rate-cut cycle since 1980.
1990–91: the Gulf War head-fake
Iraq's invasion of Kuwait pushed gold up briefly in late 1990, but once Operation Desert Storm began in January 1991 the geopolitical premium evaporated and stocks ripped higher. Over the recession window gold was roughly flat and lagged a quick equity recovery — a reminder that a geopolitical spike is not the same as a durable recession hedge.
2001: the quiet hedge
The dot-com recession was mild for the broad economy but brutal for technology stocks. Gold was just emerging from a 20-year bear, having bottomed near $250 in 1999–2001. It added a few percent — an unspectacular but real hedge — and, more importantly, began the secular bull that would carry it past $1,900 by 2011. The 2001 downturn also coincided with a yield-curve inversion; see yield-curve inversions and US recessions.
2007–09: the textbook safe haven
This is the cleanest demonstration of gold as a crisis hedge. From the December 2007 peak to the June 2009 trough, the S&P 500 fell about 37% (and roughly 57% peak-to-trough), while gold rose about 17%. Gold did dip during the most acute phase of the panic in late 2008 — when investors sold everything to raise dollars — but it recovered first and led the rebound as the Fed cut to zero and launched quantitative easing. Negative real rates, aggressive money-printing, and systemic fear are gold's ideal cocktail. For how long stocks then took to climb back, see how long every bear market took to recover.
2020: a liquidity scare, then a record
The COVID recession was the shortest on record — just two months. In the March 2020 liquidity crash, gold briefly fell alongside everything else as the "sell everything for cash" reflex took hold. But it rebounded within weeks and went on to a record above $2,000 by August 2020 as the Fed slashed rates and fiscal stimulus flooded the system. Over the official February–April window, gold gained while the S&P dropped sharply — the same pattern as 2008, compressed into a few violent weeks.
Why gold wins some recessions and loses others
The scorecard is not random. Four forces explain almost every row:
- Real interest rates — the single biggest driver. Gold pays no yield, so it thrives when real rates are negative (1973–75, 2007–09, 2020) and struggles when they are high and positive (1981–82). If cash and bonds out-yield inflation, a non-paying metal has little appeal.
- The monetary response. Recessions met with aggressive rate cuts, quantitative easing, and fiscal stimulus (2008, 2020) devalue cash and lift gold. Recessions met with tight policy (1981–82) do the opposite.
- Systemic stress. When the crisis is about the financial system itself (2008), gold's status as a counterparty-risk-free asset shines. A garden-variety slowdown (1990–91) generates far less of that demand.
- Starting position. Gold that enters a recession euphoric and over-owned (1980) has little room left; gold that enters cheap and hated (2001) has plenty.
Put the four together and a clean pattern emerges: gold's best recessions are the stagflationary and systemic ones; its worst are the disinflationary, high-real-rate ones.
Gold versus the other safe havens
Gold is not the only defensive asset, and it is not always the best one:
- Long Treasuries often beat gold in disinflationary recessions (1981–82, 1990–91) because falling yields lift bond prices — and bonds pay a coupon while you wait.
- The US dollar tends to rally in acute global panics (late 2008, March 2020), which is exactly why gold can dip momentarily before recovering.
- "Digital gold" (bitcoin) is sometimes pitched as a modern hedge, but its recession sample is a single event (2020), in which it traded like a risk asset, not a haven. We track how bitcoin behaves after Fed rate cuts and rank BTC live, but the historical case for gold as a recession hedge is far longer and far more tested.
Many investors hold a blend — some gold, some Treasuries — precisely because the two win in different kinds of recessions.
What the scorecard means for positioning
The takeaway is not "always buy gold before a recession." It is that gold hedges the right kind of recession. Before reaching for it, ask three questions:
- Are real interest rates falling or already negative?
- Is the likely policy response aggressive easing (cuts, QE, stimulus)?
- Is the stress systemic rather than a routine slowdown?
When the answers are yes — as in 1973–75, 2007–09, and 2020 — gold has delivered. When real rates are high and rising, as in 1981–82, it has disappointed.
Reading those regime signals in real time is exactly what modern AI tooling is built for. SimianX runs a panel of frontier AI models that score macro and market conditions continuously: you can watch them debate direction on the AI model leaderboard, run credit-aware autopilots that monitor the regime around the clock, and follow both stocks and live crypto sessions in one place. See pricing to start, or browse more data-driven references in the stories archive.
Frequently asked questions
Does gold always go up in a recession? No. It rose in 5 of the last 7 US recessions and beat the S&P 500 in 4 of them. It lagged stocks in 1980 (after a blow-off top) and 1990–91 (a fast equity recovery).
Why did gold fall during the 2008 and 2020 crashes at first? In acute panics, investors sell everything — even gold — to raise cash and meet margin calls. In both cases gold recovered first and ended the recession higher than it started.
What is gold's worst enemy? High positive real interest rates, as in 1981–82, when cash and bonds out-yield a metal that pays nothing.
Gold or Treasuries in a recession? Treasuries often win disinflationary recessions (falling yields plus a coupon); gold wins stagflationary and systemic ones. Many portfolios hold both.
Is gold a better recession hedge than bitcoin? On the historical record, yes — gold has seven tested recessions, while bitcoin has one (2020), in which it behaved like a risk asset rather than a safe haven.
How much gold should a portfolio hold? This article is educational reference, not advice. Classic diversified frameworks have used roughly 5–10% gold, but the right amount depends entirely on your goals and risk tolerance.
The bottom line
Gold earned its safe-haven reputation in 1973–75 and re-earned it in 2007–09 and 2020 — the recessions defined by negative real rates, aggressive easing, and systemic fear. It failed to deliver in 1980 and 1981–82, when it was over-extended or fighting high real rates. So gold is a conditional hedge, not an automatic one. The scorecard above is the cheat sheet; the three regime questions are the key. Bookmark this table and pair it with our companion references on bear-market recoveries and yield-curve inversions to build a complete recession playbook.
Disclosure: figures are approximate, month-level, rounded measurements compiled from public LBMA gold fixings, S&P 500 price-index data, and NBER recession dates, presented for educational reference only. Nothing here is investment advice.