
 By Marcus Reeve
KOSPI Annual Returns: Every Calendar Year Since 1982 and 2026 So Far
Updated October 23, 2026. Data through the October 23, 2026 close. The 2026 row is refreshed every month and finalized after the last Korea Exchange session of the year (see "How this page is updated" below).
Short answer: From 1982 to 2025 the KOSPI's price return averaged +13.0% a year (median +8.5%, compounded 8.2%). It rose in 29 of 44 years. Best year: 1987, +92.6%. Worst: 2000, −50.9%. In US dollars the index compounded 6.5% a year. 2026 through October 23, 2026: +31.7% in won and +42.7% in dollars, even after a 39.3% fall from the record close of 9,114.55 set on June 22, 2026.
This page lists KOSPI returns by year for every calendar year from 1982, with each year-end close taken from the Bank of Korea's official statistics and checked against at least one independent source. For every year it shows the largest drop the index suffered inside that year, the return converted into US dollars at the year-end won exchange rate, and the S&P 500's return for the same year. It also covers average and compound returns over different periods, decade-by-decade results, the best and worst years, how often the KOSPI falls in a calendar year, KOSPI market capitalization by year, and what has happened in 2026.
KOSPI historical returns at a glance
| Measure (calendar-year price return) | 1982–2025 | 1990–2025 | 2000–2025 | 2016–2025 |
|---|---|---|---|---|
| Years | 44 | 36 | 26 | 10 |
| Up years | 29 (66%) | 23 (64%) | 18 (69%) | 7 (70%) |
| Average (arithmetic) | +13.0% | +8.8% | +9.4% | +11.0% |
| Median | +8.5% | +5.8% | +5.8% | +5.6% |
| Compound annual growth | +8.2% | +4.4% | +5.6% | +7.9% |
| Standard deviation | 33.0 pts | 30.5 pts | 27.8 pts | 27.2 pts |
| Best year | 1987 (+92.6%) | 1999 (+82.8%) | 2025 (+75.6%) | 2025 (+75.6%) |
| Worst year | 2000 (−50.9%) | 2000 (−50.9%) | 2000 (−50.9%) | 2022 (−24.9%) |
| Compound annual growth in US dollars | +6.5% | +2.2% | +4.7% | +5.8% |
| S&P 500 compound annual growth | +9.6% | +8.6% | +6.1% | +12.8% |
The KOSPI (Korea Composite Stock Price Index) is measured against a base of 100 on January 4, 1980, so the 2025 year-end close of 4,214.17 means the index has grown about 42.1-fold since then. The yearly statistics on this page start in 1982 because 1981 (131.30) is the first year-end close confirmed by two independent sources. The gap between the average year (+13.0%) and the compound rate (8.2%) is wide because the KOSPI's yearly results swing far more than those of the US market: a standard deviation of 33.0 points, against 15.7 for the S&P 500 over the same 44 years.
KOSPI returns by year: the complete table, 1982–2026
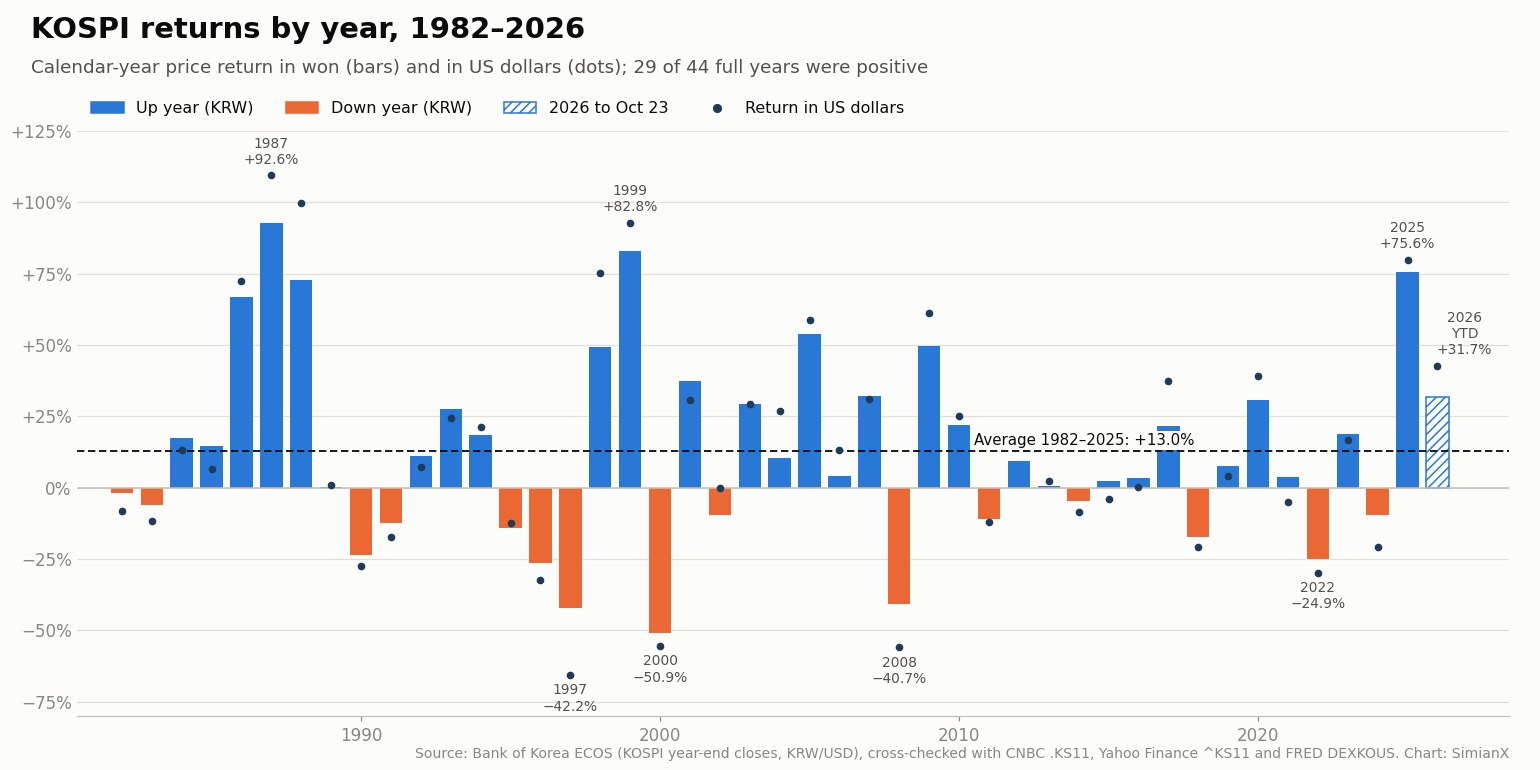
Newest first. Down years in won are in bold. All figures are price returns (dividends excluded). "Largest drop within the year" is the deepest fall from the highest close earlier in that year (or the previous year-end close) to a later close in the same year; daily data from two sources start in 1990. The US-dollar column converts each year-end close at the Bank of Korea's year-end won–dollar rate. The S&P 500 column uses the same figures as our S&P 500 returns by year table.
| Year | Year-end close | KOSPI return (won) | Largest drop within the year | KOSPI return in US dollars | S&P 500 return |
|---|---|---|---|---|---|
| 2026 (to Oct 23) | 5,550.30 | +31.7% | −39.3% | +42.7% | +11.9% |
| 2025 | 4,214.17 | +75.6% | −14.1% | +79.9% | +16.4% |
| 2024 | 2,399.49 | −9.6% | −18.4% | −20.7% | +23.3% |
| 2023 | 2,655.28 | +18.7% | −14.6% | +16.7% | +24.2% |
| 2022 | 2,236.40 | −24.9% | −27.9% | −29.7% | −19.4% |
| 2021 | 2,977.65 | +3.6% | −14.1% | −4.9% | +26.9% |
| 2020 | 2,873.47 | +30.8% | −35.7% | +39.1% | +16.3% |
| 2019 | 2,197.67 | +7.7% | −15.1% | +4.0% | +28.9% |
| 2018 | 2,041.04 | −17.3% | −23.2% | −20.7% | −6.2% |
| 2017 | 2,467.49 | +21.8% | −5.4% | +37.3% | +19.4% |
| 2016 | 2,026.46 | +3.3% | −6.4% | +0.2% | +9.5% |
| 2015 | 1,961.31 | +2.4% | −15.8% | −4.0% | −0.7% |
| 2014 | 1,915.59 | −4.8% | −8.9% | −8.6% | +11.4% |
| 2013 | 2,011.34 | +0.7% | −12.3% | +2.2% | +29.6% |
| 2012 | 1,997.05 | +9.4% | −13.7% | +17.8% | +13.4% |
| 2011 | 1,825.74 | −11.0% | −25.9% | −12.1% | +0.0% |
| 2010 | 2,051.00 | +21.9% | −10.9% | +25.0% | +12.8% |
| 2009 | 1,682.77 | +49.7% | −17.0% | +61.2% | +23.5% |
| 2008 | 1,124.47 | −40.7% | −50.5% | −55.8% | −38.5% |
| 2007 | 1,897.13 | +32.3% | −18.3% | +31.0% | +3.5% |
| 2006 | 1,434.46 | +4.0% | −17.8% | +13.3% | +13.6% |
| 2005 | 1,379.37 | +54.0% | −10.9% | +58.7% | +3.0% |
| 2004 | 895.92 | +10.5% | −23.1% | +26.8% | +9.0% |
| 2003 | 810.71 | +29.2% | −22.7% | +29.5% | +26.4% |
| 2002 | 627.55 | −9.5% | −37.7% | −0.1% | −23.4% |
| 2001 | 693.70 | +37.5% | −25.8% | +30.6% | −13.0% |
| 2000 | 504.62 | −50.9% | −52.7% | −55.4% | −10.1% |
| 1999 | 1,028.07 | +82.8% | −23.0% | +92.7% | +19.5% |
| 1998 | 562.46 | +49.5% | −51.2% | +75.1% | +26.7% |
| 1997 | 376.31 | −42.2% | −55.7% | −65.5% | +31.0% |
| 1996 | 651.22 | −26.2% | −34.0% | −32.3% | +20.3% |
| 1995 | 882.94 | −14.1% | −17.5% | −12.3% | +34.1% |
| 1994 | 1,027.37 | +18.6% | −12.2% | +21.3% | −1.5% |
| 1993 | 866.18 | +27.7% | −14.5% | +24.6% | +7.1% |
| 1992 | 678.44 | +11.1% | −33.6% | +7.2% | +4.5% |
| 1991 | 610.92 | −12.2% | −23.1% | −17.4% | +26.3% |
| 1990 | 696.11 | −23.5% | −39.0% | −27.4% | −6.6% |
| 1989 | 909.72 | +0.3% | n/a | +1.1% | +27.3% |
| 1988 | 907.20 | +72.8% | n/a | +99.9% | +12.4% |
| 1987 | 525.11 | +92.6% | n/a | +109% | +2.0% |
| 1986 | 272.61 | +66.9% | n/a | +72.4% | +14.6% |
| 1985 | 163.37 | +14.7% | n/a | +6.6% | +26.3% |
| 1984 | 142.46 | +17.5% | n/a | +13.2% | +1.4% |
| 1983 | 121.21 | −6.0% | n/a | −11.7% | +17.3% |
| 1982 | 128.99 | −1.8% | n/a | −8.1% | +14.8% |
| 1981¹ | 131.30 | — | n/a | — | — |
¹ 1981 is the base row: its close is confirmed by the Bank of Korea (ECOS) and by the annual table in Wikipedia's KOSPI article, which is based on Stooq's index history. ECOS also lists a 1980 year-end close of 106.87, but no second independent source for it was found, so the 1981 return is left out of every statistic on this page. Notes: CNBC's daily series misses the last sessions of 1983 and 1987, and Yahoo Finance's first year (1997) closes at 375.15; the Bank of Korea, Naver and the other sources agree on 376.31 and 525.11, and those values are used. Korea's stock market used to hold its last session of the year between December 26 and 28 and today closes on the last business day before December 31, so "year-end close" means that last session.
KOSPI vs. S&P 500: in won and in dollars
| 1982–2025 (44 years) | KOSPI (in won) | KOSPI (in US dollars) | S&P 500 |
|---|---|---|---|
| Up years | 29 | 27 | 34 |
| Average annual return | +13.0% | +13.9% | +10.8% |
| Median annual return | +8.5% | +6.9% | +13.5% |
| Compound annual growth | +8.2% | +6.5% | +9.6% |
| Standard deviation | 33.0 pts | 40.1 pts | 15.7 pts |
| Best year | +92.6% (1987) | +109% (1987) | +34.1% (1995) |
| Worst year | −50.9% (2000) | −65.5% (1997) | −38.5% (2008) |
| Years up 30% or more | 11 | 12 | 2 |
| Years down 20% or more | 6 | 8 | 2 |
| 100 at the end of 1981 grew to | 3,210 | 1,567 | 5,586 |
The KOSPI finished ahead of the S&P 500 in 21 of 44 years measured in won, and in 21 measured in dollars. The two indexes moved in the same direction in 33 years and in opposite directions in 11. Several of the opposite years belong to Korea's own crises: in 1997 the KOSPI lost 42.2% while the S&P 500 gained 31.0%, and in 2024 it fell 9.6% while the S&P 500 rose 23.3%. Over the full period the KOSPI's average year (+13.0%) was higher than the S&P 500's (+10.8%), but its compound rate (8.2%) was lower (9.6% for the S&P 500), because deep losses such as 1997, 2000 and 2008 cost more than the big gains returned.
Over the last ten years (2016–2025) the KOSPI beat the S&P 500 only 3 times, and its compound return of 7.9% a year trailed the S&P 500's 12.8%, even with 2025's +75.6%.
KOSPI annual returns by decade
| Period | Up years | Average | Compound annual (won) | Cumulative | Best year | Worst year | Compound annual in US dollars | S&P 500 compound annual |
|---|---|---|---|---|---|---|---|---|
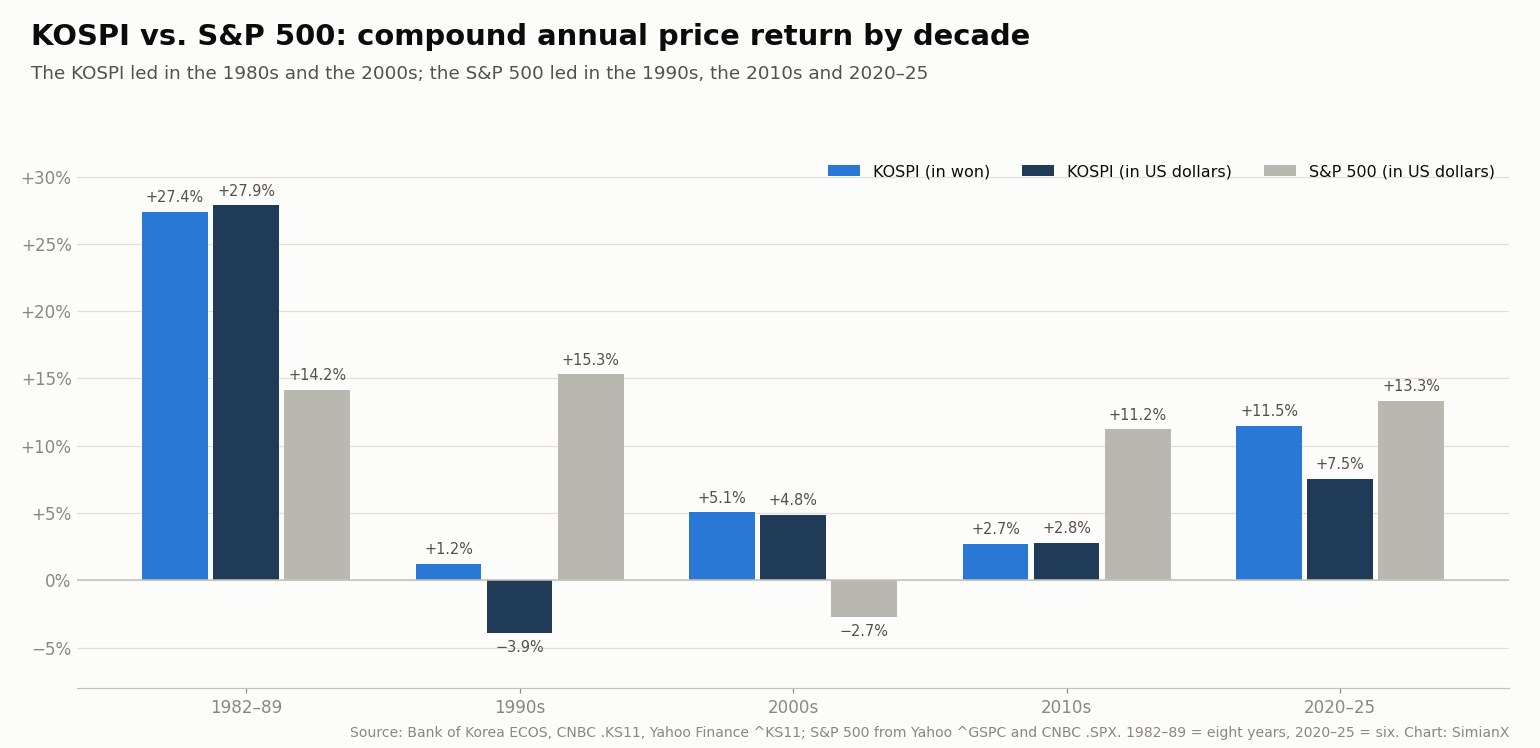
| 1982–1989 | 6 of 8 | +32.1% | +27.4% | +593% | 1987 (+92.6%) | 1983 (−6.0%) | +27.9% | +14.2% |
| 1990s | 5 of 10 | +7.1% | +1.2% | +13.0% | 1999 (+82.8%) | 1997 (−42.2%) | −3.9% | +15.3% |
| 2000s | 7 of 10 | +11.6% | +5.1% | +63.7% | 2005 (+54.0%) | 2000 (−50.9%) | +4.8% | −2.7% |
| 2010s | 7 of 10 | +3.4% | +2.7% | +30.6% | 2010 (+21.9%) | 2018 (−17.3%) | +2.8% | +11.2% |
| 2020–2025 | 4 of 6 | +15.7% | +11.5% | +91.8% | 2025 (+75.6%) | 2022 (−24.9%) | +7.5% | +13.3% |
The 1980s were the KOSPI's boom decade. Korea's economy grew rapidly, the 1988 Seoul Olympics drew foreign attention, and the index rose in every year from 1984 to 1989, a six-year run that is still its longest. In 1986, 1987 and 1988 alone it gained 66.9%, 92.6% and 72.8%. The 1990s were almost flat (+1.2% a year in won, −3.9% in dollars), because the decade included the 1997 Asian financial crisis and the IMF rescue that followed. In the 2010s the index compounded just 2.7% a year: year-end closes from 2011 to 2016 all stayed between 1,825.74 and 2,026.46, the range-bound stretch Korean investors nicknamed the "Boxpi" (박스피, from "box" and KOSPI). 2020–2025 brought the COVID rebound (+30.8% in 2020), the −24.9% year of 2022 and then 2025's jump.
The best and worst years for the KOSPI
| Rank | Best years | Price return | Worst years | Price return |
|---|---|---|---|---|
| 1 | 1987 | +92.6% | 2000 | −50.9% |
| 2 | 1999 | +82.8% | 1997 | −42.2% |
| 3 | 2025 | +75.6% | 2008 | −40.7% |
| 4 | 1988 | +72.8% | 1996 | −26.2% |
| 5 | 1986 | +66.9% | 2022 | −24.9% |
| 6 | 2005 | +54.0% | 1990 | −23.5% |
| 7 | 2009 | +49.7% | 2018 | −17.3% |
| 8 | 1998 | +49.5% | 1995 | −14.1% |
| 9 | 2001 | +37.5% | 1991 | −12.2% |
| 10 | 2007 | +32.3% | 2011 | −11.0% |
The best year for the KOSPI was 1987, when it rose 92.6% to 525.11, part of the late-1980s rally in which the index went from 131.30 at the end of 1981 to 909.72 at the end of 1989. 1999, the rebound after the Asian financial crisis (+82.8%), and 2025 (+75.6%) are second and third. The worst year was 2000, when the dot-com bust and worries about Korea's large conglomerates cut the index by 50.9%; 1997 (−42.2%) and 2008 (−40.7%) follow. Big losses were often followed by big gains: 1998 and 1999 followed 1997, 2001 followed 2000, 2009 (+49.7%) followed 2008, and 2025 followed 2024's −9.6%.
How often does the KOSPI fall in a year?
| Calendar-year price return | Number of years | Share of years | Years |
|---|---|---|---|
| Down 30% or more | 3 | 7% | 1997, 2000, 2008 |
| Down 20% to 30% | 3 | 7% | 1990, 1996, 2022 |
| Down 10% to 20% | 4 | 9% | 1991, 1995, 2011, 2018 |
| Down 0% to 10% | 5 | 11% | 1982, 1983, 2002, 2014, 2024 |
| Up 0% to 10% | 8 | 18% | most recent: 2021 (+3.6%) |
| Up 10% to 20% | 6 | 14% | 1984, 1985, 1992, 1994, 2004, 2023 |
| Up 20% to 30% | 4 | 9% | 1993, 2003, 2010, 2017 |
| Up 30% to 50% | 5 | 11% | 1998, 2001, 2007, 2009, 2020 |
| Up 50% or more | 6 | 14% | 1986, 1987, 1988, 1999, 2005, 2025 |
From 1982 to 2025 the KOSPI finished 15 of 44 calendar years lower, about one year in three — more often than the S&P 500, which fell in 10 of those years. After the 15 down years, the following year was positive 11 times and averaged +14.8%. The longest run of consecutive down years was three, 1995–1997, ending in the Asian financial crisis.
The biggest drops inside a year
A calendar-year return hides how rough the ride was. From 1990 to 2025 the median largest drop within a year was −18.3%. The KOSPI fell at least 10% from a high at some point in 33 of those 36 years and at least 20% in 17, and 7 of those 17 years still ended higher (1992, 1998, 1999, 2001, 2003, 2004 and 2020).
| Year | High before the drop (close) | Low (close) | Largest drop within the year | Calendar-year return |
|---|---|---|---|---|
| 1997 | Jun 17, 1997: 792.29 | Dec 12, 1997: 350.68 | −55.7% | −42.2% |
| 2000 | Jan 4, 2000: 1,059.04 | Dec 22, 2000: 500.60 | −52.7% | −50.9% |
| 1998 | Mar 2, 1998: 574.35 | Jun 16, 1998: 280.00 | −51.2% | +49.5% |
| 2008 | previous year-end: 1,897.13 | Oct 24, 2008: 938.75 | −50.5% | −40.7% |
| 2026 (to Oct 23) | Jun 22, 2026: 9,114.55 | Oct 22, 2026: 5,533.77 | −39.3% | +31.7% |
| 1990 | Jan 4, 1990: 928.82 | Sep 17, 1990: 566.27 | −39.0% | −23.5% |
| 2002 | Apr 18, 2002: 937.61 | Oct 10, 2002: 584.04 | −37.7% | −9.5% |
| 2020 | Jan 22, 2020: 2,267.25 | Mar 19, 2020: 1,457.64 | −35.7% | +30.8% |
The deepest drop within one calendar year came in 1997: from 792.29 on June 17, 1997 to 350.68 on December 12, 1997, a fall of 55.7%. 2026's decline of 39.3%, from the June record to the October low, already ranks fifth. Crashes that span more than one year, such as the 1994–1998 fall of more than 75%, are covered in our list of every KOSPI crash since 1990, with peak and trough dates and recovery times. Korea's own volatility index, the VKOSPI, is the local counterpart of the VIX; how often volatility spikes of that kind have occurred in the US is in our VIX spikes history.
KOSPI market capitalization by year
| Year | Market capitalization (₩ trillion) | Dividend yield | Won per US dollar at year-end | Change in the won vs. the dollar |
|---|---|---|---|---|
| 2025 | 3,478 | 1.30% | 1,434.9 | won +2.4% |
| 2024 | 1,963 | 2.06% | 1,470.0 | won −12.3% |
| 2023 | 2,126 | 1.83% | 1,289.4 | won −1.7% |
| 2022 | 1,767 | 2.22% | 1,267.3 | won −6.5% |
| 2021 | 2,203 | 1.82% | 1,185.5 | won −8.2% |
| 2020 | 1,981 | 1.48% | 1,088.0 | won +6.4% |
| 2019 | 1,476 | 2.02% | 1,157.8 | won −3.4% |
| 2018 | 1,344 | 1.93% | 1,118.1 | won −4.2% |
| 2017 | 1,606 | 1.36% | 1,071.4 | won +12.8% |
| 2016 | 1,308 | 1.52% | 1,208.5 | won −3.0% |
| 2015 | 1,243 | 1.33% | 1,172.0 | won −6.2% |
| 2010 | 1,142 | 1.12% | 1,138.9 | won +2.5% |
| 2007 | 952 | 1.39% | 938.2 | won −0.9% |
| 2005 | 655 | 1.74% | 1,012.7 | won +3.1% |
| 2000 | 188 | n/a | 1,259.7 | won −9.1% |
| 1999 | 350 | n/a | 1,145.4 | won +5.4% |
| 1997 | 71.0 | n/a | 1,415.2 | won −40.3% |
| 1995 | 141 | n/a | 774.7 | won +2.0% |
| 1990 | 79.0 | n/a | 716.4 | won −5.1% |
| 1985 | 6.6 | n/a | 890.2 | won −7.1% |
| 1984 | 5.1 | n/a | 827.4 | won −3.6% |
The total market value of KOSPI-listed shares grew from ₩5.1 trillion at the end of 1984 to ₩3,478 trillion at the end of 2025, about 676 times as much. Market capitalization rises faster than the index because new companies list and existing ones issue shares. In 2025 alone it went from ₩1,963 trillion to ₩3,478 trillion (1.77 times). The KOSPI's dividend yield, as published by the Bank of Korea, was 1.30% at the end of 2025, against 1.73% in 2001, the first year of the series — one reason a price-only table understates the total return.
Why the won matters: KOSPI returns in US dollars
For a foreign investor, or a Korean investor comparing the KOSPI with US stocks, the exchange rate is half the story. At the end of 1981 a dollar bought ₩700.5; at the end of 2025 it bought ₩1,434.9, so the won lost 51.2% of its dollar value over 44 years. That is why the KOSPI's compound return was 1.7 points a year lower in dollars (6.5%) than in won (8.2%).
The effect is largest in crises. In 1997 the won fell from ₩844.2 to ₩1,415.2 per dollar, turning the KOSPI's −42.2% year into −65.5% for dollar-based investors, the worst dollar year in the table. In 2024 a weaker won turned −9.6% into −20.7%. It also works the other way: in 2026 the won has strengthened from ₩1,434.9 to ₩1,324.6 per dollar, so the year-to-date gain is 42.7% in dollars against 31.7% in won. The Bank of Korea's year-end rate and the New York noon rate published by the US Federal Reserve agree within about 1.2% in every year except 1997; in the chaotic final days of that year they differed sharply: on the Fed's December 31 rates (₩1,695.0 and ₩1,206.0) the KOSPI's dollar returns would be −71.1% for 1997 and +110% for 1998. The table uses the Bank of Korea figures. Year-by-year exchange rates are in our US dollar exchange rate by year table.
2026 so far
Through the close on October 23, 2026, the KOSPI stood at 5,550.30, up 31.7% from its 2025 year-end close of 4,214.17. Over the same period the S&P 500 gained 11.9% (through October 22, 2026). If the year ended at that level, only 10 of the 44 full years in the table would have a bigger gain.
The path was extreme. Driven by the AI memory-chip boom in Samsung Electronics and SK Hynix, the index more than doubled from its 2025 close to a record 9,114.55 on June 22, 2026. It then fell 39.3% to 5,533.77 on October 22, 2026, and on October 23, 2026 it was still 39.1% below the record. The KOSPI moved 5% or more in 37 of the year's 197 sessions; the worst was −12.06% on March 4, 2026 and the best +17.91% on July 31, 2026. The crash itself, with the June 23 circuit breaker and the July 28 plunge, is analysed in South Korea's 2026 stock market crash.
2025 was already one of the KOSPI's best years (+75.6%, third-best since 1982), so if 2026 holds its gains it will be the first back-to-back pair of 30%-plus years since 1998–1999. A year that includes a drop of nearly 40% and still ends far ahead would not be new either: 1998 fell 51.2% inside the year and still finished up 49.5%.
How to read KOSPI historical returns
- Average vs. compound growth. The average of the yearly figures (+13.0% since 1982) is much higher than the rate an investor holding the index actually earned (8.2%), because the KOSPI's yearly results vary so much.
- The start date changes the answer. Starting in 1982 includes the 1980s boom; from 1990 the compound rate falls to 4.4% a year, and from 2000 it is 5.6%. An average without its period is incomplete.
- These are price returns. Dividends are excluded. The KOSPI's dividend yield has ranged between about 1.1% and 2.6% since 2001, so total returns are higher than every figure here.
- Inflation is not removed. All returns are nominal; Korean inflation was high in the early 1980s.
- Currency matters. Use the won columns for a Korean investor's experience and the dollar column to compare the KOSPI with US or other markets.
To follow Korean and US markets day to day, SimianX's live multi-agent analysis can run on a ticker or ETF of your choice, and Market Pulse scores market-moving news as it breaks. Every SimianX market-history reference page is listed on the market history topic hub.
How this page is updated
- Every month: the 2026 row (close, return, largest drop, dollar return, S&P 500) and the "2026 so far" section are refreshed from the latest Korea Exchange close, as reported by CNBC and Yahoo Finance, with the Bank of Korea's won–dollar rate for the same day.
- Every January: after the last Korea Exchange session of the year (usually December 30), the 2026 row becomes a full year, every summary table is recalculated, and the Bank of Korea's official year-end close and market capitalization replace the provisional figures once ECOS publishes them.
- The date at the top of the page always shows the last close used.
Frequently asked questions
What is the average annual return of the KOSPI?
From 1982 to 2025 the KOSPI's price return averaged +13.0% a year, with a median of +8.5% and compound growth of 8.2%. In US dollars it compounded 6.5% a year. Over the last ten years (2016–2025) it compounded 7.9% a year.
What was the best year for the KOSPI?
1987, with a gain of 92.6%. The next best were 1999 (+82.8%), 2025 (+75.6%), 1988 (+72.8%) and 1986 (+66.9%).
What was the worst year for the KOSPI?
2000, at −50.9%, followed by 1997 (−42.2%) and 2008 (−40.7%). In US dollars the worst year was 1997 (−65.5%), because the won collapsed during the Asian financial crisis.
How often does the KOSPI go down in a year?
In 15 of 44 calendar years from 1982 to 2025. After a down year, the next year was positive 11 times out of 15.
What is the KOSPI's return in 2026 so far?
+31.7% through October 23, 2026 (5,550.30 vs. 4,214.17 at the end of 2025), or +42.7% in US dollars. The record close is 9,114.55, set on June 22, 2026; since then the index has fallen as much as 39.3%.
Has the KOSPI outperformed the S&P 500?
Not over the long run. From 1982 to 2025 the KOSPI compounded 8.2% a year in won and 6.5% in dollars, against 9.6% for the S&P 500, and it beat the S&P 500 in 21 of 44 years. It led strongly in the 1980s and the 2000s and lagged in the 1990s, the 2010s and 2020–2025.
What was the KOSPI's market capitalization in 2025?
₩3,478 trillion at the end of 2025, a record, up from ₩1,963 trillion a year earlier (Bank of Korea).
What is the KOSPI's base value?
100, on January 4, 1980. The index was first published in 1983, calculated back to that base date.
Methodology and sources
- KOSPI year-end closes are the Bank of Korea's ECOS annual series (stock market statistics 901Y014, KOSPI close, 1980.01.04 = 100), checked against CNBC (.KS11, daily from 1983), Naver Finance (daily from 1990, used only up to September 2026, because its later daily prices include after-hours trading), Yahoo Finance (^KS11, from December 1996) and the annual tables in Wikipedia's KOSPI articles based on Stooq. Every close used agrees in at least two sources; the exceptions are footnoted under the table. The 2026 close is the CNBC and Yahoo Finance close, which agree.
- Largest drop within the year uses CNBC's daily closes from 1990, cross-checked with Naver (1990–2025) and Yahoo Finance (1998 onward); all three give the same figure to within 0.2 points.
- US-dollar returns convert year-end closes at the Bank of Korea's won–dollar base rate (ECOS 731Y001) on the last day of each year, checked against the Federal Reserve's FRED DEXKOUS series.
- S&P 500 returns are price returns from Yahoo Finance (^GSPC), cross-checked with CNBC (.SPX).
- Market capitalization and dividend yield are the Bank of Korea's ECOS annual series (from 1984 and 2001).
- Averages are arithmetic means of yearly returns; compound growth is the geometric mean; the standard deviation is the population standard deviation.
- Data compiled October 23, 2026. This page is for information only and is not investment advice.
Related Reading
- South Korea Stock Market Crash 2026 vs Every KOSPI Crash
- Samsung Electronics Stock Price 2026: History and Earnings
- SK Hynix Stock Surges 8%: Is the AI Supercycle Real?
- S&P 500 Returns by Year: Every Year 1928–2026 Table
- VIX Spikes History: Every Major Volatility Spike Since 1990
- Nasdaq Returns by Year: Every Year 1972–2026 Table
- Dow Jones Returns by Year: Every Year 1915–2026 Table
- Gold Price by Year: Every Year 1971–2026 With Returns Table
- US Dollar Rate History by Year: 14 Currencies Since 1971
- Market history: all SimianX reference pages
References
- Bank of Korea — ECOS Economic Statistics System
- Korea Exchange — KRX Data Marketplace
- Korea Exchange (KRX)
- CNBC — KOSPI Index (.KS11)
- Yahoo Finance — KOSPI Composite Index (^KS11) historical data
- Naver Finance — KOSPI
- FRED — South Korean won to US dollar spot exchange rate (DEXKOUS)
- Yahoo Finance — S&P 500 (^GSPC)
- Wikipedia — KOSPI
- Wikipedia — 1997 Asian financial crisis