
Dow Jones Industrial Average Annual Returns: Every Calendar Year Since 1915 and 2026 So Far
Updated October 2026. Data through the October 15, 2026 close. The 2026 row will be finalized after the December 31, 2026 close.
Short answer: From 1915 to 2025 the Dow Jones Industrial Average's price return averaged +8.3% a year (median +10.9%, compounded 6.3%). It rose in 76 of 111 years. Best year: 1915, +81.7%. Worst: 1931, −52.7%. 2026 through October 15: +8.6%, at 52,177.69.
This page lists Dow Jones returns by year for every calendar year from 1915 to 2025, plus 2026 to date, with each year-end close checked against at least two independent sources. Next to each Dow figure it shows the S&P 500 return for the same year (from 1928) and the Nasdaq Composite return (from 1972). It also covers the averages by decade, the best and worst years, how often the Dow has fallen in a calendar year, the 25 years it took to regain the 1929 peak, every decline of 20% or more, and the dates of the Dow's first close above each point milestone from 500 to 50,000.
Dow Jones historical returns at a glance
| Measure (calendar-year price return) | 1915–2025 | 1929–2025 | 1950–2025 | 1976–2025 | 1996–2025 | 2016–2025 |
|---|---|---|---|---|---|---|
| Years | 111 | 97 | 76 | 50 | 30 | 10 |
| Up years | 76 (68%) | 66 (68%) | 55 (72%) | 37 (74%) | 22 (73%) | 8 (80%) |
| Average (arithmetic) | +8.3% | +7.1% | +8.6% | +9.3% | +8.8% | +11.2% |
| Median | +10.9% | +8.4% | +11.4% | +12.4% | +12.0% | +13.2% |
| Compound annual growth | +6.3% | +5.4% | +7.5% | +8.4% | +7.8% | +10.7% |
| Standard deviation | 20.2 pts | 18.5 pts | 15.2 pts | 13.8 pts | 14.0 pts | 10.4 pts |
From the 1914 year-end close of 54.58 to the 2025 year-end close of 48,063.29, the Dow rose about 881-fold, or 6.3% a year before dividends. The median year (+10.9%) has been better than the average, because a few deep losses — 1931, 2008, 1930 — pull the average down. The window that starts in 1929 is the weakest of the six, because it opens with the 1929–1932 crash; since 1950, about seven years in ten have been positive.
Dow Jones returns by year: the complete table, 1915–2026
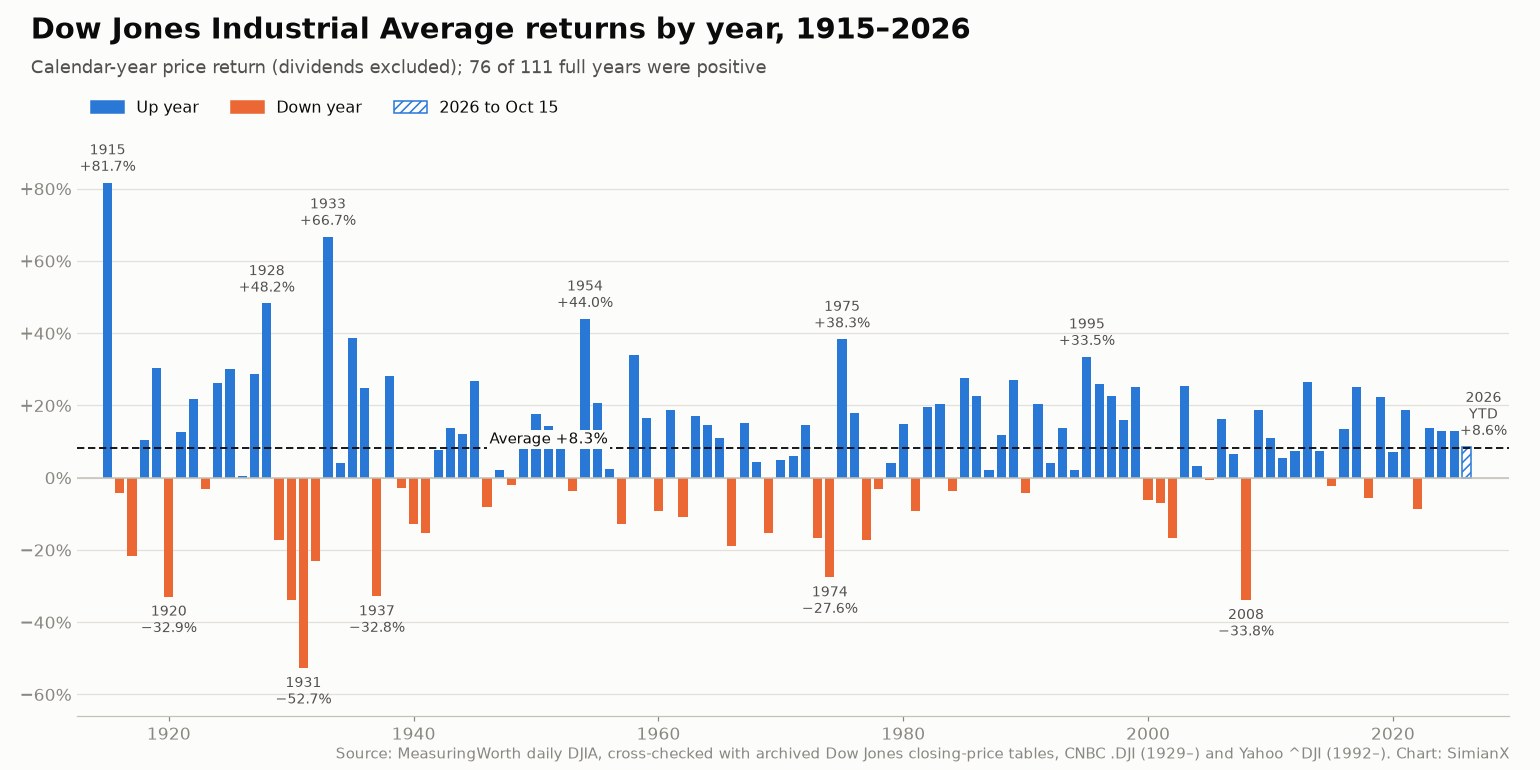
Newest first. Down years for the Dow are in bold. All figures are price returns (dividends excluded). The S&P 500 column uses the same figures as our S&P 500 returns by year table, and the Nasdaq column the figures from our Nasdaq returns by year table.
| Year | Year-end close | Point change | Dow Jones | S&P 500 | Nasdaq |
|---|---|---|---|---|---|
| 2026 (to Oct 15) | 52,177.69 | +4,114.40 | +8.6% | +13.1% | +14.9% |
| 2025 | 48,063.29 | +5,519.07 | +13.0% | +16.4% | +20.4% |
| 2024 | 42,544.22 | +4,854.68 | +12.9% | +23.3% | +28.6% |
| 2023 | 37,689.54 | +4,542.29 | +13.7% | +24.2% | +43.4% |
| 2022 | 33,147.25 | −3,191.05 | −8.8% | −19.4% | −33.1% |
| 2021 | 36,338.30 | +5,731.82 | +18.7% | +26.9% | +21.4% |
| 2020 | 30,606.48 | +2,068.04 | +7.2% | +16.3% | +43.6% |
| 2019 | 28,538.44 | +5,210.98 | +22.3% | +28.9% | +35.2% |
| 2018 | 23,327.46 | −1,391.76 | −5.6% | −6.2% | −3.9% |
| 2017 | 24,719.22 | +4,956.62 | +25.1% | +19.4% | +28.2% |
| 2016 | 19,762.60 | +2,337.57 | +13.4% | +9.5% | +7.5% |
| 2015 | 17,425.03 | −398.04 | −2.2% | −0.7% | +5.7% |
| 2014 | 17,823.07 | +1,246.41 | +7.5% | +11.4% | +13.4% |
| 2013 | 16,576.66 | +3,472.52 | +26.5% | +29.6% | +38.3% |
| 2012 | 13,104.14 | +886.58 | +7.3% | +13.4% | +15.9% |
| 2011 | 12,217.56 | +640.05 | +5.5% | −0.003% | −1.8% |
| 2010 | 11,577.51 | +1,149.46 | +11.0% | +12.8% | +16.9% |
| 2009 | 10,428.05 | +1,651.66 | +18.8% | +23.5% | +43.9% |
| 2008 | 8,776.39 | −4,488.43 | −33.8% | −38.5% | −40.5% |
| 2007 | 13,264.82 | +801.67 | +6.4% | +3.5% | +9.8% |
| 2006 | 12,463.15 | +1,745.65 | +16.3% | +13.6% | +9.5% |
| 2005 | 10,717.50 | −65.51 | −0.6% | +3.0% | +1.4% |
| 2004 | 10,783.01 | +329.09 | +3.1% | +9.0% | +8.6% |
| 2003 | 10,453.92 | +2,112.29 | +25.3% | +26.4% | +50.0% |
| 2002 | 8,341.63 | −1,679.87 | −16.8% | −23.4% | −31.5% |
| 2001 | 10,021.50 | −765.35 | −7.1% | −13.0% | −21.1% |
| 2000 | 10,786.85 | −710.27 | −6.2% | −10.1% | −39.3% |
| 1999 | 11,497.12 | +2,315.69 | +25.2% | +19.5% | +85.6% |
| 1998 | 9,181.43 | +1,273.18 | +16.1% | +26.7% | +39.6% |
| 1997 | 7,908.25 | +1,459.98 | +22.6% | +31.0% | +21.6% |
| 1996 | 6,448.27 | +1,331.15 | +26.0% | +20.3% | +22.7% |
| 1995 | 5,117.12 | +1,282.68 | +33.5% | +34.1% | +39.9% |
| 1994 | 3,834.44 | +80.35 | +2.1% | −1.5% | −3.2% |
| 1993 | 3,754.09 | +452.98 | +13.7% | +7.1% | +14.7% |
| 1992 | 3,301.11 | +132.28 | +4.2% | +4.5% | +15.5% |
| 1991 | 3,168.83 | +535.17 | +20.3% | +26.3% | +56.8% |
| 1990 | 2,633.66 | −119.54 | −4.3% | −6.6% | −17.8% |
| 1989 | 2,753.20 | +584.63 | +27.0% | +27.3% | +19.3% |
| 1988 | 2,168.57 | +229.74 | +11.8% | +12.4% | +15.4% |
| 1987 | 1,938.83 | +42.88 | +2.3% | +2.0% | −5.3% |
| 1986 | 1,895.95 | +349.28 | +22.6% | +14.6% | +7.4% |
| 1985 | 1,546.67 | +335.10 | +27.7% | +26.3% | +31.4% |
| 1984 | 1,211.57 | −47.07 | −3.7% | +1.4% | −11.2% |
| 1983 | 1,258.64 | +212.10 | +20.3% | +17.3% | +19.9% |
| 1982 | 1,046.54 | +171.54 | +19.6% | +14.8% | +18.7% |
| 1981 | 875.00 | −88.99 | −9.2% | −9.7% | −3.2% |
| 1980 | 963.99 | +125.25 | +14.9% | +25.8% | +33.9% |
| 1979 | 838.74 | +33.73 | +4.2% | +12.3% | +28.1% |
| 1978 | 805.01 | −26.16 | −3.1% | +1.1% | +12.3% |
| 1977 | 831.17 | −173.48 | −17.3% | −11.5% | +7.3% |
| 1976 | 1,004.65 | +152.24 | +17.9% | +19.1% | +26.1% |
| 1975 | 852.41 | +236.17 | +38.3% | +31.5% | +29.8% |
| 1974 | 616.24 | −234.62 | −27.6% | −29.7% | −35.1% |
| 1973 | 850.86 | −169.16 | −16.6% | −17.4% | −31.1% |
| 1972 | 1,020.02 | +129.82 | +14.6% | +15.6% | +17.2% |
| 1971 | 890.20 | +51.28 | +6.1% | +10.8% | n/a |
| 1970 | 838.92 | +38.56 | +4.8% | +0.1% | n/a |
| 1969 | 800.36 | −143.39 | −15.2% | −11.4% | n/a |
| 1968 | 943.75 | +38.64 | +4.3% | +7.7% | n/a |
| 1967 | 905.11 | +119.42 | +15.2% | +20.1% | n/a |
| 1966 | 785.69 | −183.57 | −18.9% | −13.1% | n/a |
| 1965 | 969.26 | +95.13 | +10.9% | +9.1% | n/a |
| 1964 | 874.13 | +111.18 | +14.6% | +13.0% | n/a |
| 1963 | 762.95 | +110.85 | +17.0% | +18.9% | n/a |
| 1962 | 652.10 | −79.04 | −10.8% | −11.8% | n/a |
| 1961 | 731.14 | +115.25 | +18.7% | +23.1% | n/a |
| 1960 | 615.89 | −63.47 | −9.3% | −3.0% | n/a |
| 1959 | 679.36 | +95.71 | +16.4% | +8.5% | n/a |
| 1958 | 583.65 | +147.96 | +34.0% | +38.1% | n/a |
| 1957 | 435.69 | −63.78 | −12.8% | −14.3% | n/a |
| 1956 | 499.47 | +11.07 | +2.3% | +2.6% | n/a |
| 1955 | 488.40 | +84.01 | +20.8% | +26.4% | n/a |
| 1954 | 404.39 | +123.49 | +44.0% | +45.0% | n/a |
| 1953 | 280.90 | −11.00 | −3.8% | −6.6% | n/a |
| 1952 | 291.90 | +22.67 | +8.4% | +11.8% | n/a |
| 1951 | 269.23 | +33.82 | +14.4% | +16.3% | n/a |
| 1950 | 235.41 | +35.28 | +17.6% | +21.7% | n/a |
| 1949 | 200.13 | +22.83 | +12.9% | +10.5% | n/a |
| 1948 | 177.30 | −3.86 | −2.1% | −0.7% | n/a |
| 1947 | 181.16 | +3.96 | +2.2% | 0.0% | n/a |
| 1946 | 177.20 | −15.71 | −8.1% | −11.9% | n/a |
| 1945 | 192.91 | +40.59 | +26.6% | +30.7% | n/a |
| 1944 | 152.32 | +16.43 | +12.1% | +13.8% | n/a |
| 1943 | 135.89 | +16.49 | +13.8% | +19.4% | n/a |
| 1942 | 119.40 | +8.44 | +7.6% | +12.4% | n/a |
| 1941 | 110.96 | −20.17 | −15.4% | −17.9% | n/a |
| 1940 | 131.13 | −19.11 | −12.7% | −15.1% | n/a |
| 1939 | 150.24 | −4.52 | −2.9% | −5.2% | n/a |
| 1938 | 154.76 | +33.91 | +28.1% | +24.5% | n/a |
| 1937 | 120.85 | −59.05 | −32.8% | −38.6% | n/a |
| 1936 | 179.90 | +35.77 | +24.8% | +27.9% | n/a |
| 1935 | 144.13 | +40.09 | +38.5% | +41.4% | n/a |
| 1934 | 104.04 | +4.14 | +4.1% | −4.7% | n/a |
| 1933 | 99.90 | +39.97 | +66.7% | +44.1% | n/a |
| 1932 | 59.93 | −17.97 | −23.1% | −14.8% | n/a |
| 1931 | 77.90 | −86.68 | −52.7% | −47.1% | n/a |
| 1930 | 164.58 | −83.90 | −33.8% | −28.5% | n/a |
| 1929 | 248.48 | −51.52 | −17.2% | −11.9% | n/a |
| 1928 | 300.00 | +97.60 | +48.2% | +37.9% | n/a |
| 1927 | 202.40 | +45.20 | +28.8% | n/a | n/a |
| 1926 | 157.20 | +0.54 | +0.3% | n/a | n/a |
| 1925 | 156.66 | +36.15 | +30.0% | n/a | n/a |
| 1924 | 120.51 | +24.99 | +26.2% | n/a | n/a |
| 1923 | 95.52 | −3.21 | −3.3% | n/a | n/a |
| 1922 | 98.73 | +17.63 | +21.7% | n/a | n/a |
| 1921 | 81.10 | +9.15 | +12.7% | n/a | n/a |
| 1920 | 71.95 | −35.28 | −32.9% | n/a | n/a |
| 1919 | 107.23 | +25.03 | +30.5% | n/a | n/a |
| 1918 | 82.20 | +7.82 | +10.5% | n/a | n/a |
| 1917 | 74.38 | −20.62 | −21.7% | n/a | n/a |
| 1916 | 95.00 | −4.15 | −4.2% | n/a | n/a |
| 1915 | 99.15 | +44.57 | +81.7% | n/a | n/a |
Notes: The table starts in 1915 because the New York Stock Exchange was closed from July 31 to December 11, 1914, and the Dow's history from the December 1914 reopening was later recalculated on the 20-stock list adopted in October 1916; values before and after that break are not on the same basis, so a 1914 return is not shown. All sources used here agree on the 1914 year-end close of 54.58. The 1979 year-end close is 838.74 in CNBC, the archived Dow Jones closing-price tables and Wikipedia's annual table, and 838.71 in MeasuringWorth; 838.74 is used. For 2000 and 2001, MeasuringWorth and CNBC show 10,786.85 and 10,021.50, while Yahoo Finance and the archived tables show 10,787.99 and 10,021.57; the effect on either year's return is less than 0.02 percentage point. The S&P 500's 2011 return was −0.003% (1,257.64 to 1,257.60), and it was unchanged in 1947.
Dow vs. S&P 500 vs. Nasdaq: the same-year comparison
| 1972–2025 (54 years) | Dow Jones | S&P 500 | Nasdaq Composite |
|---|---|---|---|
| Up years | 39 | 40 | 40 |
| Average annual return | +8.8% | +9.5% | +13.5% |
| Median annual return | +12.4% | +13.1% | +15.7% |
| Compound annual growth | +7.7% | +8.1% | +10.3% |
| Standard deviation | 15.2 pts | 16.7 pts | 25.3 pts |
| Best year | +38.3% (1975) | +34.1% (1995) | +85.6% (1999) |
| Worst year | −33.8% (2008) | −38.5% (2008) | −40.5% (2008) |
| Years up 30% or more | 2 | 3 | 12 |
| Years down 20% or more | 2 | 3 | 7 |
| Largest decline from a record close | −53.8% (2007–2009) | −56.8% (2007–2009) | −77.9% (2000–2002) |
| $100 at the end of 1971 grew to | $5,399 | $6,705 | $20,366 |
Over the 54 years in which all three indexes existed, the Dow had the smallest swings and the lowest return: its standard deviation was 15.2 points against 16.7 for the S&P 500 and 25.3 for the Nasdaq, and it compounded at 7.7% a year against 8.1% and 10.3%. It finished first of the three in 18 years and last in 26. All three rose in 36 years and all three fell in 10: 1973, 1974, 1981, 1990, 2000, 2001, 2002, 2008, 2018 and 2022. The Dow rose while the other two fell in 1994 and 2011, and fell while they rose in 1978 and 2005.
The Dow's smaller declines show up in the bad years: −8.8% in 2022 against −19.4% for the S&P 500 and −33.1% for the Nasdaq; −16.8% in 2002 against −23.4% and −31.5%; −6.2% in 2000 against −10.1% and −39.3%. The other side shows up in strong years for large technology stocks: in 2023 the Dow gained 13.7%, against 24.2% for the S&P 500 and 43.4% for the Nasdaq, and in 2024 12.9% against 23.3% and 28.6%. The Dow finished ahead of the S&P 500 in 4 of the last 10 years (2016, 2017, 2018 and 2022).
Over the longer span from 1929 to 2025, the Dow and the S&P 500 moved in the same direction in 90 of 97 years, and the correlation of their yearly returns was 0.96. The Dow compounded at 5.4% a year against 6.0% for the S&P 500 and finished ahead in 42 of the 97 years. Its largest leads came in 1933 (22.6 points ahead) and 2022 (10.7); its largest deficits in 1980 (10.8 points behind), 1998 (10.6), 2023 (10.5) and 2024 (10.4).
The difference comes from construction. The Dow holds 30 large U.S. companies and is a price-weighted index: each stock counts in proportion to its share price, not its market value. The S&P 500 holds about 500 companies weighted by market value, and the Nasdaq Composite holds every common stock listed on Nasdaq, weighted by market value and concentrated in technology. How much of the S&P 500 the largest technology companies represent is covered in our Magnificent 7 concentration study.
Dow Jones annual returns by decade
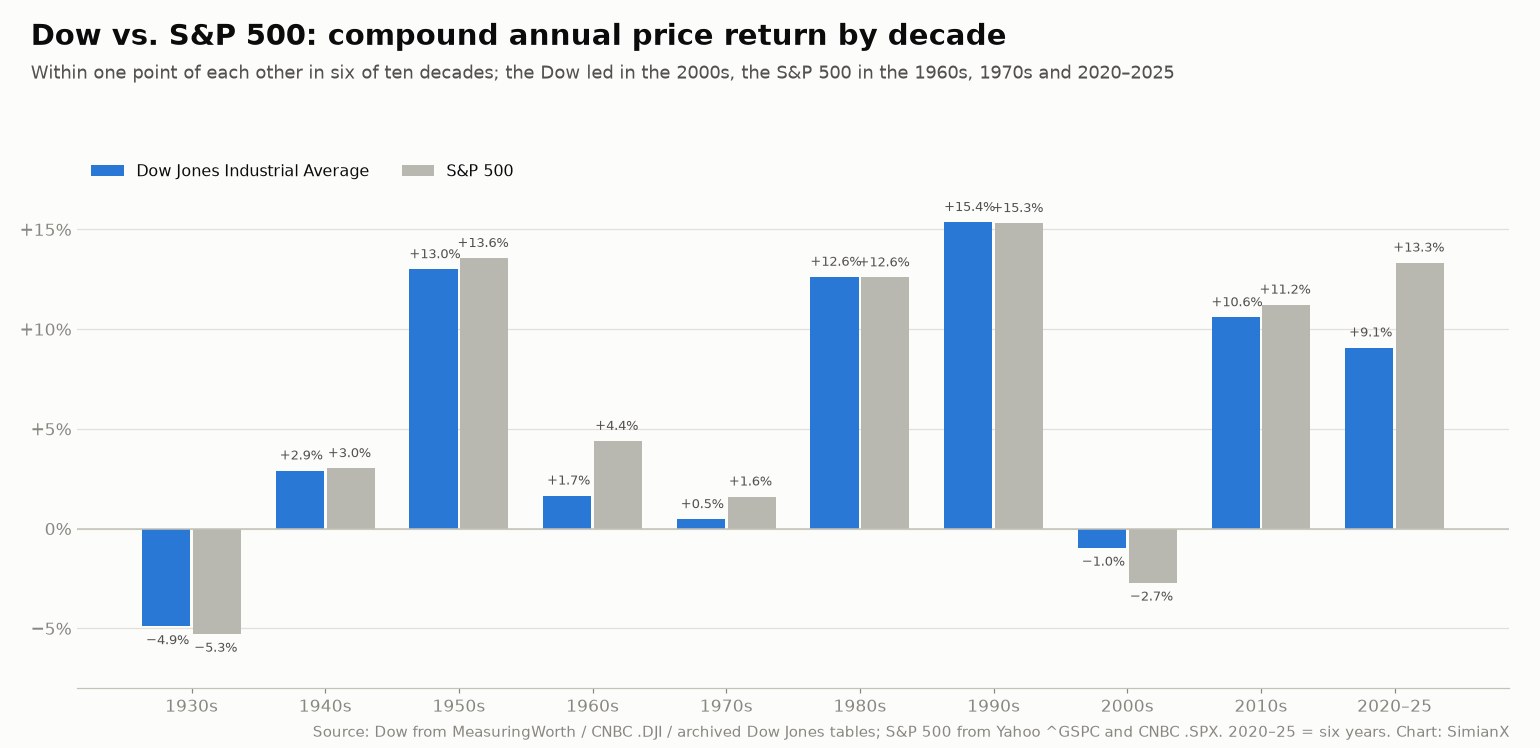
| Decade | Up years | Average | Compound annual | Cumulative | Best year | Worst year | S&P 500 compound |
|---|---|---|---|---|---|---|---|
| 1915–1919 | 3 of 5 | +19.3% | +14.5% | +96.5% | 1915 (+81.7%) | 1917 (−21.7%) | n/a |
| 1920s | 7 of 10 | +11.5% | +8.8% | +131.7% | 1928 (+48.2%) | 1920 (−32.9%) | n/a |
| 1930s | 5 of 10 | +1.7% | −4.9% | −39.5% | 1933 (+66.7%) | 1931 (−52.7%) | −5.3% |
| 1940s | 6 of 10 | +3.7% | +2.9% | +33.2% | 1945 (+26.6%) | 1941 (−15.4%) | +3.0% |
| 1950s | 8 of 10 | +14.1% | +13.0% | +239.5% | 1954 (+44.0%) | 1957 (−12.8%) | +13.6% |
| 1960s | 6 of 10 | +2.6% | +1.7% | +17.8% | 1961 (+18.7%) | 1966 (−18.9%) | +4.4% |
| 1970s | 6 of 10 | +2.1% | +0.5% | +4.8% | 1975 (+38.3%) | 1974 (−27.6%) | +1.6% |
| 1980s | 8 of 10 | +13.3% | +12.6% | +228.3% | 1985 (+27.7%) | 1981 (−9.2%) | +12.6% |
| 1990s | 9 of 10 | +15.9% | +15.4% | +317.6% | 1995 (+33.5%) | 1990 (−4.3%) | +15.3% |
| 2000s | 5 of 10 | +0.6% | −1.0% | −9.3% | 2003 (+25.3%) | 2008 (−33.8%) | −2.7% |
| 2010s | 8 of 10 | +11.1% | +10.6% | +173.7% | 2013 (+26.5%) | 2018 (−5.6%) | +11.2% |
| 2020–2025 | 5 of 6 | +9.5% | +9.1% | +68.4% | 2021 (+18.7%) | 2022 (−8.8%) | +13.3% |
The 1990s were the Dow's strongest decade: the index rose from 2,753.20 to 11,497.12 (+317.6%) and fell in only one year, 1990. The 1930s and the 2000s were the two decades that ended lower, and the 1960s and 1970s together added only 23.5%: the Dow first closed above 1,000 in November 1972 and ended 1979 at 838.74, below where it had been in 1965. In six of the ten full decades since 1930 the Dow and the S&P 500 compounded within one point of each other. The Dow led by 1.7 points a year in the 2000s; the S&P 500 led in the 1960s, the 1970s and 2020–2025. Peak and trough dates for the broader market in each decade are in our list of every S&P 500 bear market since 1929.
The best and worst years for the Dow
| Rank | Best years | Price return | Worst years | Price return |
|---|---|---|---|---|
| 1 | 1915 | +81.7% | 1931 | −52.7% |
| 2 | 1933 | +66.7% | 2008 | −33.8% |
| 3 | 1928 | +48.2% | 1930 | −33.8% |
| 4 | 1954 | +44.0% | 1920 | −32.9% |
| 5 | 1935 | +38.5% | 1937 | −32.8% |
| 6 | 1975 | +38.3% | 1974 | −27.6% |
| 7 | 1958 | +34.0% | 1932 | −23.1% |
| 8 | 1995 | +33.5% | 1917 | −21.7% |
| 9 | 1919 | +30.5% | 1966 | −18.9% |
| 10 | 1925 | +30.0% | 1977 | −17.3% |
The best year for the Dow was 1915, when the index rose 81.7% from 54.58 to 99.15 in the first full year of World War I, after the exchange had reopened in December 1914. The best year since 1950 was 1954 (+44.0%), when the Dow passed its 1929 peak for the first time. The worst year was 1931 (−52.7%), the third of four consecutive down years during the Great Depression; the worst since World War II was 2008 (−33.8%), during the global financial crisis, by a margin of 0.07 point over 1930. Large gains have tended to follow large losses: 1933 followed 1929–1932, 1975 followed 1973–74, and 2009 (+18.8%) followed 2008. The single worst days inside those years — including October 19, 1987, when the Dow fell 22.6% in one session but the year still ended up 2.3% — are covered in the 20 worst days in S&P 500 history.
How often does the Dow fall in a year?
From 1915 to 2025 the Dow finished 35 of 111 calendar years lower (32%) and rose in the other 76. Since 1950 it has fallen in 21 of 76 years (28%). Most losses were moderate:
| Calendar-year price return | Number of years | Share of years | Years or most recent |
|---|---|---|---|
| Down 30% or more | 5 | 5% | 1920, 1930, 1931, 1937, 2008 |
| Down 20% to 30% | 3 | 3% | 1917, 1932, 1974 |
| Down 10% to 20% | 10 | 9% | most recent: 2002 (−16.8%) |
| Down 0% to 10% | 17 | 15% | most recent: 2022 (−8.8%) |
| Up 0% to 10% | 19 | 17% | most recent: 2020 (+7.2%) |
| Up 10% to 20% | 28 | 25% | most recent: 2025 (+13.0%) |
| Up 20% to 30% | 20 | 18% | most recent: 2019 (+22.3%) |
| Up 30% to 50% | 7 | 6% | most recent: 1995 (+33.5%) |
| Up 50% or more | 2 | 2% | 1915, 1933 |
The most common outcome was a gain of 10% to 20% (28 years). Only 8 of 111 years lost more than 20%, and five of those eight came between 1917 and 1937. Consecutive down years are rare: the longest run was four years, 1929–1932, followed by three-year runs in 1939–1941 and 2000–2002. The longest run of up years lasted nine years, 1991–1999. After the 35 down years, the following year was positive 25 times and averaged +8.8%.
The 1929 crash and the 25-year recovery to 1954
The Dow's defining episode began after the 1920s bull market, in which the index more than doubled over the decade (+131.7%) and gained 48.2% in 1928 alone. It closed at a record 381.17 on September 3, 1929. The crash of October 1929 took it from 298.97 at the close on Saturday, October 26 to 230.07 on Tuesday, October 29 — a fall of 23.0% in two sessions — and the decline continued for almost three more years, to 41.22 on July 8, 1932 — a fall of 89.2% from the peak. The calendar years 1929 (−17.2%), 1930 (−33.8%), 1931 (−52.7%) and 1932 (−23.1%) together took the year-end close from 300.00 to 59.93, a loss of 80.0%.
The recovery was uneven. From the 1932 low the Dow rose 372% to 194.40 by March 10, 1937, then fell 49.1% to 98.95 by March 31, 1938, and lost another 40.4% between September 1939 and April 1942, a decline that included the market's reaction to Pearl Harbor (see our Pearl Harbor market study). The Dow did not close above 381.17 again until November 23, 1954 (382.74), 25 years and 2½ months after the 1929 peak. Measured in calendar-year returns, 1954 was the fourth-best year in the index's history. Recovery times after later declines are compared in our bear market recovery table.
Every Dow decline of 20% or more since 1915
| Peak (close) | Trough (close) | Decline | Back above the peak |
|---|---|---|---|
| Nov 21, 1916 (110.15) | Dec 19, 1917 (65.95) | −40.1% | Jul 9, 1919 |
| Nov 3, 1919 (119.62) | Aug 24, 1921 (63.90) | −46.6% | Dec 31, 1924 |
| Sep 3, 1929 (381.17) | Jul 8, 1932 (41.22) | −89.2% | Nov 23, 1954¹ |
| Dec 13, 1961 (734.91) | Jun 26, 1962 (535.76) | −27.1% | Sep 5, 1963 |
| Feb 9, 1966 (995.15) | May 26, 1970 (631.16) | −36.6% | Nov 10, 1972 |
| Jan 11, 1973 (1,051.70) | Dec 6, 1974 (577.60) | −45.1% | Nov 3, 1982 |
| Aug 25, 1987 (2,722.42) | Oct 19, 1987 (1,738.74) | −36.1% | Aug 24, 1989 |
| Jul 16, 1990 (2,999.75) | Oct 11, 1990 (2,365.10) | −21.2% | Apr 17, 1991 |
| Jan 14, 2000 (11,722.98) | Oct 9, 2002 (7,286.27) | −37.8% | Oct 3, 2006 |
| Oct 9, 2007 (14,164.53) | Mar 9, 2009 (6,547.05) | −53.8% | Mar 5, 2013 |
| Feb 12, 2020 (29,551.42) | Mar 23, 2020 (18,591.93) | −37.1% | Nov 16, 2020 |
| Jan 4, 2022 (36,799.65) | Sep 30, 2022 (28,725.51) | −21.9% | Dec 13, 2023 |
¹ Declines are measured from a record close to the lowest close before the index regains that record. Between 1929 and 1954 the Dow also fell 49.1% in 1937–38 and 40.4% in 1939–42, but those declines started below the 1929 record and are part of the same episode.
Twelve declines of 20% or more in 111 years works out to roughly one every nine years. The decline from the January 2000 peak to October 2002 was 37.8% for the Dow, against 77.9% for the Nasdaq Composite over a similar period. The 2025 decline stopped short of 20% on a closing basis: the Dow fell 16.4%, from 45,014.04 on December 4, 2024 to 37,645.59 on April 8, 2025, and closed above the earlier peak again on August 22, 2025.
Dow milestones: first close above 1,000 to 50,000
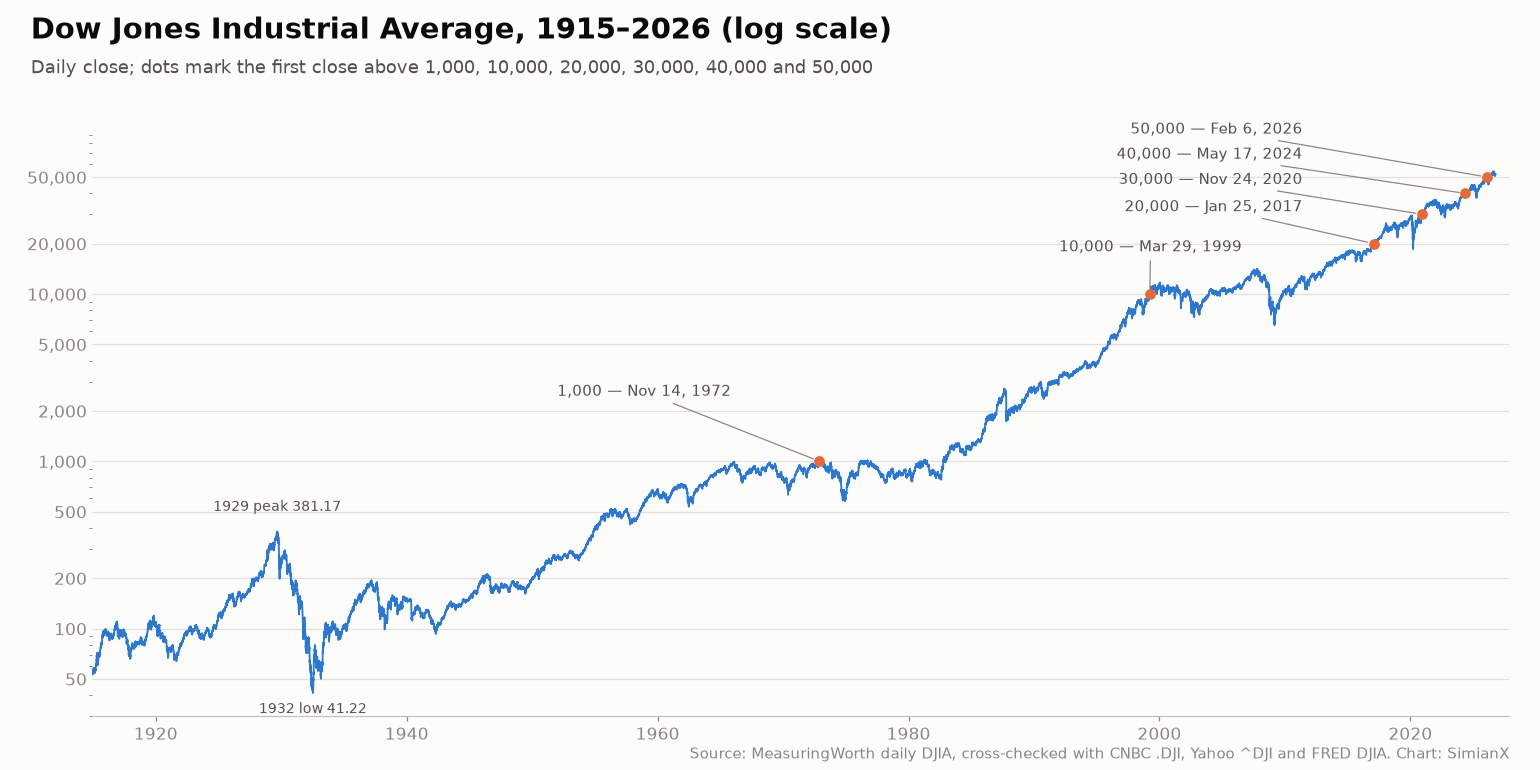
| Level | First close above | Closing value | Years after the previous level in this table |
|---|---|---|---|
| 500 | March 12, 1956 | 500.24 | — |
| 1,000 | November 14, 1972 | 1,003.16 | 16.7 |
| 2,000 | January 8, 1987 | 2,002.25 | 14.2 |
| 3,000 | April 17, 1991 | 3,004.46 | 4.3 |
| 5,000 | November 21, 1995 | 5,023.55 | 4.6 |
| 10,000 | March 29, 1999 | 10,006.78 | 3.4 |
| 15,000 | May 7, 2013 | 15,056.20 | 14.1 |
| 20,000 | January 25, 2017 | 20,068.51 | 3.7 |
| 25,000 | January 4, 2018 | 25,075.13 | 0.9 |
| 30,000 | November 24, 2020 | 30,046.24 | 2.9 |
| 35,000 | July 23, 2021 | 35,061.55 | 0.7 |
| 40,000 | May 17, 2024 | 40,003.59 | 2.8 |
| 45,000 | December 4, 2024 | 45,014.04 | 0.6 |
| 50,000 | February 6, 2026 | 50,115.67 | 1.2 |
The time between round-number milestones shrinks as the index rises, because each 5,000-point step is a smaller percentage move: going from 10,000 to 15,000 required a 50% gain and took 14 years, while going from 45,000 to 50,000 required 11% and took 14 months. Eight of the fourteen milestones in the table were first reached after 2012. The full list, including every 100-point level, is maintained on Wikipedia's list of Dow closing milestones; every date in the table above matches it and our own daily data.
Points vs. percent: why big point moves are smaller than they look
Because the Dow is quoted in points, the largest point moves are recent even when the percentage moves are not. The largest annual point gains were 2021 (+5,731.82 points, +18.7%), 2025 (+5,519.07, +13.0%) and 2019 (+5,210.98, +22.3%). The largest point losses were 2008 (−4,488.43 points, −33.8%) and 2022 (−3,191.05, −8.8%). By contrast, 1931, the worst year in percentage terms, cost 170.58 points. Through October 15, 2026 the Dow had gained 4,114.40 points in the year, a rise of 8.6%. Comparing years requires the percentage figures in the main table.
2026 so far
Through the close on October 15, 2026, the Dow stood at 52,177.69, up 8.6% (4,114.40 points) from its 2025 year-end close of 48,063.29. It closed above 50,000 for the first time on February 6, 2026 and set its record close of 54,349.12 on August 5, 2026, one of 23 record closes in the year so far; on October 15 it was 4.0% below that record. The largest decline within the year was 10.0%, from 50,188.14 on February 10 to 45,166.64 on March 27. Over the same period the S&P 500 gained 13.1% and the Nasdaq Composite 14.9%.
If the year ends positive, 2026 will be the Dow's fourth consecutive up year, after 2023 (+13.7%), 2024 (+12.9%) and 2025 (+13.0%). 2026 is also a midterm election year; our midterm election years study compares it with every midterm since 1950, the S&P 500 seasonality study shows how the remaining months have behaved, and the year-end window is covered in our Santa Claus rally history.
How to read Dow Jones historical returns
- Arithmetic average vs. compound growth. The average of the yearly figures (+8.3% since 1915) is higher than the rate a holder of the index earned (+6.3%). Losses cost more than equal gains recover — the Dow's 89.2% fall from 1929 to 1932 needed a gain of more than 800% to break even.
- The start date changes the answer. Starting in 1929 lowers the average to +7.1%; starting in 1950 gives +8.6%; the last ten years averaged +11.2%. An average quoted without its period is incomplete.
- These are price returns. The Dow figures exclude dividends; including them would raise every year's figure. No dividend-inclusive Dow series covering this period is published by two independent data vendors, so none is mixed in here.
- Inflation is not removed. All returns are nominal.
- The index is 30 stocks, price-weighted, and its membership changes. A stock with a high share price moves the Dow more than a larger company with a lower share price, and the list of 30 companies has been revised many times since 1928, when it was expanded from 20 to 30 stocks. Long-run figures describe the index, not a fixed group of companies.
To follow the index day to day, SimianX's live multi-agent analysis can run on DIA, the Dow ETF, and Market Pulse scores market-moving news as it breaks. Every SimianX market-history reference page is listed on the market history topic hub, and exchange closing dates are in our stock market holidays 2027 list.
Frequently asked questions
What is the average annual return of the Dow Jones?
From 1915 to 2025 the Dow's price return averaged +8.3% a year, with a median of +10.9% and compound growth of 6.3%. Since 1950 the average is +8.6% and compound growth 7.5%. Over the last ten years (2016–2025) the average was +11.2%. These figures exclude dividends.
What was the best year for the Dow Jones?
1915, with a gain of 81.7%. The next best were 1933 (+66.7%), 1928 (+48.2%), 1954 (+44.0%) and 1935 (+38.5%). Since 1980, the best year was 1995 (+33.5%).
What was the worst year for the Dow Jones?
1931, at −52.7%. The next worst were 2008 (−33.8%), 1930 (−33.8%), 1920 (−32.9%) and 1937 (−32.8%). The largest peak-to-trough decline was 89.2%, from September 3, 1929 to July 8, 1932.
How often is the Dow down in a year?
In 35 of 111 calendar years from 1915 to 2025 (32%), and in 21 of 76 years since 1950 (28%). Losses of 20% or more happened in eight years, five of them between 1917 and 1937; since 1950 only 1974 and 2008 lost that much.
What is the Dow's return in 2026 so far?
+8.6% through October 15, 2026 (52,177.69 vs. 48,063.29 at the end of 2025), a gain of 4,114.40 points. The record close was 54,349.12 on August 5, 2026, and the Dow first closed above 50,000 on February 6, 2026.
When did the Dow first close above 10,000, 20,000, 30,000, 40,000 and 50,000?
10,000 on March 29, 1999; 20,000 on January 25, 2017; 30,000 on November 24, 2020; 40,000 on May 17, 2024; and 50,000 on February 6, 2026. Its first close above 1,000 was on November 14, 1972.
Has the Dow done better or worse than the S&P 500?
Slightly worse over long periods. From 1929 to 2025 the Dow compounded at 5.4% a year against 6.0% for the S&P 500, and from 1972 to 2025 at 7.7% against 8.1%. It fell less in most bad years: −8.8% in 2022 against −19.4%.
How long did it take the Dow to recover from the 1929 crash?
About 25 years. The Dow closed at a record 381.17 on September 3, 1929, fell to 41.22 on July 8, 1932, and did not close above the 1929 peak again until November 23, 1954, at 382.74.
Methodology and sources
- Dow returns are calendar-year changes in the Dow Jones Industrial Average (^DJI), year-end close to year-end close, with year-end defined as the last trading session of the year (until 1952 that was sometimes a Saturday). Daily closes come from MeasuringWorth's daily DJIA series and were cross-checked against the archived Dow Jones closing-price tables for 1896–2008 (automationinformation.com, via the Internet Archive), CNBC's index history (.DJI, daily from December 1929), Yahoo Finance (^DJI, from 1992), the St. Louis Fed's FRED series DJIA (last ten years) and the annual table in Wikipedia's Dow Jones Industrial Average article (to 2020). Every year-end close used agrees in at least two sources, and every yearly return agrees to 0.1 point in every source that covers it; the exceptions in the closes are footnoted under the table.
- S&P 500 and Nasdaq returns are the price returns from our S&P 500 table (Yahoo Finance ^GSPC, cross-checked with CNBC .SPX and NYU Stern's year-end levels) and our Nasdaq table (CNBC .IXIC, cross-checked with Yahoo Finance and FRED NASDAQCOM).
- Declines are measured from a record close to the lowest close before the index regains that record, on daily closing prices from December 12, 1914; "back above the peak" is the first close above the previous peak. Milestones are first closes at or above each level, checked against Wikipedia's list of closing milestones.
- Averages are arithmetic means of yearly returns; compound growth is the geometric mean; the standard deviation is the population standard deviation of yearly returns.
- Data compiled October 16, 2026. This page is for information only and is not investment advice.
Related Reading
- S&P 500 Returns by Year: Every Year 1928–2026 Table
- Nasdaq Returns by Year: Every Year 1972–2026 Table
- Every S&P 500 Bear Market Since 1929: When Was the Last?
- How Long Every Bear Market Took to Recover: 1929-2022
- The 20 Worst Days in S&P 500 History and What Came Next
- Pearl Harbor 1941: Dow -19.8% Crash, 307-Day Recovery
- S&P 500 Seasonality: The Best & Worst Months 1950–2026
- Market history: all SimianX reference pages
References
- MeasuringWorth — Daily closing values of the Dow Jones Average
- CNBC — Dow Jones Industrial Average (.DJI)
- Yahoo Finance — Dow Jones Industrial Average (^DJI) historical data
- FRED — Dow Jones Industrial Average (DJIA)
- S&P Dow Jones Indices — Dow Jones Industrial Average
- Internet Archive — Dow Jones closing prices 1921 to 1930 (automationinformation.com)
- Wikipedia — Dow Jones Industrial Average
- Wikipedia — Closing milestones of the Dow Jones Industrial Average
- Wikipedia — Wall Street crash of 1929