
The Latest US Jobs Numbers, the Release Calendar Through 2027 and Two Years of Payroll Data
Updated October 2026 (data through the September 2026 report, released October 2, 2026). This page is refreshed after every jobs report; the next update follows the November 6, 2026 release.
Latest US jobs report (September 2026, released Friday, October 2, 2026): nonfarm payrolls +29,000; unemployment rate 4.2%; average hourly earnings +0.1% in the month and +3.0% over 12 months, to $37.81. July was revised from +21,000 to −10,000 and August from +162,000 to +133,000, a combined −60,000. Next jobs report: October 2026 data on Friday, November 6, 2026, at 8:30 a.m. ET.
This is SimianX's permanent page for the US Employment Situation report, the monthly release that markets call the jobs report. Instead of a new preview and recap every month, we update this page after each release: the summary box, the release calendar and the table of the last 24 months — with first-reported and current payroll figures and the S&P 500 and Treasury moves on each release day — always show the latest data from the U.S. Bureau of Labor Statistics (BLS).
Latest jobs report: September 2026
| What | Detail |
|---|---|
| Released | Friday, October 2, 2026, 8:30 a.m. ET |
| Nonfarm payrolls | +29,000 (average monthly gain over the prior 12 months: +45,000) |
| Unemployment rate | 4.2%, after 4.1% in August; in a 4.1%–4.3% range since March |
| Average hourly earnings | +0.1% (+5 cents) to $37.81; +3.0% over 12 months |
| Revisions | July −31,000 (to −10,000), August −29,000 (to +133,000); combined −60,000 |
| Unemployed people | 7.1 million, of whom 1.9 million (27.1%) jobless for 27 weeks or more |
| Labor force participation | 61.8%; employment-population ratio 59.2% |
| Average workweek | 34.4 hours (private nonfarm) |
| Industries | Health care +17,000; construction +11,000; manufacturing +9,000; financial activities −7,000; all major industries "changed little" |
| Total nonfarm employment | 159.044 million, the highest level on record |
| Market reaction that day | S&P 500 +0.73%; 2-year Treasury yield +5 bp; 10-year yield +4 bp |
| Next release | October 2026 report: Friday, November 6, 2026, 8:30 a.m. ET |
What the September report means. Job growth in 2026 has run at about a third of its 2023 pace. Using current BLS estimates, payrolls rose by an average of 68,000 a month from January to September 2026, compared with 210,000 a month in 2023 and 122,000 in 2024, and 10,000 a month in 2025 after the annual benchmark revision. The unemployment rate has not followed payrolls lower: it peaked at 4.5% in November 2025 (first reported as 4.6%) and has stayed between 4.1% and 4.3% since March. Wage growth has slowed to 3.0% over 12 months, below the 3.7% CPI inflation rate for September reported in our US CPI report page. The Federal Reserve raised its policy rate on September 16 with payroll growth at this pace; its next decision comes on October 28, nine days before the October jobs report. Every rate move is tracked on our Fed interest rate decision page, and all SimianX rate and macro pages are collected on the Fed and rates topic hub.
We report only the official BLS figures. Consensus forecasts differ between surveys and are not published by the BLS, so this page does not list them.
Jobs report release schedule: remaining 2026 and 2027 dates
The Employment Situation is released at 8:30 a.m. Eastern Time, one hour before the US stock market opens, usually on the first Friday of the month. The BLS sets each date in advance; two 2027 releases fall on the second Friday. The BLS schedule lists:
| Reference month | Release date | Day | Timing versus the Fed |
|---|---|---|---|
| October 2026 | November 6, 2026 | Friday | After the October 28 decision; one month before the December 9 decision |
| November 2026 | December 4, 2026 | Friday | Four days before the December 8–9 meeting |
| December 2026 | January 8, 2027 | Friday | Before the January 26–27 meeting |
| January 2027 | February 5, 2027 | Friday | Includes the annual benchmark revision; no February meeting |
| February 2027 | March 5, 2027 | Friday | Before the March 16–17 meeting |
| March 2027 | April 2, 2027 | Friday | Before the April 27–28 meeting |
| April 2027 | May 7, 2027 | Friday | No May meeting |
| May 2027 | June 4, 2027 | Friday | Four days before the June 8–9 meeting |
| June 2027 | July 2, 2027 | Friday | Before the July 27–28 meeting |
| July 2027 | August 6, 2027 | Friday | No August meeting |
| August 2027 | September 3, 2027 | Friday | Before the September 14–15 meeting |
| September 2027 | October 8, 2027 | Friday | Before the October 26–27 meeting |
| October 2027 | November 5, 2027 | Friday | Before the December 7–8 meeting |
| November 2027 | December 3, 2027 | Friday | Four days before the December 7–8 meeting |
The report for December 2027 will be released in January 2028; the BLS has not yet scheduled it. Unlike the CPI calendar, every 2027 Fed meeting has a jobs report published in the weeks before it. Fed meeting dates are from the Federal Reserve's calendar and are listed with past market reactions in our FOMC meeting dates 2027 guide.
The last 24 jobs reports: payrolls, unemployment, wages and market reaction
The table lists the last 24 reference months, newest first. "First reported" is the payroll change in the month's own release; "current estimate" is today's BLS figure after monthly revisions and the February 2026 benchmark revision. The unemployment rate and the 12-month change in average hourly earnings are shown as first reported. The two market columns are the close-to-close change on the release day: the S&P 500 in percent, and the 2-year Treasury yield in basis points.
| Reference month | Released | Payrolls, first reported | Payrolls, current estimate | Unemployment rate | Hourly earnings, 12 months | S&P 500 that day | 2-yr Treasury yield |
|---|---|---|---|---|---|---|---|
| September 2026 | Oct 2, 2026 | +29,000 | +29,000 | 4.2% | 3.0% | +0.73% | +5 bp |
| August 2026 | Sep 4, 2026 | +162,000 | +133,000 | 4.1% | 3.1% | −0.38% | +3 bp |
| July 2026 | Aug 7, 2026 | −23,000 | −10,000 | 4.1% | 3.2% | +0.62% | −6 bp |
| June 2026 | Jul 2, 2026 | +57,000 | +31,000 | 4.2% | 3.5% | 0.00% | −3 bp |
| May 2026 | Jun 5, 2026 | +172,000 | +63,000 | 4.3% | 3.4% | −2.64% | +12 bp |
| April 2026 | May 8, 2026 | +115,000 | +148,000 | 4.3% | 3.6% | +0.84% | −2 bp |
| March 2026 | Apr 3, 2026 | +178,000 | +214,000 | 4.3% | 3.5% | closed (Good Friday) | +5 bp |
| February 2026 | Mar 6, 2026 | −92,000 | −156,000 | 4.4% | 3.8% | −1.33% | −1 bp |
| January 2026 | Feb 11, 2026 | +130,000 | +160,000 | 4.3% | 3.7% | 0.00% | +7 bp |
| December 2025 | Jan 9, 2026 | +50,000 | −17,000 | 4.4% | 3.8% | +0.65% | +5 bp |
| November 2025 | Dec 16, 2025 | +64,000 | +41,000 | 4.6% | 3.5% | −0.24% | −3 bp |
| October 2025 | Dec 16, 2025 (with November) | −105,000 | −140,000 | not collected | — | — | — |
| September 2025 | Nov 20, 2025 | +119,000 | +76,000 | 4.4% | 3.8% | −1.56% | −3 bp |
| August 2025 | Sep 5, 2025 | +22,000 | −70,000 | 4.3% | 3.7% | −0.32% | −8 bp |
| July 2025 | Aug 1, 2025 | +73,000 | +64,000 | 4.2% | 3.9% | −1.60% | −25 bp |
| June 2025 | Jul 3, 2025 | +147,000 | −20,000 | 4.1% | 3.7% | +0.83% | +10 bp |
| May 2025 | Jun 6, 2025 | +139,000 | +13,000 | 4.2% | 3.9% | +1.03% | +12 bp |
| April 2025 | May 2, 2025 | +177,000 | +108,000 | 4.2% | 3.8% | +1.47% | +13 bp |
| March 2025 | Apr 4, 2025 | +228,000 | +67,000 | 4.2% | 3.8% | −5.97% | −3 bp |
| February 2025 | Mar 7, 2025 | +151,000 | +42,000 | 4.1% | 4.0% | +0.55% | +3 bp |
| January 2025 | Feb 7, 2025 | +143,000 | −48,000 | 4.0% | 4.1% | −0.95% | +8 bp |
| December 2024 | Jan 10, 2025 | +256,000 | +237,000 | 4.1% | 3.9% | −1.54% | +13 bp |
| November 2024 | Dec 6, 2024 | +227,000 | +134,000 | 4.2% | 4.0% | +0.25% | −5 bp |
| October 2024 | Nov 1, 2024 | +12,000 | +33,000 | 4.1% | 4.0% | +0.41% | +5 bp |
Three notes on the table. There was no separate October 2025 report: the BLS published October payrolls with the November report on December 16, 2025, and the household survey that produces the unemployment rate did not collect October data. The March 2026 report came out on Good Friday, April 3, 2026, when the stock market was closed; the S&P 500 rose 0.44% on the next session, April 6. The January 2026 report, scheduled for February 6, was published on February 11 after a brief lapse in federal appropriations that ended on February 3, 2026.
How much jobs numbers get revised
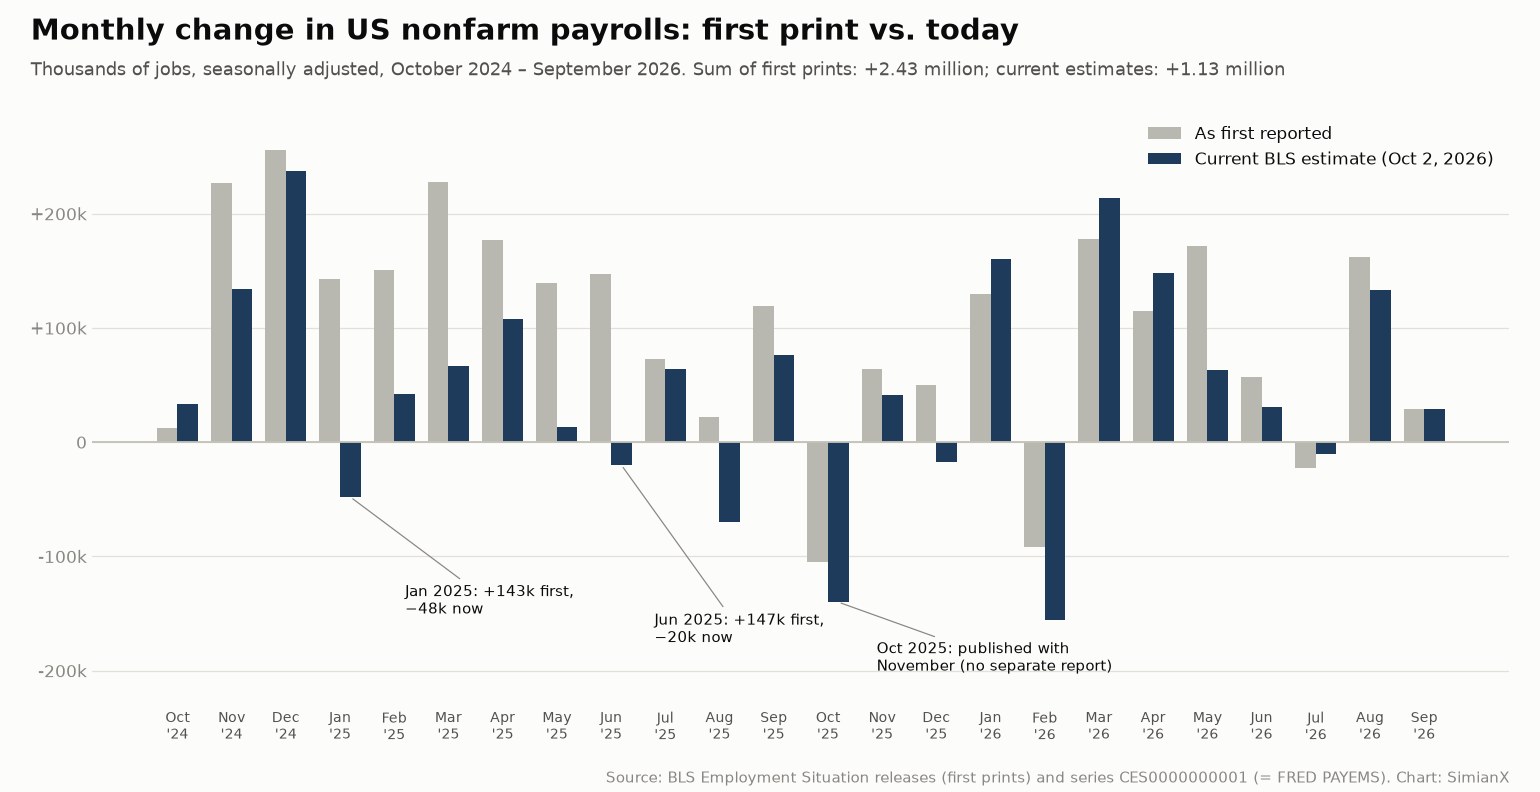
Each monthly payroll figure is revised twice in the following two reports, as more employer surveys arrive, and again once a year when the BLS benchmarks the survey to unemployment-insurance tax records. Over the 24 months in the table, the first prints add up to +2.43 million jobs; the current estimates add up to +1.13 million. Eighteen of the 24 months are now lower than first reported. The largest downward changes are January 2025 (+143,000 first reported, −48,000 now), June 2025 (+147,000 to −20,000) and March 2025 (+228,000 to +67,000).
- The 2025 benchmark revision. With the January 2026 report, the BLS lowered its March 2025 employment level by 898,000 (seasonally adjusted) and revised job growth for calendar 2025 from +584,000 to +181,000. Further monthly revisions have since brought the 2025 total to +116,000.
- The 2026 preliminary benchmark. On August 28, 2026, the BLS estimated that the March 2026 level will be revised by −79,000 (−0.1%), close to the 10-year average absolute revision of 0.2%. The final figure arrives with the January 2027 report on February 5, 2027.
- The July 2025 report. On August 1, 2025, the BLS revised May and June down by a combined 258,000. The same day, President Donald Trump fired BLS Commissioner Erika McEntarfer, as documented on her Wikipedia page. Payroll estimates are produced by BLS staff from the survey sample; the BLS explains its revision process on its CES revisions page.
How stocks and bonds react on jobs-report day
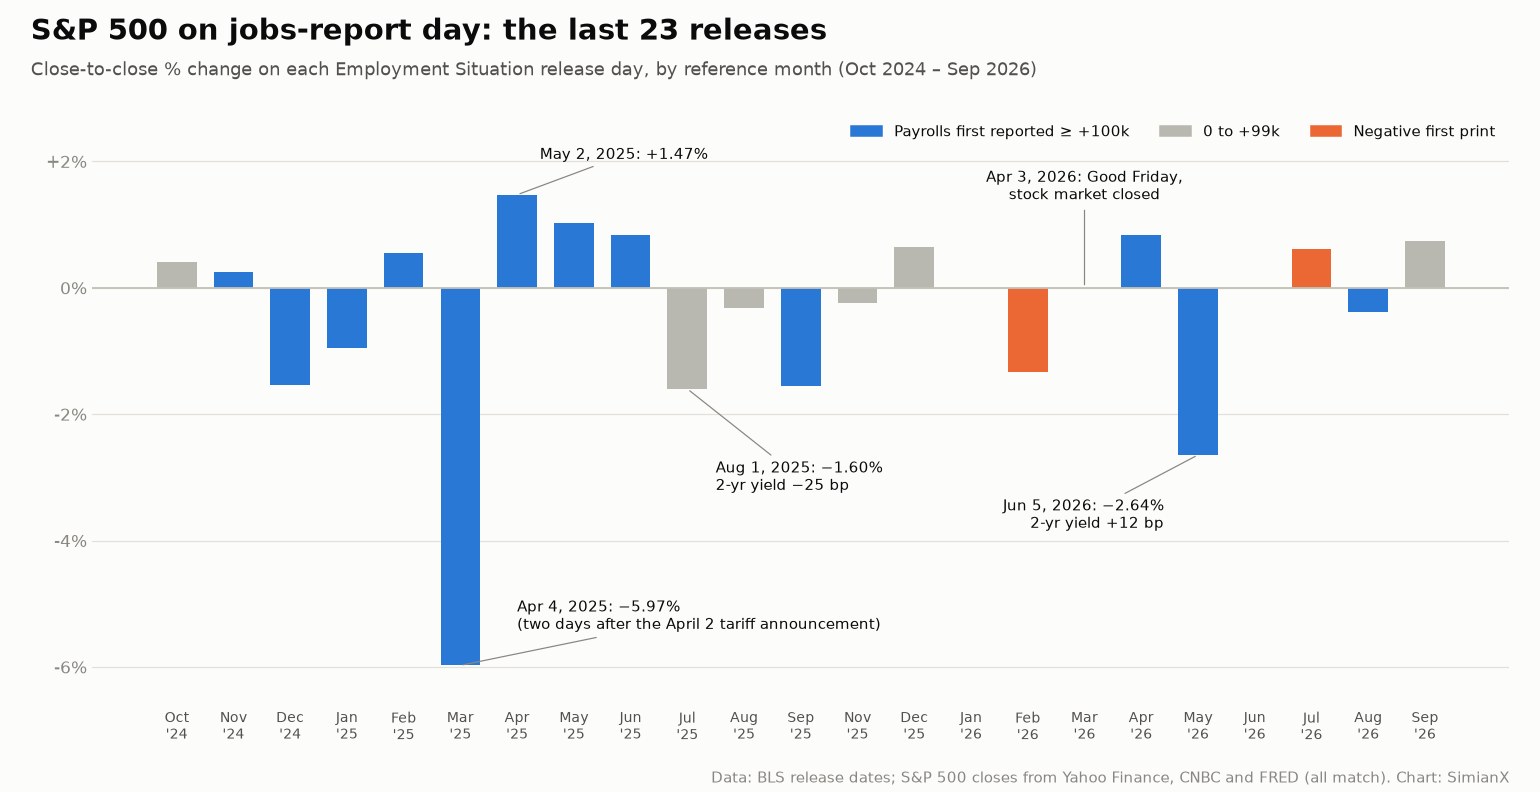
Over the 22 release days in the table with a stock-market session, the S&P 500 rose 11 times and fell 11 times, and moved by an average of 1.09% in either direction, against 0.66% on all other trading days from November 2024 to October 2026. Excluding April 4, 2025, the average is 0.85%. The 2-year Treasury yield, the maturity most tied to expected Fed policy, moved by 7.1 basis points on average on jobs days, about twice its 3.7-basis-point average on other days and more than its 4.5-basis-point average on CPI days over a similar period. Eight release days produced a stock move of 1% or more:
- April 4, 2025 (−5.97%). The March report showed +228,000 payrolls, but the session was the second after the April 2 tariff announcement; trade policy, not jobs data, drove the day.
- June 5, 2026 (−2.64%). Payrolls rose 172,000 (since revised to +63,000) and the 2-year yield rose 12 basis points.
- August 1, 2025 (−1.60%). Payrolls rose 73,000 and May–June were revised down by 258,000; the 2-year yield fell 25 basis points, the largest move in the table. The Fed cut rates seven weeks later, on September 17, 2025.
- November 20, 2025 (−1.56%). The September 2025 report, delayed six weeks by the government shutdown.
- January 10, 2025 (−1.54%). Payrolls rose 256,000; the 2-year yield rose 13 basis points.
- May 2, 2025 (+1.47%) and June 6, 2025 (+1.03%). Payrolls of +177,000 and +139,000 as first reported; the 2-year yield rose 13 and 12 basis points.
- March 6, 2026 (−1.33%). Payrolls fell 92,000 as first reported, with health care employment down because of strike activity.
Stocks and the 2-year yield did not move in a fixed pattern: on the 12 release days when the 2-year yield rose, the S&P 500 fell on 5; on the 10 days it fell, the index rose on 4. For the long view of how the Fed responded to past labor-market turns, see every Fed rate-cut cycle since 1980 and every Fed rate-hike cycle since 1983.
Payroll growth by year, 2015–2026
| Year | Change in payrolls (December to December) | Average per month |
|---|---|---|
| 2026 (January–September) | +612,000 | +68,000 |
| 2025 | +116,000 | +10,000 |
| 2024 | +1,459,000 | +122,000 |
| 2023 | +2,515,000 | +210,000 |
| 2022 | +4,526,000 | +377,000 |
| 2021 | +7,268,000 | +606,000 |
| 2020 | −9,246,000 | −770,000 |
| 2019 | +1,985,000 | +165,000 |
| 2018 | +2,286,000 | +190,000 |
| 2017 | +2,115,000 | +176,000 |
| 2016 | +2,331,000 | +194,000 |
| 2015 | +2,713,000 | +226,000 |
Figures are current BLS estimates (series CES0000000001), not first prints. The 2026 figure runs from December 2025 to September 2026.
Payrolls through history: recessions and record months
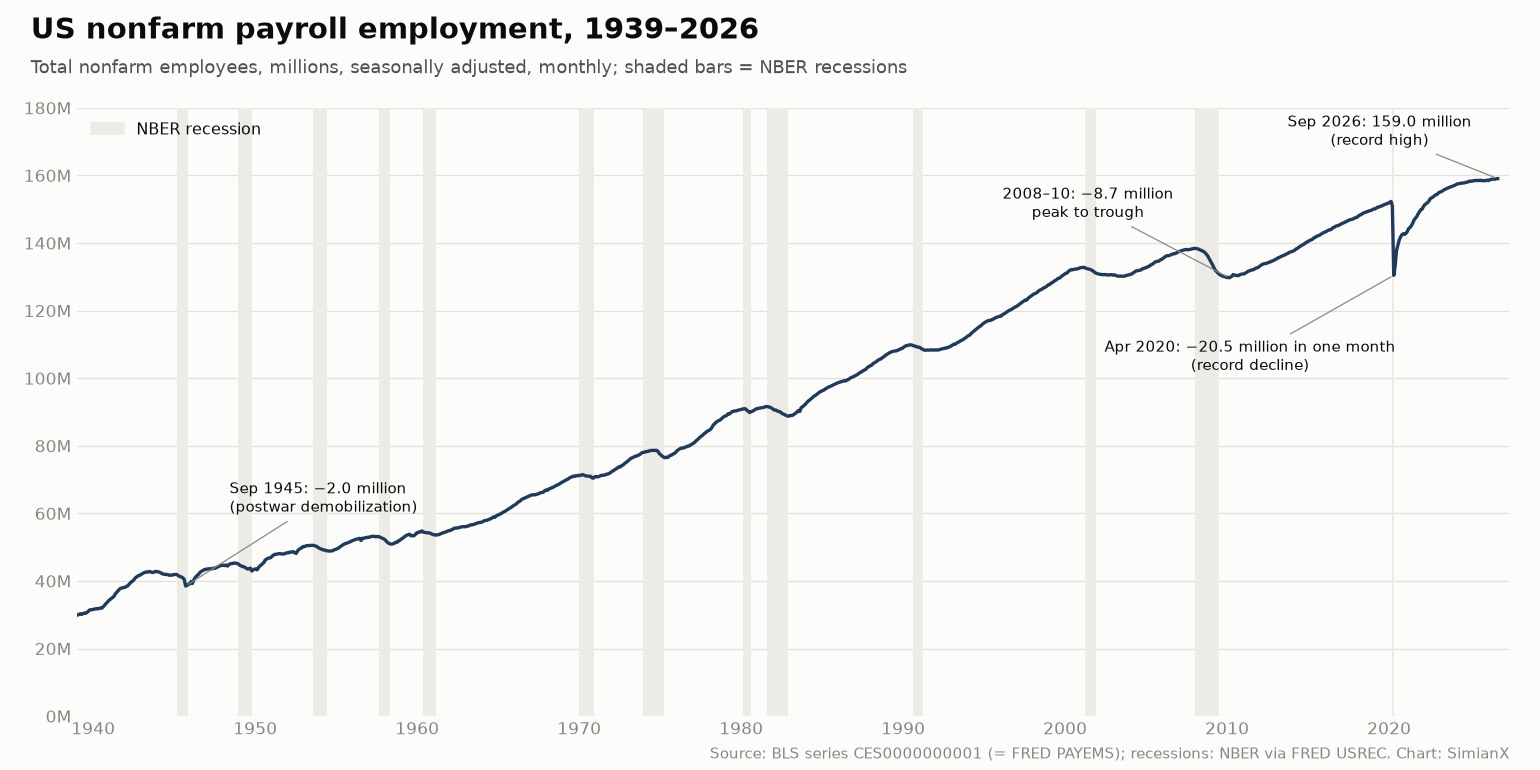
The BLS payroll series starts in 1939. Every recession since then has cut payroll employment, and the depth of the loss has varied widely. The table uses current BLS data and the recession dates of the National Bureau of Economic Research:
| Recession (NBER) | Payroll peak | Payroll low | Jobs lost | Decline | Months from peak until the peak was regained |
|---|---|---|---|---|---|
| 1970 | March 1970 | November 1970 | −1.04 million | −1.5% | 18 |
| 1973–75 | February 1974 | April 1975 | −1.79 million | −2.3% | 23 |
| 1980 | March 1980 | July 1980 | −1.15 million | −1.3% | 10 |
| 1981–82 | July 1981 | December 1982 | −2.83 million | −3.1% | 28 |
| 1990–91 | June 1990 | May 1991 | −1.60 million | −1.5% | 32 |
| 2001 | February 2001 | August 2003 | −2.64 million | −2.0% | 48 |
| 2007–09 | December 2007 | February 2010 | −8.69 million | −6.3% | 77 |
| 2020 | February 2020 | April 2020 | −21.87 million | −14.4% | 28 |
Records in the series:
- Largest monthly decline: April 2020, −20.47 million (−13.6%). Before 2020 the record was September 1945, −1.96 million, as wartime production ended.
- Largest monthly gain: June 2020, +4.63 million. Outside 2020, the record is September 1983, +1.12 million.
- Unemployment rate: highest 14.8% (April 2020) and lowest 2.5% (May 1953) since the series began in 1948. The post-pandemic low was 3.4% in April 2023.
- Employment level: 159.044 million in September 2026, the highest on record.
In 2001 and 2007–09 payrolls kept falling for months after the NBER-dated recession ended, and the 2007–09 loss took more than six years to recover. For how bond markets signaled past downturns, see our yield curve inversions and US recessions reference table, and for how gold behaved in each one, our gold in every US recession scorecard.
Why there was no October 2025 jobs report
Federal appropriations lapsed from October 1 through November 12, 2025. The September 2025 report, scheduled for October 3, was published on November 20, 2025. The BLS did not publish an October 2025 report: establishment-survey data for October appeared with the November report on December 16, 2025, and household-survey data for October were never collected, so there is no October 2025 unemployment rate. The BLS also did not produce household-survey estimates for the fourth quarter of 2025, and its 2025 annual averages use 11 months. A second, shorter lapse at the start of 2026 moved the January 2026 report from February 6 to February 11, 2026. Both episodes are documented in the BLS releases listed under References.
How to read a jobs report
- Two surveys. The payroll number comes from the establishment survey of about 119,000 businesses and government agencies (about 622,000 worksites). The unemployment rate comes from the household survey of about 60,000 households. The two can point in different directions in any one month.
- Payrolls are a net change. The headline counts jobs, not people, and is the net change in employment from the previous month, seasonally adjusted.
- Look at the revisions. The two prior months are revised in every report, and the net revision can be as large as the new month's figure — as in September 2026, when −60,000 of revisions exceeded the +29,000 headline.
- Unemployment rate. The share of the labor force without a job and actively looking. It can fall because people find work or because they stop looking, so read it with the participation rate (61.8% in September 2026).
- Average hourly earnings. The wage measure markets watch for inflation pressure. Compare the 12-month change with CPI inflation to see whether real wages are rising.
- The benchmark. Each February, with the January report, the BLS re-anchors the payroll level to tax-record counts. The preliminary estimate comes out each August or September.
- What the Fed watches. The Fed's maximum-employment goal has no single target number. In its September 2026 projections, the median official expected an unemployment rate of 4.1% at the end of 2026 and 4.2% in the longer run.
How this page is updated
How this page is updated: after every jobs report. On each release day we refresh the summary box after the 8:30 a.m. ET publication, add the new month to the table of the last 24 months (and drop the oldest), update the "current estimate" column for the revised months, record the S&P 500 and 2-year Treasury moves at the close, and roll the next release date forward. Each February we add the benchmark revision, and when the BLS publishes the following year's schedule we extend the calendar. Last updated: October 16, 2026. The next update follows the October 2026 report on November 6.
Follow the next jobs report with SimianX
On jobs-report mornings the numbers come out an hour before the opening bell, and futures, Treasuries and the dollar react within seconds. SimianX's Market Pulse ranks the headlines as they land, so the payroll print, the Fed reaction and the largest market moves arrive in order of importance. The Live Command Room puts a team of AI agents on any ticker in real time — rate-sensitive stocks such as JPM or the broad market — and inflation data is covered on our always-updated PCE inflation report page. Plans start free.
Frequently asked questions
When is the next jobs report?
The October 2026 jobs report will be released on Friday, November 6, 2026, at 8:30 a.m. ET. The November 2026 report follows on Friday, December 4, 2026, and the December 2026 report on Friday, January 8, 2027.
What time is the jobs report released?
The BLS publishes the Employment Situation at 8:30 a.m. Eastern Time, one hour before the New York Stock Exchange opens. It is usually released on the first Friday of the month.
What is nonfarm payrolls?
Nonfarm payrolls is the BLS count of paid jobs at US businesses and government agencies, excluding farm workers, private household employees and the self-employed. The monthly change in that count, from the establishment survey, is the headline number of the jobs report.
What was the latest jobs report?
The September 2026 report, released on October 2, 2026, showed payrolls up 29,000, an unemployment rate of 4.2% and average hourly earnings up 3.0% over 12 months. July and August were revised down by a combined 60,000.
What is the current US unemployment rate?
The unemployment rate was 4.2% in September 2026, according to the BLS. It has stayed between 4.1% and 4.3% since March 2026.
Why do jobs numbers get revised?
More employers report after the first deadline, so each month is revised in the next two reports, and the whole series is re-anchored to unemployment-insurance tax records every February. Over October 2024 to September 2026, first prints summed to +2.43 million jobs; current estimates sum to +1.13 million.
Why was there no October 2025 jobs report?
The federal government shutdown from October 1 to November 12, 2025 stopped data collection. The BLS released October payrolls with the November report on December 16, 2025, and never collected October household data, so there is no October 2025 unemployment rate.
Does the stock market go up or down on jobs report day?
Neither reliably. Over the last 22 release days with a trading session, the S&P 500 rose 11 times and fell 11 times, but the average move was 1.09% in either direction, larger than the 0.66% average on other days.
Methodology and sources
- First-reported figures come from each monthly BLS Employment Situation release (Summary tables A and B and the release text), using the values published for that reference month. Release dates are from the BLS release archive.
- Current estimates are BLS series CES0000000001 (total nonfarm), LNS14000000 (unemployment rate) and CES0500000003 (average hourly earnings, private) from the BLS public data API, cross-checked against FRED series PAYEMS, UNRATE and CES0500000003: all 1,041 overlapping payroll months, 932 unemployment months and 93 earnings months match exactly.
- Recession dates are NBER business-cycle dates (FRED series USREC). Peak and low months use the current payroll series.
- S&P 500 changes are close-to-close price changes from Yahoo Finance, cross-checked against CNBC and FRED; all three matched on every release day. "Other trading days" covers November 2024 to October 15, 2026, excluding release days.
- Treasury yields are U.S. Treasury daily par yields, change from the previous trading day, cross-checked against CNBC's 2-year yield history (same direction on all 23 release days with data). Data compiled October 16, 2026. This page is for information only and is not investment advice.
Related Reading
- Fed Interest Rate Decision: Latest FOMC Result and History
- US CPI Report: Latest Inflation Data and Release Schedule
- PCE Inflation Report: Latest Data and Release Schedule
- Yield Curve Inversions and US Recessions: A Reference Table
- FOMC Meeting Dates 2027: How the S&P 500 Moves on Fed Days
- Every Fed Rate-Cut Cycle Since 1980: Stocks, Bonds & Gold
- Every Fed Rate-Hike Cycle Since 1983: S&P 500 & Chip Stocks
- Gold in Every US Recession Since 1973: Safe-Haven Scorecard
- Fed and rates: all SimianX pages
References
- U.S. Bureau of Labor Statistics — The Employment Situation, September 2026
- U.S. Bureau of Labor Statistics — Employment Situation release schedule
- U.S. Bureau of Labor Statistics — Archived Employment Situation releases
- U.S. Bureau of Labor Statistics — November 2025 report and shutdown notes
- U.S. Bureau of Labor Statistics — January 2026 report and 2025 benchmark revision
- U.S. Bureau of Labor Statistics — CES preliminary benchmark, March 2026
- U.S. Bureau of Labor Statistics — CES benchmark article
- U.S. Bureau of Labor Statistics — Current Employment Statistics (CES)
- U.S. Bureau of Labor Statistics — Current Population Survey (CPS)
- Federal Reserve — FOMC meeting calendar
- Federal Reserve — Summary of Economic Projections, September 16, 2026
- National Bureau of Economic Research — US business cycle expansions and contractions
- FRED — All employees, total nonfarm (PAYEMS)
- FRED — Unemployment rate (UNRATE)
- FRED — Average hourly earnings, total private (CES0500000003)
- U.S. Treasury — Daily Treasury par yield curve rates
- FRED — S&P 500 daily index (SP500)