
The Latest PCE Inflation Numbers, the BEA Calendar Through 2027 and Two Years of Fed-Target Data
Updated October 2026 (data through the August 2026 report, released September 30, 2026). This page is refreshed after every PCE release; the next update follows the October 29, 2026 report.
Latest PCE inflation report (August 2026, released Wednesday, September 30, 2026): the PCE price index rose 0.3% in the month and 3.4% over 12 months; core PCE, which excludes food and energy, rose 0.2% in the month and 3.0% over 12 months. The Federal Reserve's target is 2% on the headline PCE index. Next PCE report: September 2026 data on Thursday, October 29, 2026, at 8:30 a.m. ET, one day after the Fed's October 28 decision.
This is SimianX's permanent page for the personal consumption expenditures (PCE) price index, the inflation measure the Federal Reserve uses for its 2% goal. The Bureau of Economic Analysis (BEA) publishes it each month in its Personal Income and Outlays report. We update this page after each release: the summary box, the release calendar and the table of the last 24 reports — with the S&P 500 and Treasury moves on each release day — always show the latest BEA data, and a comparison table tracks PCE against the Consumer Price Index (CPI).
Latest PCE report: August 2026
| What | Detail |
|---|---|
| Released | Wednesday, September 30, 2026, 8:30 a.m. ET, with the third estimate of second-quarter GDP |
| PCE price index, 12 months | 3.4%, after 3.7% in July (as first reported) |
| PCE price index, 1 month | +0.3% (0.31% unrounded); July revised to +0.1% |
| Core PCE, 12 months | 3.0%, after 3.3% in July (as first reported) |
| Core PCE, 1 month | +0.2% (0.25% unrounded); July revised to +0.1% |
| Energy prices | +2.3% in the month; +16.8% over 12 months |
| Food prices (at home) | Unchanged in the month; +1.9% over 12 months |
| Consumer spending | +0.9% in current dollars ($190.8 billion); +0.6% after inflation |
| Personal income | +0.2%; personal saving rate 4.1% |
| Annual update | Data revised back to January 2021 in this release (see below) |
| Market reaction that day | S&P 500 −0.25%; 2-year Treasury yield −1 bp; 10-year yield +3 bp |
| Next release | September 2026 PCE: Thursday, October 29, 2026, 8:30 a.m. ET |
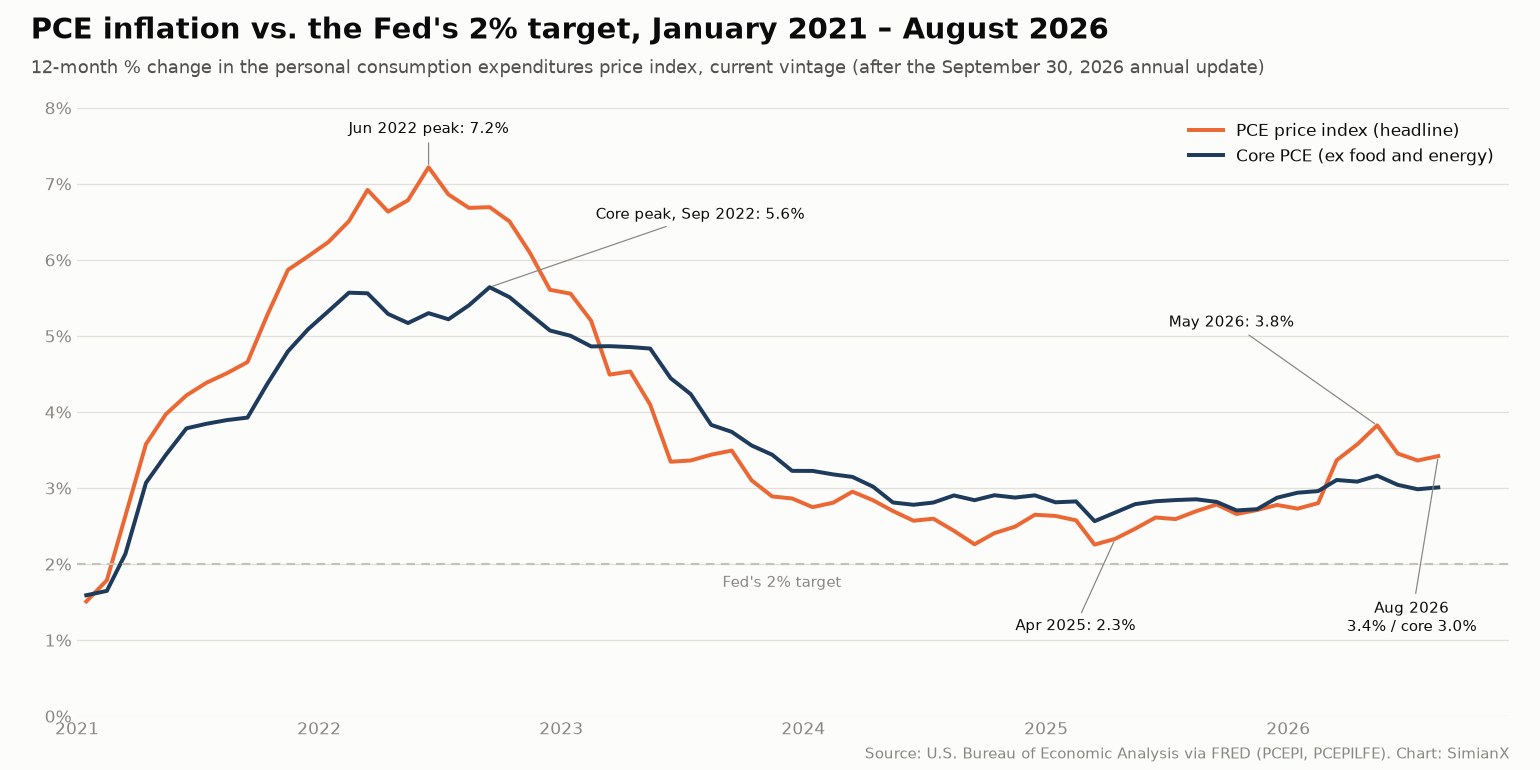
What the August report means. Headline PCE inflation climbed from 2.8% in early 2026 to a peak of 3.8% in May on the current data — first reported as 4.1% — as energy prices rose, and it has eased since. Core PCE has stayed between 2.9% and 3.2% all year on the current data. Both measures remain more than a percentage point above the Fed's 2% target, which is why the Fed raised rates on September 16 and why its officials, in their September projections, expected PCE inflation of 3.7% and core PCE inflation of 3.4% for the fourth quarter of 2026, falling to 2.1% in 2028 and 2.0% in 2029. The Fed's decisions are tracked on our Fed interest rate decision page, and all SimianX rate and macro pages are on the Fed and rates topic hub.
We report only the official BEA figures. Consensus forecasts differ between surveys and are not published by the BEA, so this page does not list them.
PCE release schedule: remaining 2026 and 2027 dates
The Personal Income and Outlays report, which contains the PCE price index, is released at 8:30 a.m. Eastern Time, usually in the last week of the month after the reference month. Since February 2026 each release has come out on the same morning as a GDP estimate. The BEA schedule lists:
| Reference month | Release date | Day | Timing versus the Fed |
|---|---|---|---|
| September 2026 | October 29, 2026 | Thursday | One day after the October 28 decision |
| October 2026 | November 25, 2026 | Wednesday | Two weeks before the December 9 decision |
| November 2026 | December 23, 2026 | Wednesday | Two weeks after the December 9 decision |
| December 2026 | January 28, 2027 | Thursday | One day after the January 27 decision |
| January 2027 | February 25, 2027 | Thursday | Three weeks before the March 17 decision |
| February 2027 | March 31, 2027 | Wednesday | Four weeks before the April 28 decision |
| March 2027 | April 29, 2027 | Thursday | One day after the April 28 decision |
| April 2027 | May 27, 2027 | Thursday | Two weeks before the June 9 decision |
| May 2027 | June 25, 2027 | Friday | Five weeks before the July 28 decision |
| June 2027 | July 29, 2027 | Thursday | One day after the July 28 decision |
| July 2027 | August 25, 2027 | Wednesday | Three weeks before the September 15 decision |
| August 2027 | September 30, 2027 | Thursday | Four weeks before the October 27 decision |
| September 2027 | October 28, 2027 | Thursday | One day after the October 27 decision |
| October 2027 | November 24, 2027 | Wednesday | Two weeks before the December 8 decision |
| November 2027 | December 22, 2027 | Wednesday | Two weeks after the December 8 decision |
Five of these releases come the morning after a Fed decision. At those meetings the Committee has the month's CPI report, published about two weeks earlier, but not the official PCE figure. The CPI dates are on our US CPI report page, and the Fed meeting calendar with past market reactions is in our FOMC meeting dates 2027 guide.
The last 24 PCE reports: inflation data and market reaction
The table lists the last 24 reference months, newest first, with every figure as first reported in that month's release. Monthly changes are seasonally adjusted. The two market columns show the close-to-close change on the release day: the S&P 500 in percent and the 2-year Treasury yield in basis points.
| Reference month | Released | Headline, 1 month | Headline, 12 months | Core, 1 month | Core, 12 months | S&P 500 that day | 2-yr Treasury yield |
|---|---|---|---|---|---|---|---|
| August 2026 | Sep 30, 2026 | +0.3% | 3.4% | +0.2% | 3.0% | −0.25% | −1 bp |
| July 2026 | Aug 26, 2026 | +0.2% | 3.7% | +0.2% | 3.3% | −0.02% | +2 bp |
| June 2026 | Jul 30, 2026 | −0.1% | 3.7% | +0.1% | 3.3% | +1.66% | +1 bp |
| May 2026 | Jun 25, 2026 | +0.4% | 4.1% | +0.3% | 3.4% | −0.01% | −2 bp |
| April 2026 | May 28, 2026 | +0.4% | 3.8% | +0.2% | 3.3% | +0.58% | −1 bp |
| March 2026 | Apr 30, 2026 | +0.7% | 3.5% | +0.3% | 3.2% | +1.02% | −4 bp |
| February 2026 | Apr 9, 2026 | +0.4% | 2.8% | +0.4% | 3.0% | +0.62% | −1 bp |
| January 2026 | Mar 13, 2026 | +0.3% | 2.8% | +0.4% | 3.1% | −0.61% | −3 bp |
| December 2025 | Feb 20, 2026 | +0.4% | 2.9% | +0.4% | 3.0% | +0.69% | +1 bp |
| November 2025 | Jan 22, 2026 | +0.2% | 2.8% | +0.2% | 2.8% | +0.55% | +1 bp |
| October 2025 | Jan 22, 2026 | +0.2% | 2.7% | +0.2% | 2.7% | +0.55% | +1 bp |
| September 2025 | Dec 5, 2025 | +0.3% | 2.8% | +0.2% | 2.8% | +0.19% | +4 bp |
| August 2025 | Sep 26, 2025 | +0.3% | 2.7% | +0.2% | 2.9% | +0.59% | −1 bp |
| July 2025 | Aug 29, 2025 | +0.2% | 2.6% | +0.3% | 2.9% | −0.64% | −3 bp |
| June 2025 | Jul 31, 2025 | +0.3% | 2.6% | +0.3% | 2.8% | −0.37% | 0 bp |
| May 2025 | Jun 27, 2025 | +0.1% | 2.3% | +0.2% | 2.7% | +0.52% | +3 bp |
| April 2025 | May 30, 2025 | +0.1% | 2.1% | +0.1% | 2.5% | −0.01% | −3 bp |
| March 2025 | Apr 30, 2025 | 0.0% | 2.3% | 0.0% | 2.6% | +0.15% | −5 bp |
| February 2025 | Mar 28, 2025 | +0.3% | 2.5% | +0.4% | 2.8% | −1.97% | −8 bp |
| January 2025 | Feb 28, 2025 | +0.3% | 2.5% | +0.3% | 2.6% | +1.59% | −8 bp |
| December 2024 | Jan 31, 2025 | +0.3% | 2.6% | +0.2% | 2.8% | −0.50% | +4 bp |
| November 2024 | Dec 20, 2024 | +0.1% | 2.4% | +0.1% | 2.8% | +1.09% | −2 bp |
| October 2024 | Nov 27, 2024 | +0.2% | 2.3% | +0.3% | 2.8% | −0.38% | −2 bp |
| September 2024 | Oct 31, 2024 | +0.2% | 2.1% | +0.3% | 2.7% | −1.86% | +1 bp |
Two notes on the table. October and November 2025 were published together on January 22, 2026, because of the 2025 government shutdown. And the September 30, 2026 release included the BEA's annual update, which revised the 2026 figures down: May 2026 now reads 3.8% (first reported 4.1%) and core 3.2% (first reported 3.4%); July now reads 3.4% and core 3.0% (first reported 3.7% and 3.3%). The chart below uses the current, revised data.
PCE vs CPI: how the two inflation measures compare
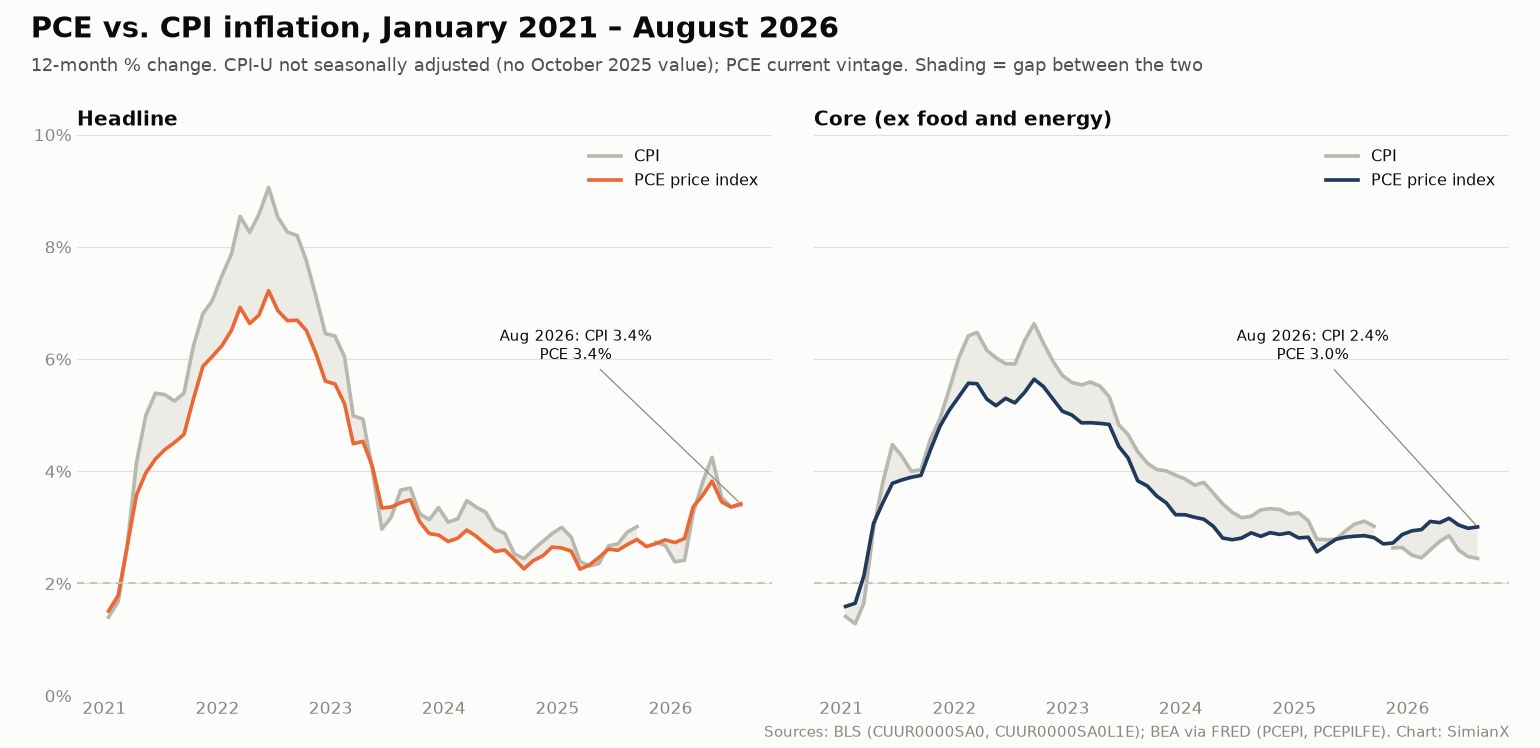
The CPI, published by the Bureau of Labor Statistics, and the PCE price index, published by the BEA, both measure consumer prices but differ in four ways that the BEA groups as formula, weight, scope and "other" effects:
- Formula. The PCE index is a chain-type Fisher-Ideal index that adjusts for consumers switching between goods; the CPI uses a modified Laspeyres formula.
- Weights. Housing has a much larger weight in the CPI, where shelter is 35.6% of the index (December 2025), than in the PCE index. In the BEA's worked example of the gap, imputed rent of owner-occupied housing accounts for most of the weight effect.
- Scope. The PCE index covers spending by and on behalf of households, including employer-paid health insurance and Medicare and Medicaid payments; the CPI covers out-of-pocket spending by urban households.
- Timing. The CPI comes out about two weeks earlier, so it sets market expectations for the PCE print.
Here are the two measures side by side for the last 18 reports, both as first reported:
| Month | CPI, 12 months | PCE, 12 months | Gap (CPI − PCE) | Core CPI, 12 months | Core PCE, 12 months | Gap (core) |
|---|---|---|---|---|---|---|
| Aug 2026 | 3.4% | 3.4% | 0.0 | 2.4% | 3.0% | −0.6 |
| Jul 2026 | 3.4% | 3.7% | −0.3 | 2.5% | 3.3% | −0.8 |
| Jun 2026 | 3.5% | 3.7% | −0.2 | 2.6% | 3.3% | −0.7 |
| May 2026 | 4.2% | 4.1% | +0.1 | 2.9% | 3.4% | −0.5 |
| Apr 2026 | 3.8% | 3.8% | 0.0 | 2.8% | 3.3% | −0.5 |
| Mar 2026 | 3.3% | 3.5% | −0.2 | 2.6% | 3.2% | −0.6 |
| Feb 2026 | 2.4% | 2.8% | −0.4 | 2.5% | 3.0% | −0.5 |
| Jan 2026 | 2.4% | 2.8% | −0.4 | 2.5% | 3.1% | −0.6 |
| Dec 2025 | 2.7% | 2.9% | −0.2 | 2.6% | 3.0% | −0.4 |
| Nov 2025 | 2.7% | 2.8% | −0.1 | 2.6% | 2.8% | −0.2 |
| Oct 2025 | not published | 2.7% | — | not published | 2.7% | — |
| Sep 2025 | 3.0% | 2.8% | +0.2 | 3.0% | 2.8% | +0.2 |
| Aug 2025 | 2.9% | 2.7% | +0.2 | 3.1% | 2.9% | +0.2 |
| Jul 2025 | 2.7% | 2.6% | +0.1 | 3.1% | 2.9% | +0.2 |
| Jun 2025 | 2.7% | 2.6% | +0.1 | 2.9% | 2.8% | +0.1 |
| May 2025 | 2.4% | 2.3% | +0.1 | 2.8% | 2.7% | +0.1 |
| Apr 2025 | 2.3% | 2.1% | +0.2 | 2.8% | 2.5% | +0.3 |
| Mar 2025 | 2.4% | 2.3% | +0.1 | 2.8% | 2.6% | +0.2 |
Over the long run the CPI has usually run above the PCE index. That held through September 2025. Since November 2025 the pattern has reversed for core inflation: core PCE has run 0.2 to 0.8 percentage point above core CPI, while headline gaps have been small. The BEA's reconciliation table (NIPA Table 9.1U) breaks each month's gap into the four effects listed above. Because October 2025 CPI data were never collected, the BEA imputed the missing October prices it normally takes from the CPI, as explained in its January 22, 2026 release.
The Fed's 2% target and where PCE stands
The Federal Open Market Committee defines price stability as inflation of 2% over the longer run, measured by the annual change in the PCE price index. It first adopted that target in January 2012 and reaffirms it in its Statement on Longer-Run Goals and Monetary Policy Strategy. The Fed's own explanation is on its page why the Fed aims for 2 percent inflation.
- Distance from target. In August 2026, headline PCE was 1.4 points above 2% and core PCE 1.0 point above.
- Last time at target. On the current data, both headline and core PCE inflation were last at or below 2.0% in February 2021.
- Fed projections. The September 2026 Summary of Economic Projections puts median PCE inflation at 3.7% for 2026, 2.3% for 2027, 2.1% for 2028 and 2.0% for 2029; core PCE at 3.4%, 2.5%, 2.2% and 2.0%.
- Policy response. The Fed raised the federal funds rate by 25 basis points to 3.75%–4.00% on September 16, 2026. Past responses to inflation are compared in our every Fed rate-hike cycle since 1983 and every Fed rate-cut cycle since 1980 reference pages.
Other PCE-based measures, such as the Dallas Fed's trimmed mean PCE inflation rate, remove the most extreme price changes each month instead of excluding food and energy.
How stocks and bonds react on PCE day
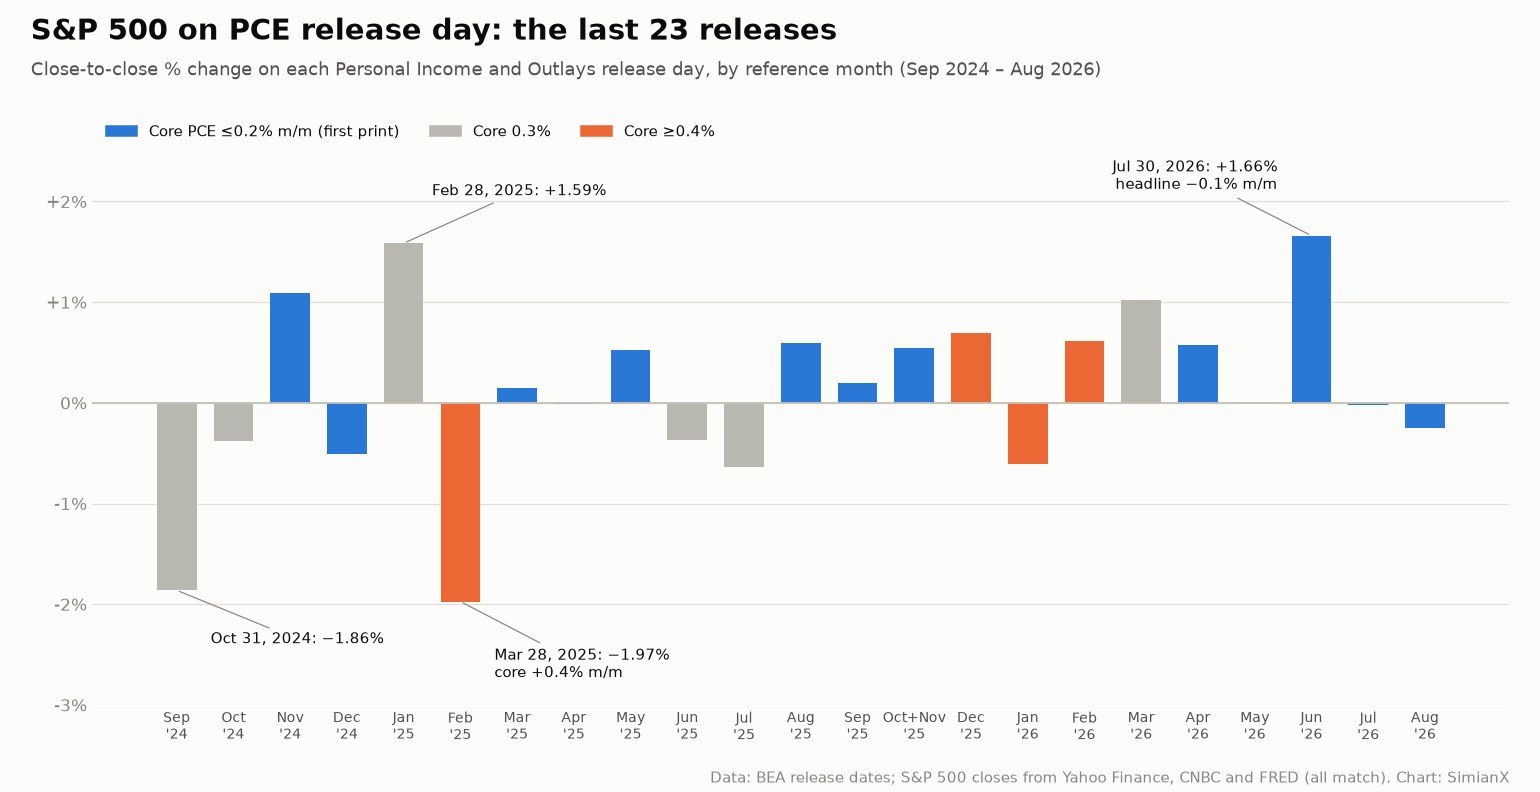
Over the 23 release days in the table, the S&P 500 rose 12 times and fell 11 times, and moved by an average of 0.69% in either direction — almost the same as the 0.67% average on all other trading days from October 2024 to October 2026. The 2-year Treasury yield moved by 2.7 basis points on average on PCE days, less than its 3.9-basis-point average on other days, compared with 4.5 basis points on CPI days and 7.1 basis points on jobs-report days over a similar period. The BEA builds much of the PCE index from CPI and producer price components that are published earlier in the month.
Six release days produced a stock move of 1% or more:
- March 28, 2025 (−1.97%). Core PCE rose 0.4% in February 2025, and the 2-year yield fell 8 basis points.
- October 31, 2024 (−1.86%). Headline 0.2% and core 0.3% in the month.
- July 30, 2026 (+1.66%). The PCE index fell 0.1% in June 2026, the only negative monthly reading in the table, as energy prices dropped 5.8%; the report came out with the advance estimate of second-quarter GDP.
- February 28, 2025 (+1.59%). Headline and core rose 0.3%; the 2-year yield fell 8 basis points.
- December 20, 2024 (+1.09%). Headline and core rose 0.1%, two days after the Fed's December 18, 2024 decision.
- April 30, 2026 (+1.02%). Headline rose 0.7% in March 2026 as energy prices rose 11.5% in the month (current data); the report came out with the advance estimate of first-quarter GDP.
On the four days with a 0.4% core reading, the S&P 500 fell on two and rose on two. Because every 2026 release has shared its morning with a GDP estimate, a PCE-day move rarely reflects the PCE figure alone. For crypto, see our US CPI vs crypto playbook.
How the 2025 shutdown delayed PCE releases
The lapse in federal appropriations from October 1 to November 12, 2025 pushed back six Personal Income and Outlays reports:
| Reference month | Originally scheduled | Published |
|---|---|---|
| September 2025 | October 31, 2025 | December 5, 2025 |
| October 2025 | November 26, 2025 | January 22, 2026 (combined with November) |
| November 2025 | December 19, 2025 | January 22, 2026 (combined with October) |
| December 2025 | January 29, 2026 | February 20, 2026 |
| January 2026 | February 26, 2026 | March 13, 2026 |
| February 2026 | March 27, 2026 | April 9, 2026 |
The schedule returned to normal with the March 2026 report on April 30, 2026. Each delay is stated in the BEA release for that month.
How to read a PCE report
- Headline versus core. Headline PCE is the Fed's target measure. Core PCE removes food and energy to show the trend; the BEA defines it on its core PCE FAQ page.
- Monthly versus annual. Both the monthly and 12-month changes in the release are based on seasonally adjusted data. A 0.2% monthly increase works out to about 2.4% a year if repeated; a monthly rate of about 0.17% compounds to roughly 2%.
- The unrounded figure. The BEA rounds to one decimal place. Markets compute the second decimal from the index levels — 0.31% headline and 0.25% core in August 2026.
- Spending and income. The same release reports consumer spending (+0.9% in August 2026) and the saving rate (4.1%), which describe the demand side of the economy.
- Revisions. Each release revises the previous months, and each year's annual update — on September 30 in 2026 — can revise several years of data.
- Real-time estimates. The Cleveland Fed's Inflation Nowcasting page publishes daily estimates of the current month's PCE inflation.
How this page is updated
How this page is updated: after every PCE release. On each release day we refresh the "Latest PCE report" box after the 8:30 a.m. ET publication, add the new month to the table of the last 24 reports (and drop the oldest), extend the PCE vs CPI table, record the S&P 500 and 2-year Treasury moves at the close, and roll the next release date forward. After each annual update we note the revisions, and when the BEA publishes the following year's schedule we extend the calendar. Last updated: October 16, 2026. The next update follows the September 2026 report on October 29.
Follow the next PCE report with SimianX
PCE mornings now arrive with a GDP estimate at the same minute, so the first market reaction mixes inflation and growth news. SimianX's Market Pulse ranks the headlines as they land, and the Live Command Room puts a team of AI agents on any ticker in real time — the broad market or rate-sensitive stocks such as JPM. Employment data is covered on our always-updated US jobs report page. Plans start free.
Frequently asked questions
When is the next PCE report?
The September 2026 PCE report will be released on Thursday, October 29, 2026, at 8:30 a.m. ET. The October 2026 report follows on Wednesday, November 25, 2026, and the November 2026 report on Wednesday, December 23, 2026.
What is the latest PCE inflation rate?
The PCE price index rose 3.4% in the 12 months to August 2026, according to the BEA release of September 30, 2026. Core PCE inflation was 3.0%.
What is core PCE?
Core PCE is the personal consumption expenditures price index excluding food and energy, whose prices swing with weather and oil markets. It is used to judge the underlying trend of inflation. It rose 3.0% over the 12 months to August 2026.
What is the difference between PCE and CPI?
Both measure consumer prices. The PCE index, from the BEA, covers a broader range of spending, including what employers and government programs pay on households' behalf, gives housing a smaller weight and uses a formula that reflects consumers switching between goods. The CPI, from the BLS, covers out-of-pocket spending by urban households and is released about two weeks earlier.
Why does the Fed use PCE instead of CPI?
The Fed defines its 2% inflation goal in terms of the PCE price index. It has measured the goal this way since adopting the target in January 2012. The PCE index covers more of household spending than the CPI, and its weights adjust as spending patterns change.
What time is the PCE report released?
The BEA publishes the Personal Income and Outlays report, which contains the PCE price index, at 8:30 a.m. Eastern Time. Since February 2026 it has come out on the same morning as a GDP estimate.
Is PCE higher than CPI right now?
For core inflation, yes. In August 2026 core PCE was 3.0% and core CPI 2.4%. Headline PCE and headline CPI were both 3.4%. Before late 2025, CPI usually ran higher.
Does the stock market react to the PCE report?
Less than to the CPI or the jobs report. Over the last 23 PCE release days the S&P 500 moved by an average of 0.69%, about the same as on other days, and the 2-year Treasury yield moved by 2.7 basis points on average.
Methodology and sources
- PCE figures come from each monthly BEA Personal Income and Outlays release, using the values first reported for the reference month. Every first-reported figure was cross-checked against the current BEA index levels published on FRED (series PCEPI and PCEPILFE); differences reflect later BEA revisions, chiefly the September 30, 2026 annual update. Energy and food price changes are computed from FRED series DNRGRG3M086SBEA and DFXARG3M086SBEA.
- Release dates are from each BEA release and the BEA release schedule for 2026 and 2027. FOMC dates are from the Federal Reserve's meeting calendar.
- CPI figures in the comparison table are the 12-month changes first reported in each BLS CPI release, as listed on our CPI page; CPI weights are BLS relative importance for December 2025.
- S&P 500 changes are close-to-close price changes on release day from Yahoo Finance, cross-checked against CNBC's index history and FRED; all three matched on every release day. "Other trading days" covers October 2024 to October 15, 2026, excluding release days.
- Treasury yields are U.S. Treasury daily par yields, change from the previous trading day, cross-checked against CNBC's 2-year yield history (same direction on 22 of 23 release days; on July 30, 2026 the two sources show +1 bp and −0.7 bp). Data compiled October 16, 2026. This page is for information only and is not investment advice.
Related Reading
- Fed Interest Rate Decision: Latest FOMC Result and History
- US CPI Report: Latest Inflation Data and Release Schedule
- US Jobs Report: Latest Nonfarm Payrolls and Release Schedule
- Yield Curve Inversions and US Recessions: A Reference Table
- FOMC Meeting Dates 2027: How the S&P 500 Moves on Fed Days
- Every Fed Rate-Hike Cycle Since 1983: S&P 500 & Chip Stocks
- Every Fed Rate-Cut Cycle Since 1980: Stocks, Bonds & Gold
- US CPI vs Crypto: 5%-Day Swings & Rate-Bet Playbook
- Fed and rates: all SimianX pages
References
- U.S. Bureau of Economic Analysis — Personal Income and Outlays, August 2026
- U.S. Bureau of Economic Analysis — PCE price index
- U.S. Bureau of Economic Analysis — Release schedule
- U.S. Bureau of Economic Analysis — Personal Income and Outlays, October and November 2025
- U.S. Bureau of Economic Analysis — Differences between the PCE price index and the CPI
- U.S. Bureau of Economic Analysis — What is the core PCE price index?
- Federal Reserve — Statement on Longer-Run Goals and Monetary Policy Strategy
- Federal Reserve — Why the Fed aims for 2 percent inflation
- Federal Reserve — Summary of Economic Projections, September 16, 2026
- Federal Reserve — FOMC meeting calendar
- Federal Reserve Bank of Dallas — Trimmed mean PCE inflation rate
- Federal Reserve Bank of Cleveland — Inflation Nowcasting
- FRED — PCE price index (PCEPI)
- FRED — Core PCE price index (PCEPILFE)
- U.S. Treasury — Daily Treasury par yield curve rates
- FRED — S&P 500 daily index (SP500)