
Thanksgiving Week Stock Market History: The S&P 500 Around the Holiday, 1950–2025
Updated October 2026. Data through Thanksgiving week 2025 and the December 31, 2025 close. This page will be updated after Thanksgiving week 2026, following the November 30, 2026 close.
Short answer: From 1950 to 2025 the S&P 500 rose in 53 of 76 Thanksgiving weeks, averaging +0.71%. The Wednesday before plus Black Friday rose 84% of the time. In 2026 the market is closed Thursday, November 26 and closes early, at 1:00 p.m. ET, on Friday, November 27.
This page measures the Thanksgiving week stock market for every year since 1950, using S&P 500 closing prices from two independent data vendors. It defines three windows explicitly — the full holiday week, the Wednesday-before-plus-Black-Friday pair, and the Monday after — then lists every year, the averages by decade, the best and worst weeks, and what December did next. It also answers the practical questions: whether the stock market is open on Black Friday, what time it closes, and the exact dates for 2026.
Thanksgiving 2026 stock market hours and dates
Thanksgiving falls on the fourth Thursday of November, so in 2026 it is Thursday, November 26. The dates below follow the official NYSE holiday calendar and Nasdaq's holiday schedule; the bond-market hours are SIFMA's recommended schedule.
| Day | Date | US stock market (NYSE and Nasdaq) | Role on this page |
|---|---|---|---|
| Friday | November 20, 2026 | Regular session, 9:30 a.m.–4:00 p.m. ET | Base close for the full week |
| Monday | November 23, 2026 | Regular session | Day 1 of Thanksgiving week |
| Tuesday | November 24, 2026 | Regular session | Base close for Wednesday + Black Friday |
| Wednesday | November 25, 2026 | Regular session | The day before Thanksgiving |
| Thursday | November 26, 2026 | Closed (Thanksgiving Day) | — |
| Friday | November 27, 2026 | Early close at 1:00 p.m. ET (1:15 p.m. for eligible options); SIFMA recommends a 2:00 p.m. ET bond-market close | Black Friday; end of both windows |
| Monday | November 30, 2026 | Regular session; last trading day of November | The Monday after ("Cyber Monday") |
The 2026 results will be added to every table on this page after the November 30, 2026 close. For reference, the NYSE calendar also lists Thanksgiving 2027 on Thursday, November 25 (closed) with an early close on Friday, November 26, 2027; the full 2027 schedule is in our stock market holidays 2027 calendar.
Is the stock market open on Black Friday?
Yes. The NYSE and Nasdaq are closed on Thanksgiving Day and open on Black Friday, but only until 1:00 p.m. ET. Both exchanges list November 27, 2026 as an early-close day, and NYSE adds that eligible options trade until 1:15 p.m. ET. The US bond market follows SIFMA's recommendation of a 2:00 p.m. ET close the same day.
Because the session lasts three and a half hours instead of six and a half, and many traders take the day off, Black Friday is one of the shortest trading days of the year. The name itself comes from retail: it was used by police in Philadelphia in the 1950s and 1960s to describe shopping crowds, and it became national in the 1980s, according to the history summarized by Wikipedia. It is unrelated to the Black Friday of 1869, a gold-market panic. The Monday after has its own nickname, "Cyber Monday," which the National Retail Federation's Ellen Davis introduced in a November 2005 press release (Wikipedia).
Three ways to measure Thanksgiving week
Headlines use "Thanksgiving week" loosely. This page uses three fixed windows, all measured on S&P 500 closing prices:
| Window | Starts at the close of | Ends at the close of | Trading sessions |
|---|---|---|---|
| Thanksgiving week | The Friday before Thanksgiving | Black Friday | 4 (Monday, Tuesday, Wednesday, Friday) |
| Wednesday + Black Friday | The Tuesday before Thanksgiving | Black Friday | 2 |
| Next Monday ("Cyber Monday") | Black Friday | The Monday after Thanksgiving | 1 |
The second window is the pairing popularized by the Stock Trader's Almanac, which has long tracked the day before and the day after Thanksgiving together. The third tests what happens once the holiday is over and a full trading week resumes.
Thanksgiving week stock market history: the key numbers
| S&P 500, 1950–2025 (76 years) | Sessions | Years up | Share up | Average | Median | Best | Worst |
|---|---|---|---|---|---|---|---|
| Thanksgiving week | 4 | 53 | 69.7% | +0.71% | +0.87% | +12.03% (2008) | −4.69% (2011) |
| Wednesday + Black Friday | 2 | 64 | 84.2% | +0.61% | +0.59% | +4.53% (2008) | −2.47% (2011) |
| Wednesday before Thanksgiving | 1 | 58 | 76.3% | +0.33% | +0.30% | +3.53% (2008) | −2.21% (2011) |
| Black Friday | 1 | 54 | 71.1% | +0.28% | +0.26% | +1.78% (1971) | −2.27% (2021) |
| Next Monday | 1 | 29 | 38.2% | −0.29% | −0.20% | +2.92% (2011) | −8.93% (2008) |
The comparison that gives these numbers meaning is an ordinary stretch of the same length. Over 1950–2025, any four consecutive sessions rose 56.5% of the time and averaged +0.15%; any two sessions rose 54.8% of the time (+0.07%); a single session rose 53.1% of the time (+0.04%).
| Ordinary periods, 1950–2025 | Share up | Average | Median |
|---|---|---|---|
| Any 4 consecutive sessions | 56.5% | +0.15% | +0.26% |
| Any 2 consecutive sessions | 54.8% | +0.07% | +0.11% |
| Any single session | 53.1% | +0.04% | +0.05% |
| Any Monday | 49.5% | −0.05% | 0.00% |
| Any Friday | 56.0% | +0.07% | +0.10% |
By that yardstick the Wednesday + Black Friday pair stands out most: it has been positive in 84% of years, against 55% for an ordinary two-session period, with an average more than eight times larger. The full week has been positive about 70% of the time against 57% for any four sessions. The Monday after is the exception — it has failed to rise in 47 of 76 years, more often than an ordinary Monday.
Day by day: from Monday to the Monday after
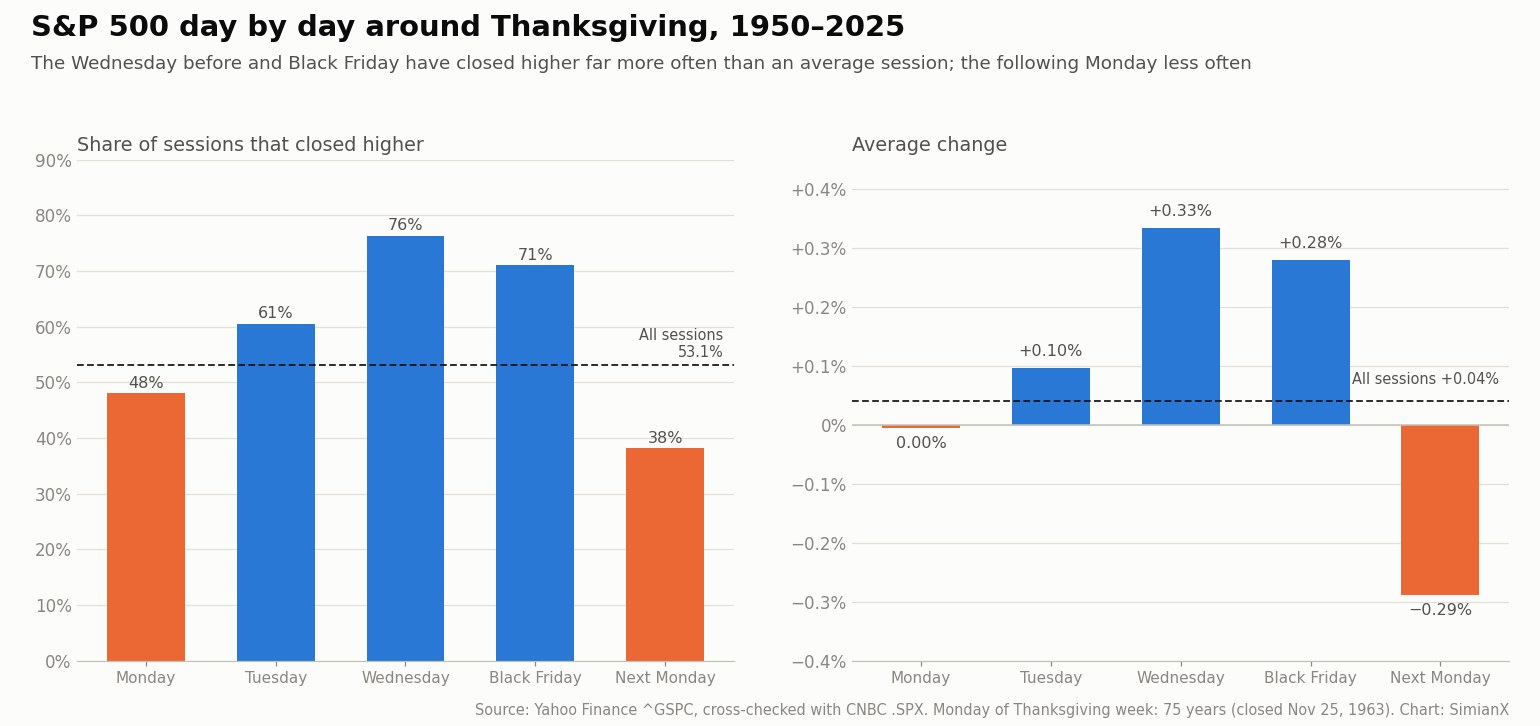
Split into single sessions, the pattern is concentrated around the holiday itself:
- Monday of Thanksgiving week: up 36 of 75 years (48.0%), average 0.00% — no different from an ordinary Monday. (The NYSE was closed on Monday, November 25, 1963, for President Kennedy's funeral.)
- Tuesday: up 46 of 76 (60.5%), average +0.10%.
- Wednesday before Thanksgiving: up 58 of 76 (76.3%), average +0.33%. Its best day was +3.53% in 2008 and its worst −2.21% in 2011.
- Black Friday: up 54 of 76 (71.1%), average +0.28%. Its best day was +1.78% in 1971; its worst −2.27% in 2021, on the day the World Health Organization named the Omicron coronavirus variant.
- The Monday after: up only 29 of 76 (38.2%), average −0.29%, including the largest move of any day in these windows, −8.93% on December 1, 2008.
Wednesday and Black Friday both closed higher in 41 of 76 years. Most of the week's average gain has come in those two sessions.
Every Thanksgiving week since 1950: the full table
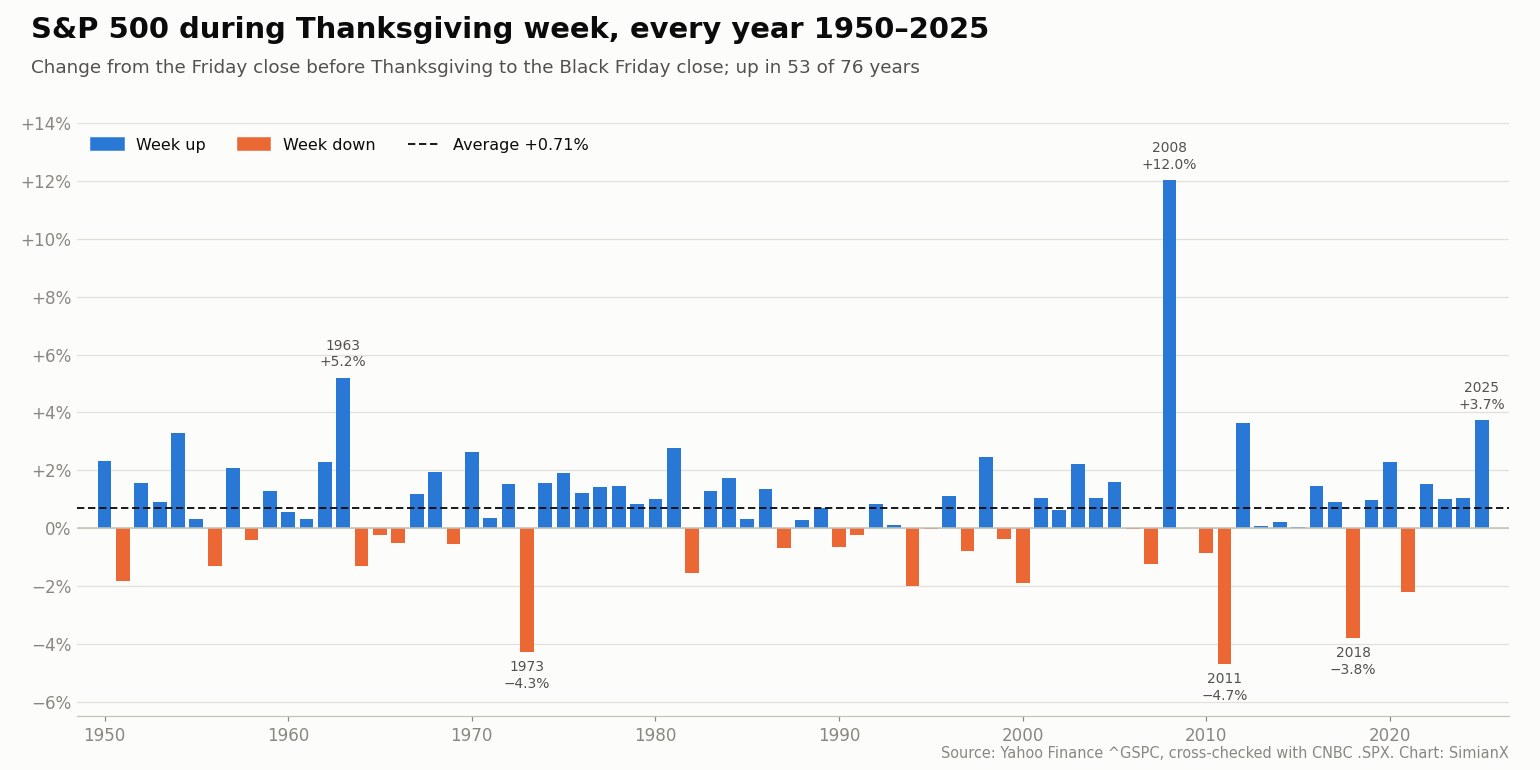
Newest first. Weeks in which the S&P 500 fell (Friday-to-Black-Friday change of zero or less) are in bold. "December" is the S&P 500's change from the last November close to the last December close of the same year.
| Year | Thanksgiving | Thanksgiving week (Fri to Fri) | Wednesday + Black Friday | Next Monday | December |
|---|---|---|---|---|---|
| 2025 | Nov 27 | +3.73% | +1.23% | −0.53% | −0.05% |
| 2024 | Nov 28 | +1.06% | +0.18% | +0.24% | −2.50% |
| 2023 | Nov 23 | +1.00% | +0.47% | −0.20% | +4.42% |
| 2022 | Nov 24 | +1.53% | +0.56% | −1.54% | −5.90% |
| 2021 | Nov 25 | −2.20% | −2.05% | +1.32% | +4.36% |
| 2020 | Nov 26 | +2.27% | +0.08% | −0.46% | +3.71% |
| 2019 | Nov 28 | +0.99% | +0.01% | −0.86% | +2.86% |
| 2018 | Nov 22 | −3.79% | −0.35% | +1.55% | −9.18% |
| 2017 | Nov 23 | +0.91% | +0.13% | −0.04% | +0.98% |
| 2016 | Nov 24 | +1.44% | +0.47% | −0.53% | +1.82% |
| 2015 | Nov 26 | +0.05% | +0.05% | −0.46% | −1.75% |
| 2014 | Nov 27 | +0.20% | +0.03% | −0.68% | −0.42% |
| 2013 | Nov 28 | +0.06% | +0.17% | −0.27% | +2.36% |
| 2012 | Nov 22 | +3.62% | +1.54% | −0.20% | +0.71% |
| 2011 | Nov 24 | −4.69% | −2.47% | +2.92% | +0.85% |
| 2010 | Nov 25 | −0.86% | +0.73% | −0.14% | +6.53% |
| 2009 | Nov 26 | +0.01% | −1.28% | +0.38% | +1.78% |
| 2008 | Nov 27 | +12.03% | +4.53% | −8.93% | +0.78% |
| 2007 | Nov 22 | −1.24% | +0.07% | −2.32% | −0.86% |
| 2006 | Nov 23 | −0.02% | −0.13% | −1.36% | +1.26% |
| 2005 | Nov 24 | +1.60% | +0.56% | −0.85% | −0.10% |
| 2004 | Nov 25 | +1.05% | +0.49% | −0.34% | +3.25% |
| 2003 | Nov 27 | +2.21% | +0.41% | +1.13% | +5.08% |
| 2002 | Nov 28 | +0.62% | +2.52% | −0.19% | −6.03% |
| 2001 | Nov 22 | +1.03% | +0.67% | +0.62% | +0.76% |
| 2000 | Nov 23 | −1.90% | −0.41% | +0.54% | +0.41% |
| 1999 | Nov 25 | −0.38% | +0.85% | −0.62% | +5.78% |
| 1998 | Nov 26 | +2.47% | +0.79% | −2.41% | +5.64% |
| 1997 | Nov 27 | −0.80% | +0.48% | +2.03% | +1.57% |
| 1996 | Nov 28 | +1.11% | +0.14% | −0.06% | −2.15% |
| 1995 | Nov 23 | −0.02% | −0.04% | +0.23% | +1.74% |
| 1994 | Nov 24 | −1.99% | +0.49% | +0.41% | +1.23% |
| 1993 | Nov 25 | +0.10% | +0.44% | −0.25% | +1.01% |
| 1992 | Nov 26 | +0.82% | +0.60% | +0.28% | +1.01% |
| 1991 | Nov 28 | −0.24% | −0.72% | +1.65% | +11.16% |
| 1990 | Nov 22 | −0.64% | −0.07% | +0.45% | +2.48% |
| 1989 | Nov 23 | +0.69% | +1.29% | +0.48% | +2.14% |
| 1988 | Nov 24 | +0.29% | +0.01% | +0.53% | +1.47% |
| 1987 | Nov 26 | −0.69% | −2.46% | −4.18% | +7.29% |
| 1986 | Nov 27 | +1.37% | +0.42% | −0.07% | −2.83% |
| 1985 | Nov 28 | +0.32% | +0.75% | −0.85% | +4.51% |
| 1984 | Nov 22 | +1.72% | +1.67% | −0.82% | +2.24% |
| 1983 | Nov 24 | +1.27% | +0.20% | −0.38% | −0.88% |
| 1982 | Nov 25 | −1.56% | +1.47% | −0.50% | +1.52% |
| 1981 | Nov 26 | +2.78% | +1.28% | +1.01% | −3.01% |
| 1980 | Nov 27 | +1.01% | +0.85% | −2.36% | −3.39% |
| 1979 | Nov 22 | +0.85% | +0.95% | +2.03% | +1.68% |
| 1978 | Nov 23 | +1.45% | +0.82% | +0.21% | +1.49% |
| 1977 | Nov 24 | +1.43% | +0.62% | −0.67% | +0.28% |
| 1976 | Nov 25 | +1.21% | +1.17% | −0.69% | +5.25% |
| 1975 | Nov 27 | +1.91% | +0.58% | −0.62% | −1.15% |
| 1974 | Nov 28 | +1.55% | +0.72% | −2.66% | −2.02% |
| 1973 | Nov 22 | −4.27% | +0.79% | −2.88% | +1.66% |
| 1972 | Nov 23 | +1.54% | +0.91% | −0.47% | +1.18% |
| 1971 | Nov 25 | +0.36% | +1.97% | +1.60% | +8.62% |
| 1970 | Nov 26 | +2.64% | +1.36% | +1.48% | +5.68% |
| 1969³ | Nov 27 | −0.54% | +0.94% | −0.63% | −1.87% |
| 1968² | Nov 28 | +1.95% | +1.03% | −0.23% | −4.16% |
| 1967 | Nov 23 | +1.16% | +0.86% | +0.29% | +2.63% |
| 1966 | Nov 24 | −0.50% | +1.48% | −0.17% | −0.15% |
| 1965 | Nov 25 | −0.23% | +0.27% | −0.25% | +0.90% |
| 1964 | Nov 26 | −1.30% | −0.66% | −0.87% | +0.39% |
| 1963¹ | Nov 28 | +5.20% | +1.17% | +0.59% | +2.44% |
| 1962 | Nov 22 | +2.29% | +1.80% | −0.29% | +1.35% |
| 1961 | Nov 23 | +0.31% | +0.08% | +0.01% | +0.32% |
| 1960 | Nov 24 | +0.56% | +0.74% | −0.18% | +4.63% |
| 1959 | Nov 26 | +1.28% | +0.61% | +1.01% | +2.76% |
| 1958 | Nov 27 | −0.42% | +2.86% | +0.40% | +5.20% |
| 1957 | Nov 28 | +2.08% | +4.07% | −0.86% | −4.15% |
| 1956 | Nov 22 | −1.31% | +0.56% | −0.60% | +3.53% |
| 1955 | Nov 24 | +0.31% | +0.04% | −0.66% | −0.07% |
| 1954 | Nov 25 | +3.29% | +1.53% | −0.03% | +5.08% |
| 1953 | Nov 26 | +0.90% | +0.65% | +0.41% | +0.20% |
| 1952 | Nov 27 | +1.54% | +1.18% | +0.08% | +3.55% |
| 1951 | Nov 22 | −1.84% | −1.23% | +0.13% | +3.89% |
| 1950 | Nov 23 | +2.32% | +2.21% | −0.69% | +4.72% |
¹ 1963: Monday, November 25 was a market holiday for President Kennedy's funeral, so Thanksgiving week had three sessions. ² 1968: the NYSE closed on Wednesdays from June to December 1968 to clear a paperwork backlog, but it opened on Wednesday, November 27 because Thursday was a holiday. ³ 1969: CNBC has no bar for Monday, December 1, 1969; that day's close (93.22) is from Yahoo Finance only. Until 1952 the NYSE also traded on some Saturdays; counting the Saturday sessions, the 1950 week would show +1.80% instead of +2.32% and the 1951 week −1.93% instead of −1.84% (the Next Monday figures would be −0.49% and +0.58%). No sign changes in any window.
Thanksgiving week by decade
| Decade | Thanksgiving week: years up | Average | Wednesday + Black Friday: years up | Average | Next Monday: years up | Average |
|---|---|---|---|---|---|---|
| 1950s | 7 of 10 | +0.81% | 9 of 10 | +1.25% | 5 of 10 | −0.08% |
| 1960s | 6 of 10 | +0.89% | 9 of 10 | +0.77% | 3 of 10 | −0.17% |
| 1970s | 9 of 10 | +0.87% | 10 of 10 | +0.99% | 4 of 10 | −0.27% |
| 1980s | 8 of 10 | +0.72% | 9 of 10 | +0.55% | 3 of 10 | −0.71% |
| 1990s | 4 of 10 | +0.04% | 7 of 10 | +0.30% | 6 of 10 | +0.17% |
| 2000s | 7 of 10 | +1.54% | 7 of 10 | +0.74% | 4 of 10 | −1.13% |
| 2010s | 7 of 10 | −0.21% | 8 of 10 | +0.03% | 2 of 10 | +0.13% |
| 2020–2025 | 5 of 6 | +1.23% | 5 of 6 | +0.08% | 2 of 6 | −0.19% |
The Wednesday + Black Friday pair rose in every year from 1965 to 1986 — 22 years in a row — and averaged +0.77% from 1950 to 1999. Since 2000 its hit rate has fallen to 77% (20 of 26) and its average to +0.32%, while the full week has held up: 19 of 26 weeks since 2000 rose (73%), averaging +0.80%. In the ten years from 2016 to 2025, eight Thanksgiving weeks rose, including the last four (2022–2025). The 2000s average is lifted by a single year, 2008.
The best and worst Thanksgiving weeks
| Rank | Best weeks | S&P 500 change | Worst weeks | S&P 500 change |
|---|---|---|---|---|
| 1 | 2008 | +12.03% | 2011 | −4.69% |
| 2 | 1963 | +5.20% | 1973 | −4.27% |
| 3 | 2025 | +3.73% | 2018 | −3.79% |
| 4 | 2012 | +3.62% | 2021 | −2.20% |
| 5 | 1954 | +3.29% | 1994 | −1.99% |
| 6 | 1981 | +2.78% | 2000 | −1.90% |
- 2008 (+12.03%). The week began the day after the US government announced a rescue package for Citigroup on November 23, 2008, during the financial crisis. The gain was followed by a −8.93% Monday on December 1, 2008, the day the National Bureau of Economic Research announced that a recession had begun in December 2007.
- 1963 (+5.20%). The week after President Kennedy's assassination on Friday, November 22; the market closed for the funeral on Monday, then gained 3.98% on Tuesday, November 26.
- 2011 (−4.69%) and 1973 (−4.27%). Both fell during broader declines: the 1973 week came during the 1973–74 bear market (listed in every S&P 500 bear market since 1929).
- 2018 (−3.79%). The week fell inside the fourth-quarter 2018 decline; December 2018 then lost 9.18%, the worst December in this table.
Large weeks in either direction have mostly come during periods of market stress, when every session moved more than usual. In 30 of the 76 years, the week moved less than 1% in either direction.
The Monday after Thanksgiving ("Cyber Monday")
The session after Black Friday has been the weakest part of the holiday period. From 1950 to 2025 it rose in 29 of 76 years (38.2%), averaged −0.29% and had a median of −0.20%. Since 2000 it has risen in only 8 of 26 years (31%). Its largest declines came in 2008 (−8.93%), 1987 (−4.18%), 1973 (−2.88%), 1974 (−2.66%) and 1998 (−2.41%); its largest gains in 2011 (+2.92%), 1979 and 1997 (+2.03% each).
A positive Black Friday did not carry over: after an up Black Friday the next Monday rose 37% of the time, after a down Black Friday 41%. One explanation offered for the weakness is that the holiday sessions run on thin volume, so a return to full participation on Monday can undo part of the move. In 2026 the Monday after Thanksgiving, November 30, is also the last trading day of November.
Does Thanksgiving week predict December?
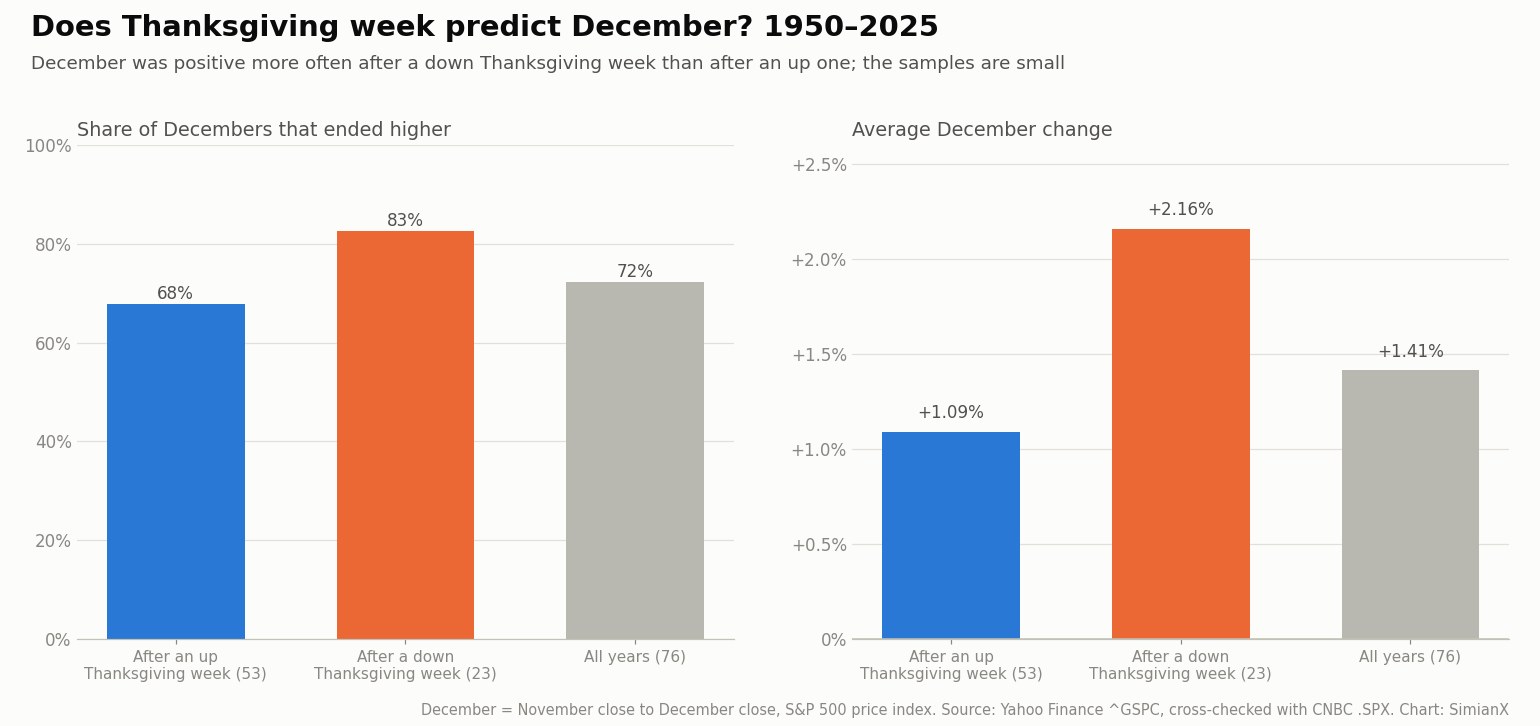
| After the holiday week… | Years | December up | Average December | Black Friday close to year-end: up | Average |
|---|---|---|---|---|---|
| Thanksgiving week up | 53 | 36 (68%) | +1.09% | 33 (62%) | +0.99% |
| Thanksgiving week down | 23 | 19 (83%) | +2.16% | 17 (74%) | +2.50% |
| All years | 76 | 55 (72%) | +1.41% | 50 (66%) | +1.45% |
December has been one of the stronger months for the S&P 500 (see our S&P 500 seasonality study), and the holiday week has not reliably signalled which way it would go. If anything the relationship has run backwards: after the 23 down Thanksgiving weeks, December rose 19 times and averaged +2.16%, compared with 36 of 53 and +1.09% after up weeks. After the 12 years when the Wednesday + Black Friday pair fell, December rose 11 times. With samples this small, a single year moves the averages — 1987, a down Thanksgiving week followed by a 7.29% December gain, is one of them — so the reverse pattern is better read as "no signal" than as a rule.
The end of December has its own pattern, covered in our Santa Claus rally history: the last five trading days of the year and the first two of January, a window that begins on December 24 in 2026.
Why the holiday week has tended to rise
There is no single accepted explanation. The ones most often cited are:
- Light volume and fewer sellers. Many institutional traders are away on Wednesday and Friday, and a modest amount of buying can move prices in thin trading.
- Holiday optimism and consumer headlines. Black Friday and Cyber Monday sales figures dominate the news, and retail-spending stories are usually framed around record totals.
- Seasonal flows. The holiday falls at the start of the November–January stretch, which has had the highest average three-month return for the S&P 500 since 1950 (+4.4%, by our calculation from the same daily data).
- Positioning before December. Some investors add exposure ahead of year-end, when portfolio rebalancing and tax decisions concentrate.
None of these explains the weakness of the following Monday or the smaller Wednesday + Black Friday edge since 2000. A pattern that is published every year is easy to anticipate, which tends to shrink it.
How to use Thanksgiving week data
The holiday week has a historical edge of about half a percentage point over an ordinary four-session period, a 30% failure rate, and a weaker following Monday. It describes the past behaviour of the index, not a trading signal. A practical way to use it is as context: a quiet, rising holiday week is in line with history, a falling one has happened in 23 of 76 years, and neither has said much about December.
If you follow the market around the holiday, SimianX's live multi-agent analysis can run on SPY, the S&P 500 ETF, and Market Pulse scores the news that moves the index during the short sessions. Calendar-year results are in our S&P 500 returns by year table and the Nasdaq equivalent in our Nasdaq returns by year table. All of our market-history reference pages are collected on the market history topic hub.
Frequently asked questions
Is the stock market open on Black Friday?
Yes, with an early close. On Black Friday, November 27, 2026, the NYSE and Nasdaq close at 1:00 p.m. ET (1:15 p.m. for eligible options), and SIFMA recommends a 2:00 p.m. ET close for the bond market. The market is closed on Thanksgiving Day, Thursday, November 26.
Is the stock market open on Thanksgiving?
No. Thanksgiving Day is a full market holiday for the NYSE and Nasdaq. In 2026 that is Thursday, November 26; in 2027 it is Thursday, November 25.
Does the stock market go up during Thanksgiving week?
Usually, but not always. From 1950 to 2025 the S&P 500 rose from the Friday before Thanksgiving to Black Friday in 53 of 76 years (69.7%), with an average gain of 0.71% and a median of 0.87%. It fell in 23 years, most recently in 2021.
How does the stock market do on Black Friday?
The S&P 500 rose on Black Friday in 54 of 76 years from 1950 to 2025, with an average gain of 0.28%. The best Black Friday was +1.78% in 1971 and the worst −2.27% in 2021.
What is the Thanksgiving trade in stocks?
It refers to the Wednesday before and the Friday after Thanksgiving taken together, a pairing tracked by the Stock Trader's Almanac. Measured from the Tuesday close to the Black Friday close, the S&P 500 rose in 64 of 76 years (84.2%) from 1950 to 2025, averaging +0.61%.
How does the stock market do on the Monday after Thanksgiving?
It has been weaker than average. The S&P 500 rose on the Monday after Thanksgiving in only 29 of 76 years (38.2%), with an average change of −0.29%. The worst was −8.93% on December 1, 2008.
Does a good Thanksgiving week mean a good December?
Not on the evidence. December rose in 68% of years after an up Thanksgiving week and in 83% after a down one, with average gains of 1.09% and 2.16%. The samples are small, so neither figure is a forecast.
What time does the stock market close the day after Thanksgiving?
At 1:00 p.m. ET for NYSE and Nasdaq stocks. The NYSE calendar lists the same early close for Friday, November 27, 2026, Friday, November 26, 2027 and Friday, November 24, 2028.
Methodology and sources
- Prices. S&P 500 daily closes (price index, dividends excluded) from Yahoo Finance (^GSPC), cross-checked against CNBC's independent index history (.SPX). Every window date matched in both sources except Monday, December 1, 1969 (footnoted); one other daily close, November 24, 1958, differs between the vendors and affects no window figure.
- Windows. Thanksgiving week = Friday close before Thanksgiving to Black Friday close; Wednesday + Black Friday = Tuesday close to Black Friday close; Next Monday = Black Friday close to the following Monday close. Thanksgiving is the fourth Thursday of November, as fixed by federal law since 1942.
- December = last November close to last December close of the same year. Black Friday close to year-end = Black Friday close to the last December close.
- Comparison base. All rolling one-, two- and four-session periods, all Mondays and all Fridays from January 1950 to December 2025.
- Calendar. 2026–2028 holiday and early-close dates from the NYSE and Nasdaq published calendars; bond-market hours from SIFMA's recommendations.
- Data compiled October 16, 2026. This page is for information only and is not investment advice.
Related Reading
- Santa Claus Rally: Every Year Since 1950 and What Came Next
- Stock Market Holidays 2027: NYSE & Nasdaq Closed Dates
- S&P 500 Seasonality: The Best & Worst Months 1950–2026
- S&P 500 Returns by Year: Every Year 1928–2026 Table
- Nasdaq Returns by Year: Every Year 1972–2026 Table
- The 20 Worst Days in S&P 500 History and What Came Next
- Market history: all SimianX reference pages
References
- NYSE — Holidays and trading hours
- Nasdaq — Stock market holiday schedule
- SIFMA — Holiday schedule recommendations
- Stock Trader's Almanac — Seasonal patterns
- Yahoo Finance — S&P 500 (^GSPC) historical data
- CNBC — S&P 500 index (.SPX)
- NBER — US business cycle dating
- Wikipedia — Black Friday (shopping)
- Wikipedia — Cyber Monday