
Santa Claus Rally History: 76 Years of S&P 500 Data, 1950–2025
Updated October 2026. Data through the window that ended January 5, 2026, and the October 15, 2026 close. This page will be updated after the 2026–27 window closes on January 5, 2027.
Short answer: The Santa Claus rally is the S&P 500's move over the last five trading days of December plus the first two of January. From 1950 to 2025 it was positive in 58 of 76 years, averaging +1.2%. It failed in 2023, 2024 and 2025. The 2026 window runs December 24, 2026 – January 5, 2027.
The Santa Claus rally is one of the most quoted calendar patterns on Wall Street, and one of the easiest to test. This page measures it the way its originator defined it, for every year since 1950, using S&P 500 closing prices from two independent data vendors. It lists every window, the January and the full year that followed, and what happened after the 18 years when the rally did not show up, including the three consecutive misses of 2023, 2024 and 2025.
Santa Claus rally 2026 dates
The 2026–27 window is seven trading sessions long and contains one half day. Because Christmas Day 2026 and New Year's Day 2027 both fall on a Friday, the window spans two long weekends. Dates follow the official NYSE holiday calendar, also listed in our stock market holidays 2027 calendar.
| Window day | Date | NYSE session |
|---|---|---|
| Starting point (close) | Wednesday, December 23, 2026 | Regular session; its close is the base for the calculation |
| Day 1 | Thursday, December 24, 2026 | Early close, 1:00 p.m. ET |
| — | Friday, December 25, 2026 | Closed (Christmas Day) |
| Day 2 | Monday, December 28, 2026 | Regular session |
| Day 3 | Tuesday, December 29, 2026 | Regular session |
| Day 4 | Wednesday, December 30, 2026 | Regular session |
| Day 5 | Thursday, December 31, 2026 | Regular full session |
| — | Friday, January 1, 2027 | Closed (New Year's Day) |
| Day 6 | Monday, January 4, 2027 | Regular session |
| Day 7 | Tuesday, January 5, 2027 | Regular session; the window ends at this close |
The 2026–27 Santa Claus rally is therefore the S&P 500's percentage change from the December 23, 2026 close to the January 5, 2027 close. This page will add the result to every table below after that close.
What the Santa Claus rally is
Yale Hirsch, the founder of the Stock Trader's Almanac, first described the pattern in the 1972 edition of the Almanac. His definition is specific: the last five trading days of December and the first two trading days of January, seven sessions in all. It is not the whole month of December, not the week before Christmas, and not "the holiday season" in general — a distinction that matters, because many headlines in December use the phrase for any rise in stocks.
Measured precisely, the window starts at the close of the trading day before the first of those seven sessions and ends at the close of the seventh. In 2025–26, for example, the starting close was Tuesday, December 23, 2025 (6,909.79) and the window ended at the close on Monday, January 5, 2026 (6,902.05), a change of −0.11%.
Hirsch paired the definition with a rhyme that is still repeated every December: "If Santa Claus should fail to call, bears may come to Broad and Wall." Broad Street and Wall Street meet at the New York Stock Exchange. The line claims that a missing rally is a warning for the months ahead. The sections below test both halves of the idea — the rally itself, and the warning.
Santa Claus rally history: the key numbers, 1950–2025
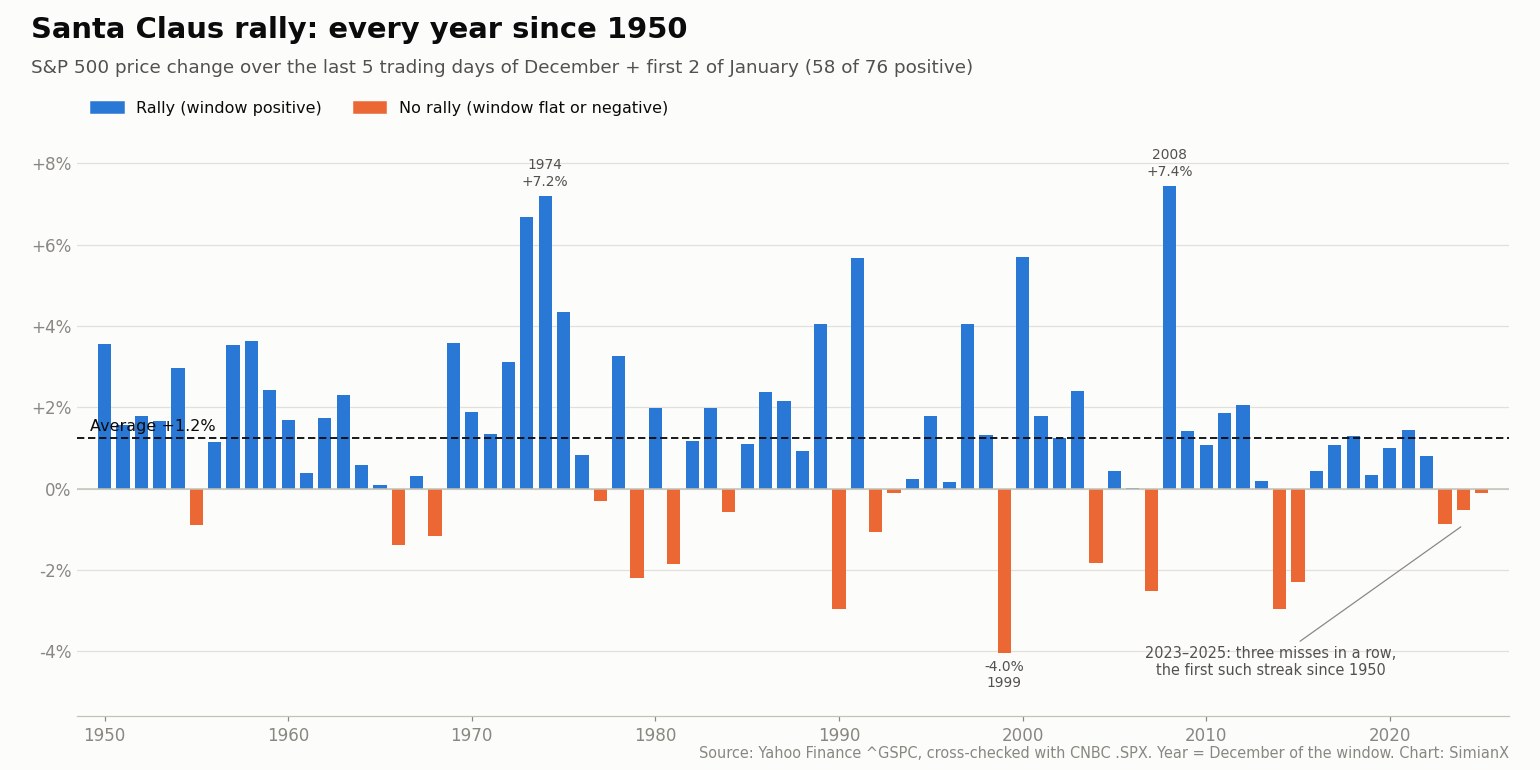
Across 76 windows, the S&P 500 rose in 58 (76.3%) and fell or finished flat in 18 (23.7%). The average window return was +1.25% and the median +1.21%. The Stock Trader's Almanac reports the same orders of magnitude for its own calculation: an average of about 1.3% and a 76% success rate since 1950.
The comparison that gives those numbers meaning is an ordinary seven-session stretch. Over the same 1950–2025 period, all rolling seven-trading-day periods averaged +0.25% and were positive 57.9% of the time.
| Measure, S&P 500 price change | Santa Claus rally windows | Any 7-trading-day period |
|---|---|---|
| Number of observations | 76 | 18,887 |
| Share positive | 76.3% | 57.9% |
| Average change | +1.25% | +0.25% |
| Median change | +1.21% | +0.40% |
| Average when positive | +2.11% | — |
| Average when negative | −1.54% | — |
| Best | +7.45% (2008–09) | — |
| Worst | −4.04% (1999–2000) | — |
By this measure the window has, on average, delivered about five times the return of a typical seven-day period. The five largest rallies came in 2008 (+7.45%), 1974 (+7.20%), 1973 (+6.69%), 2000 (+5.70%) and 1991 (+5.68%). Four of the five came during or shortly after a bear market, when the index had further to rebound — compare the dates with our list of every S&P 500 bear market since 1929. The five weakest were 1999 (−4.04%), 1990 (−2.97%), 2014 (−2.96%), 2007 (−2.51%) and 2015 (−2.30%).
Every Santa Claus rally since 1950: the full table
Each row is labelled by the December in which the window began. "Following January" is the S&P 500's change for the whole of the next January (December 31 close to January 31 close). "Following year" is the next calendar year's price return. Failed windows are in bold.
| Year | Window (first day – last day) | S&P 500 change | Following January | Following year |
|---|---|---|---|---|
| 1950 | Dec 22 – Jan 3, 1951 | +3.6% | +6.0% | +16.3% |
| 1951 | Dec 24 – Jan 3, 1952 | +1.6% | +1.6% | +11.8% |
| 1952 | Dec 24 – Jan 5, 1953 | +1.8% | −0.7% | −6.6% |
| 1953 | Dec 24 – Jan 5, 1954 | +1.7% | +5.1% | +45.0% |
| 1954 | Dec 27 – Jan 4, 1955 | +3.0% | +1.8% | +26.4% |
| 1955 | Dec 23 – Jan 4, 1956 | −0.9% | −3.6% | +2.6% |
| 1956 | Dec 21 – Jan 3, 1957 | +1.2% | −4.2% | −14.3% |
| 1957 | Dec 24 – Jan 3, 1958 | +3.5% | +4.3% | +38.1% |
| 1958 | Dec 23 – Jan 5, 1959 | +3.6% | +0.4% | +8.5% |
| 1959 | Dec 24 – Jan 5, 1960 | +2.4% | −7.1% | −3.0% |
| 1960 | Dec 23 – Jan 4, 1961 | +1.7% | +6.3% | +23.1% |
| 1961 | Dec 22 – Jan 3, 1962 | +0.4% | −3.8% | −11.8% |
| 1962 | Dec 24 – Jan 3, 1963 | +1.7% | +4.9% | +18.9% |
| 1963 | Dec 24 – Jan 3, 1964 | +2.3% | +2.7% | +13.0% |
| 1964 | Dec 24 – Jan 5, 1965 | +0.6% | +3.3% | +9.1% |
| 1965 | Dec 27 – Jan 4, 1966 | +0.1% | +0.5% | −13.1% |
| 1966 | Dec 23 – Jan 4, 1967 | −1.4% | +7.8% | +20.1% |
| 1967 | Dec 22 – Jan 3, 1968 | +0.3% | −4.4% | +7.7% |
| 1968 | Dec 24 – Jan 3, 1969 | −1.2% | −0.8% | −11.4% |
| 1969 | Dec 24 – Jan 5, 1970 | +3.6% | −7.6% | +0.1% |
| 1970 | Dec 24 – Jan 5, 1971 | +1.9% | +4.0% | +10.8% |
| 1971 | Dec 27 – Jan 4, 1972 | +1.3% | +1.8% | +15.6% |
| 1972 | Dec 21 – Jan 3, 1973 | +3.1% | −1.7% | −17.4% |
| 1973 | Dec 24 – Jan 3, 1974 | +6.7% | −1.0% | −29.7% |
| 1974 | Dec 24 – Jan 3, 1975 | +7.2% | +12.3% | +31.5% |
| 1975 | Dec 24 – Jan 5, 1976 | +4.3% | +11.8% | +19.1% |
| 1976 | Dec 27 – Jan 4, 1977 | +0.8% | −5.1% | −11.5% |
| 1977 | Dec 23 – Jan 4, 1978 | −0.3% | −6.2% | +1.1% |
| 1978 | Dec 22 – Jan 3, 1979 | +3.3% | +4.0% | +12.3% |
| 1979 | Dec 24 – Jan 3, 1980 | −2.2% | +5.8% | +25.8% |
| 1980 | Dec 24 – Jan 5, 1981 | +2.0% | −4.6% | −9.7% |
| 1981 | Dec 24 – Jan 5, 1982 | −1.8% | −1.8% | +14.8% |
| 1982 | Dec 27 – Jan 4, 1983 | +1.2% | +3.3% | +17.3% |
| 1983 | Dec 23 – Jan 4, 1984 | +2.0%¹ | −0.9% | +1.4% |
| 1984 | Dec 24 – Jan 3, 1985 | −0.6% | +7.4% | +26.3% |
| 1985 | Dec 24 – Jan 3, 1986 | +1.1% | +0.2% | +14.6% |
| 1986 | Dec 24 – Jan 5, 1987 | +2.4% | +13.2% | +2.0% |
| 1987 | Dec 24 – Jan 5, 1988 | +2.2% | +4.0% | +12.4% |
| 1988 | Dec 23 – Jan 4, 1989 | +0.9% | +7.1% | +27.3% |
| 1989 | Dec 22 – Jan 3, 1990 | +4.1% | −6.9% | −6.6% |
| 1990 | Dec 24 – Jan 3, 1991 | −3.0% | +4.2% | +26.3% |
| 1991 | Dec 24 – Jan 3, 1992 | +5.7% | −2.0% | +4.5% |
| 1992 | Dec 24 – Jan 5, 1993 | −1.1% | +0.7% | +7.1% |
| 1993 | Dec 27 – Jan 4, 1994 | −0.1% | +3.3% | −1.5% |
| 1994 | Dec 23 – Jan 4, 1995 | +0.2% | +2.4% | +34.1% |
| 1995 | Dec 22 – Jan 3, 1996 | +1.8% | +3.3% | +20.3% |
| 1996 | Dec 24 – Jan 3, 1997 | +0.1% | +6.1% | +31.0% |
| 1997 | Dec 24 – Jan 5, 1998 | +4.0% | +1.0% | +26.7% |
| 1998 | Dec 24 – Jan 5, 1999 | +1.3% | +4.1% | +19.5% |
| 1999 | Dec 27 – Jan 4, 2000 | −4.0% | −5.1% | −10.1% |
| 2000 | Dec 22 – Jan 3, 2001 | +5.7% | +3.5% | −13.0% |
| 2001 | Dec 24 – Jan 3, 2002 | +1.8% | −1.6% | −23.4% |
| 2002 | Dec 24 – Jan 3, 2003 | +1.2% | −2.7% | +26.4% |
| 2003 | Dec 24 – Jan 5, 2004 | +2.4% | +1.7% | +9.0% |
| 2004 | Dec 27 – Jan 4, 2005 | −1.8% | −2.5% | +3.0% |
| 2005 | Dec 23 – Jan 4, 2006 | +0.4% | +2.5% | +13.6% |
| 2006 | Dec 22 – Jan 4, 2007 | +0.003% | +1.4% | +3.5% |
| 2007 | Dec 24 – Jan 3, 2008 | −2.5% | −6.1% | −38.5% |
| 2008 | Dec 24 – Jan 5, 2009 | +7.4% | −8.6% | +23.5% |
| 2009 | Dec 24 – Jan 5, 2010 | +1.4% | −3.7% | +12.8% |
| 2010 | Dec 27 – Jan 4, 2011 | +1.1% | +2.3% | −0.003% |
| 2011 | Dec 23 – Jan 4, 2012 | +1.9% | +4.4% | +13.4% |
| 2012 | Dec 24 – Jan 3, 2013 | +2.0% | +5.0% | +29.6% |
| 2013 | Dec 24 – Jan 3, 2014 | +0.2% | −3.6% | +11.4% |
| 2014 | Dec 24 – Jan 5, 2015 | −3.0% | −3.1% | −0.7% |
| 2015 | Dec 24 – Jan 5, 2016 | −2.3% | −5.1% | +9.5% |
| 2016 | Dec 23 – Jan 4, 2017 | +0.4% | +1.8% | +19.4% |
| 2017 | Dec 22 – Jan 3, 2018 | +1.1% | +5.6% | −6.2% |
| 2018 | Dec 24 – Jan 3, 2019 | +1.3% | +7.9% | +28.9% |
| 2019 | Dec 24 – Jan 3, 2020 | +0.3% | −0.2% | +16.3% |
| 2020 | Dec 24 – Jan 5, 2021 | +1.0% | −1.1% | +26.9% |
| 2021 | Dec 27 – Jan 4, 2022 | +1.4% | −5.3% | −19.4% |
| 2022 | Dec 23 – Jan 4, 2023 | +0.8% | +6.2% | +24.2% |
| 2023 | Dec 22 – Jan 3, 2024 | −0.9% | +1.6% | +23.3% |
| 2024 | Dec 24 – Jan 3, 2025 | −0.5% | +2.7% | +16.4% |
| 2025 | Dec 24 – Jan 5, 2026 | −0.1% | +1.4% | +13.1% YTD² |
¹ The two vendors disagree on the December 22, 1983 close (163.53 vs. 163.27), giving +2.0% or +2.2%; both are positive. ² 2026 price return through the October 15, 2026 close. 2006 rose by 0.003% and is counted as positive; 2011 fell by 0.003%. Until 1952 the NYSE also traded on some Saturdays; counting those sessions, the 1950 and 1951 windows would show +3.1% and +1.4% instead of +3.6% and +1.6%.
The Santa Claus rally by decade
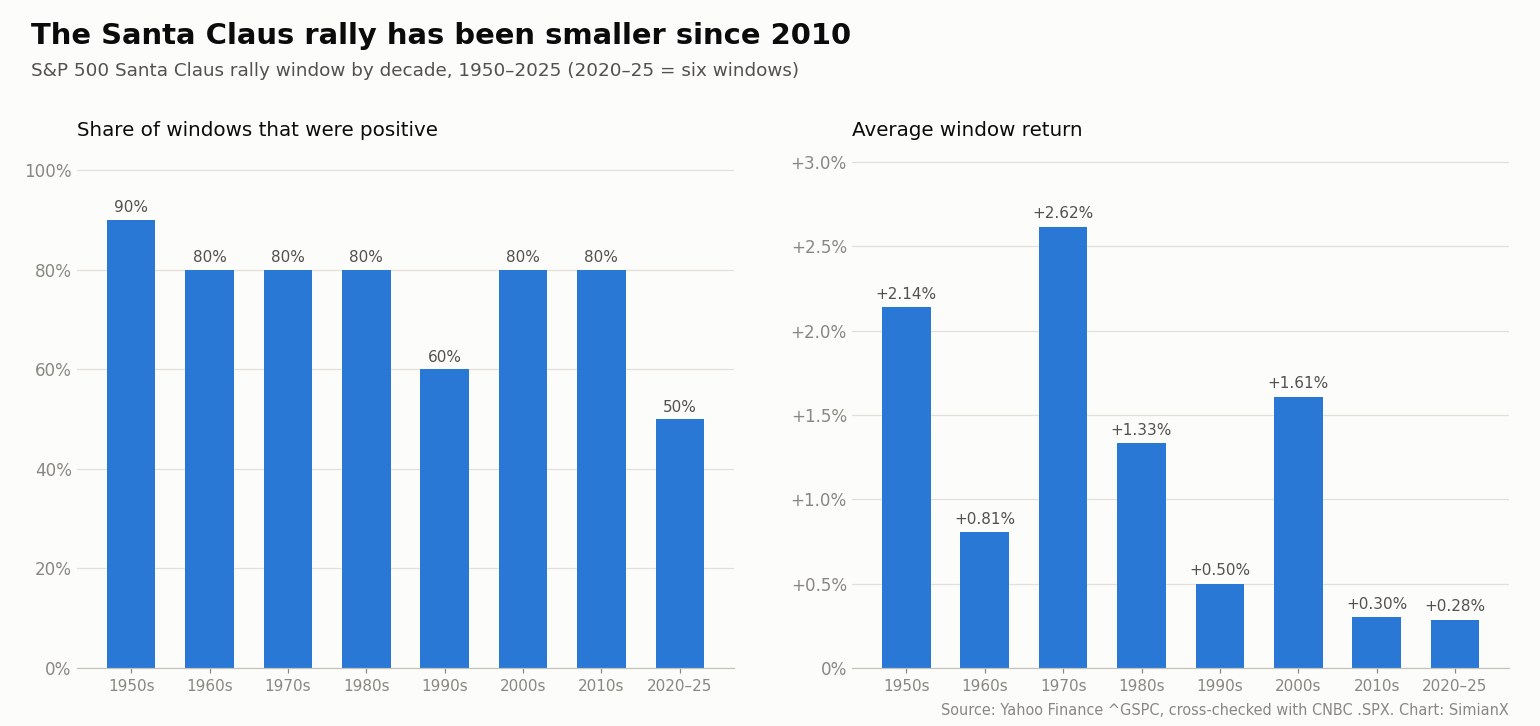
The pattern has not been stable. The average window return was above +2% in the 1950s and 1970s and has been close to +0.3% since 2010.
| Decade | Windows | Positive | Average | Median |
|---|---|---|---|---|
| 1950s | 10 | 9 | +2.14% | +2.11% |
| 1960s | 10 | 8 | +0.81% | +0.48% |
| 1970s | 10 | 8 | +2.62% | +2.50% |
| 1980s | 10 | 8 | +1.33% | +1.57% |
| 1990s | 10 | 6 | +0.50% | +0.19% |
| 2000s | 10 | 8 | +1.61% | +1.34% |
| 2010s | 10 | 8 | +0.30% | +0.75% |
| 2020–2025 | 6 | 3 | +0.28% | +0.34% |
Split in two, the 60 windows from 1950 to 2009 averaged +1.50% with 47 positive (78%); the 16 windows from 2010 to 2025 averaged +0.30% with 11 positive (69%). The hit rate has fallen less than the size of the move. A pattern that is published every year in the financial press is easy to anticipate, and buying ahead of a well-known window tends to pull its gains forward into mid-December. The same decay is visible in other published anomalies, such as the January effect covered in our S&P 500 seasonality study.
"If Santa Claus should fail to call": what came after the 18 misses
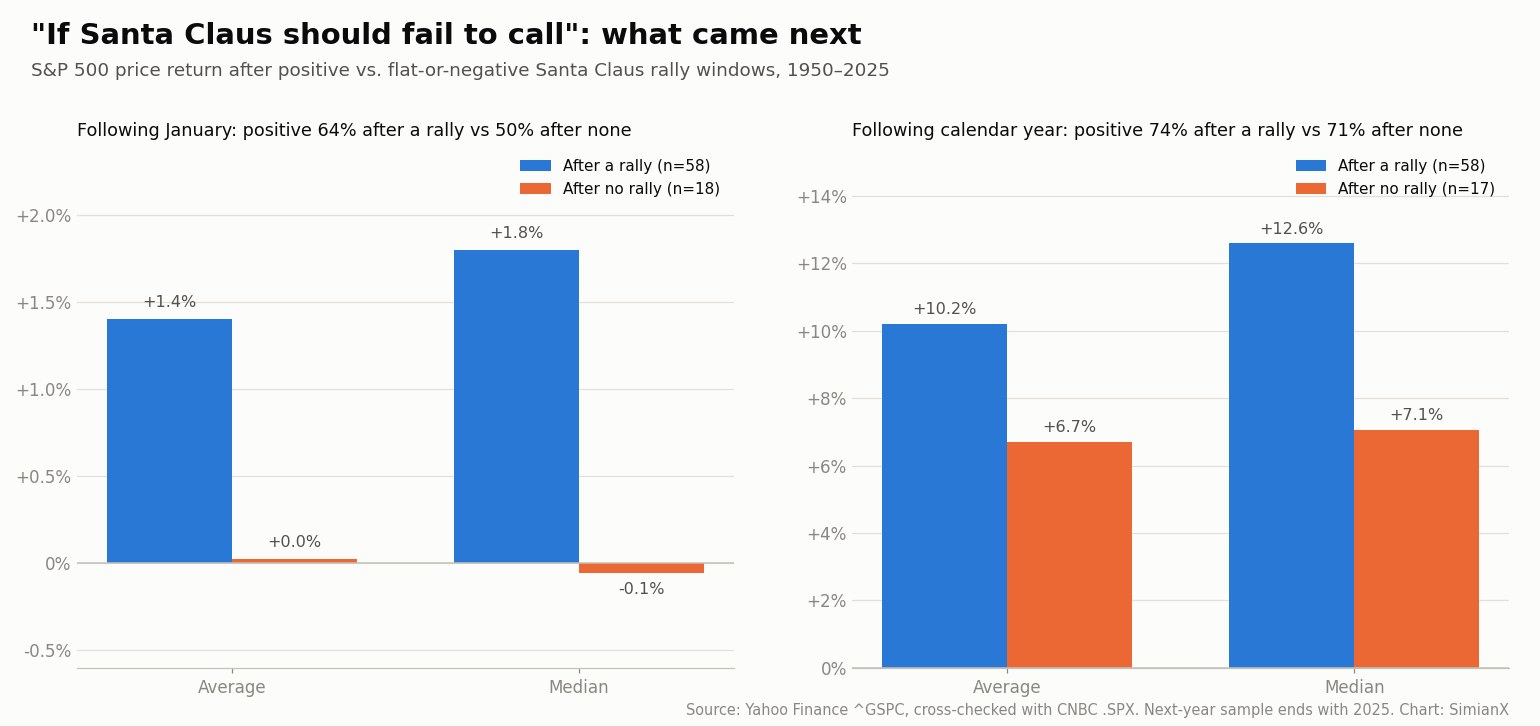
Hirsch's warning is the part of the pattern that is quoted most often each January. Here is every failed window since 1950 and what followed.
| Year | Window ended | S&P 500 change | Following January | Following year |
|---|---|---|---|---|
| 1955 | Jan 4, 1956 | −0.9% | −3.6% | +2.6% |
| 1966 | Jan 4, 1967 | −1.4% | +7.8% | +20.1% |
| 1968 | Jan 3, 1969 | −1.2% | −0.8% | −11.4% |
| 1977 | Jan 4, 1978 | −0.3% | −6.2% | +1.1% |
| 1979 | Jan 3, 1980 | −2.2% | +5.8% | +25.8% |
| 1981 | Jan 5, 1982 | −1.8% | −1.8% | +14.8% |
| 1984 | Jan 3, 1985 | −0.6% | +7.4% | +26.3% |
| 1990 | Jan 3, 1991 | −3.0% | +4.2% | +26.3% |
| 1992 | Jan 5, 1993 | −1.1% | +0.7% | +7.1% |
| 1993 | Jan 4, 1994 | −0.1% | +3.3% | −1.5% |
| 1999 | Jan 4, 2000 | −4.0% | −5.1% | −10.1% |
| 2004 | Jan 4, 2005 | −1.8% | −2.5% | +3.0% |
| 2007 | Jan 3, 2008 | −2.5% | −6.1% | −38.5% |
| 2014 | Jan 5, 2015 | −3.0% | −3.1% | −0.7% |
| 2015 | Jan 5, 2016 | −2.3% | −5.1% | +9.5% |
| 2023 | Jan 3, 2024 | −0.9% | +1.6% | +23.3% |
| 2024 | Jan 3, 2025 | −0.5% | +2.7% | +16.4% |
| 2025 | Jan 5, 2026 | −0.1% | +1.4% | +13.1% so far |
The record supports a weaker version of the rhyme than the one usually quoted:
- January was flat after a miss. The January after a failed window averaged +0.03% and was negative in 9 of 18 cases. After a successful window, January averaged +1.40% and rose 64% of the time.
- The full year was usually positive anyway. Twelve of the 17 completed years after a miss ended higher (71%), against 43 of 58 after a rally (74%). The average was lower, +6.7% against +10.2%, and the medians were +7.1% against +12.6%.
- Two misses came just before major bear markets. The window that ended January 4, 2000 fell 4.0%, and the S&P 500 peaked in March 2000 before falling 49% by October 2002. The window that ended January 3, 2008 fell 2.5%, and 2008 became the index's worst year since 1937 (−38.5%). These two cases explain most of the rhyme's reputation.
- Misses before strong years are as common. 1979, 1984, 1990 and 2023 all failed, and each following year gained more than 23%.
A second test looks at the largest decline in the 12 months after each window. A drop of 20% or more followed 1 of 17 completed misses (2007) and 12 of 58 rallies. A drop of at least 10% followed 9 of 17 misses and 31 of 58 rallies. On this evidence a failed Santa Claus rally has not been a reliable warning of a bear market; the two famous cases are real, but so are the counterexamples.
Three misses in a row: 2023, 2024 and 2025
The three most recent windows all fell — the first three-year losing streak since at least 1950. No earlier run of failures was longer than two years (1992–93 and 2014–15).
- 2023–24 (−0.88%). The S&P 500 rose on the first four sessions, closing at 4,783.35 on December 28, 2023, a few points below its record, then fell on December 29, January 2 and January 3, ending the window at 4,704.81. The index went on to gain 23.3% in 2024.
- 2024–25 (−0.53%). After a 1.10% gain on Christmas Eve, the index fell on five consecutive sessions from December 26, 2024 to January 2, 2025, then rebounded 1.26% on the final day. 2025 still ended up 16.4%, despite a decline of 18.9% between February 19 and April 8 during the tariff selloff — a decline measured in our bear market recovery table.
- 2025–26 (−0.11%). The S&P 500 closed at a record 6,932.05 on December 24, 2025, then fell on four straight sessions into the year-end close of 6,845.50 and recovered most of the loss on January 2 and January 5, 2026. Through October 15, 2026, the index was up 13.1% for the year at 7,744.06.
Three consecutive misses followed by three positive years — 2024, 2025 and 2026 to date — are the clearest recent example of the rhyme not working. They also coincide with the decade in which the window has been weakest.
Santa Claus rallies in midterm election years
December 2026 closes a midterm election year, which matters because midterm years have their own seasonal pattern (covered in our midterm election years study). The Santa Claus windows that began in the 19 midterm Decembers from 1950 to 2022 were positive in 16 and averaged +1.39%, with a median of +1.29%. The three misses were 1966, 1990 and 2014. Nineteen observations are too few to separate this from the overall 76% hit rate; the midterm-year figure is in line with the full sample, not a separate signal.
Rally vs. no rally: the comparison
| After the window… | Rally (58 years) | No rally (18 years) |
|---|---|---|
| Following January, average | +1.40% | +0.03% |
| Following January, share positive | 64% | 50% |
| Following year, average | +10.2% | +6.7% (17 years) |
| Following year, median | +12.6% | +7.1% |
| Following year, share positive | 74% | 71% |
| 20%+ decline within 12 months | 12 of 58 | 1 of 17 |
| 10%+ decline within 12 months | 31 of 58 | 9 of 17 |
The direction of the averages fits Hirsch's idea — the year after a miss has been weaker on average — but the differences are small relative to the spread of outcomes, and the decline counts point the other way. With 17 completed misses, one year such as 2008 moves the average by more than two percentage points.
Why the rally might happen, and why it has shrunk
There is no generally accepted explanation. The ones most often cited are:
- Thin holiday trading. Many institutional traders are away in the last week of December, and lower volume can let a modest amount of buying move prices.
- Year-end cash flows. Bonuses, pension contributions and new-year allocations arrive around the turn of the year.
- The end of tax-loss selling. In the United States, selling to realize losses for the tax year is concentrated in December and stops once the year ends.
- Window dressing and positioning for January. Portfolio managers adjust holdings before year-end reports, and some investors buy ahead of the January effect.
None of these explanations predicts the decline since 2010. The likeliest reason is that the pattern is widely known: if many investors buy before the window, its gains move earlier. The NYSE market holiday calendar also shapes the window each year — in 2026–27, two long weekends sit inside it.
How to use the Santa Claus rally (and what it cannot tell you)
The window is a seven-day statistic with a historical edge of about one percentage point over an ordinary week, a 24% failure rate, and a smaller edge in recent years. It describes the past behaviour of the index; it is not a trading signal by itself. A practical way to use it is as context: knowing that the last week of December has been positive about three times in four makes a quiet, rising holiday week unsurprising, and makes a declining one a data point rather than an omen.
If you follow the window live, SimianX's live multi-agent analysis can run on SPY, the S&P 500 ETF, and Market Pulse scores the news that moves the index during the holiday weeks. For the rest of the calendar, our presidential cycle data and our list of the 20 worst days in S&P 500 history cover the longer patterns. All of our market-history reference pages are collected on the market history topic hub.
Frequently asked questions
What is the Santa Claus rally?
It is the S&P 500's change over the last five trading days of December and the first two trading days of January, as defined by Yale Hirsch in the 1972 Stock Trader's Almanac. From 1950 to 2025 the window was positive in 58 of 76 years and averaged +1.2%.
When is the Santa Claus rally in 2026?
The 2026–27 window runs from Thursday, December 24, 2026 to Tuesday, January 5, 2027. It is measured from the December 23, 2026 close to the January 5, 2027 close. December 24 is an early-close session, and the market is closed on December 25 and January 1.
Does the Santa Claus rally happen every year?
No. It failed in 18 of 76 years since 1950, including three years in a row: 2023, 2024 and 2025. Before that streak, the longest run of failures was two years.
How much does the stock market go up during the Santa Claus rally?
The average S&P 500 gain over the seven sessions was +1.25% from 1950 to 2025, and the median was +1.21%. Since 2010 the average has been +0.30%. The largest rally was +7.45% in 2008–09; the largest decline was −4.04% in 1999–2000.
What happens if there is no Santa Claus rally?
Historically, the following January has been flat on average (+0.03%) and the full year has averaged +6.7%, against +10.2% after a rally. Twelve of 17 completed years after a miss still ended higher. The misses before 2000 and 2008 preceded bear markets; the misses before 1980, 1985, 1991 and 2024 preceded gains above 23%.
Did the Santa Claus rally happen in 2025?
No. The 2025–26 window fell 0.11%, from 6,909.79 on December 23, 2025 to 6,902.05 on January 5, 2026. The S&P 500 was still up 13.1% for 2026 through October 15.
Is the Santa Claus rally the same as the December effect or the January effect?
No. The Santa Claus rally covers seven specific sessions. December as a whole has been one of the stronger months since 1950, and the January effect refers to small-company stocks outperforming in January. Both are covered in our seasonality study.
Is the Santa Claus rally a good reason to buy stocks in late December?
On its own, no. The edge is about one percentage point over seven days, it has shrunk since 2010, and a quarter of windows lose money. It is better used as context than as a trading rule.
Methodology and sources
- Definition. Last five trading days of December plus the first two trading days of January, following the Stock Trader's Almanac. The return runs from the close of the trading day before the window to the close of the seventh session. Each window is labelled by the year in which its December falls; 1950 covers December 1950–January 1951.
- Prices. S&P 500 daily closes (price index, dividends excluded) from Yahoo Finance (^GSPC), cross-checked against CNBC's independent index history (.SPX). Window dates matched for all 76 years. Returns matched to one decimal place in 75 of 76 windows; the exception, 1983, is footnoted. Recent closes were also checked against FRED.
- Following January runs from the December 31 close to the last January close. Following year is the next calendar year's price return. Largest decline is the maximum peak-to-trough decline in closing prices over the 252 trading days after the window.
- Comparison base. All rolling seven-trading-day periods from December 1950 through January 5, 2026.
- Calendar. NYSE holiday and early-close schedule from the exchange's published calendar. Trading-day counts before 1953 exclude Saturday sessions (see the table footnote).
- Data compiled October 16, 2026. This page is for information only and is not investment advice.
Related Reading
- S&P 500 Seasonality: The Best & Worst Months 1950–2026
- The Presidential Cycle: S&P 500 Returns by Year, 1928-2025
- Stock Market After Midterm Elections: Every Cycle 1950–2026
- Every S&P 500 Bear Market Since 1929: When Was the Last?
- The 20 Worst Days in S&P 500 History and What Came Next
- Stock Market Holidays 2027: NYSE & Nasdaq Closed Dates
- S&P 500 Returns by Year: Every Year 1928–2026 Table
- Thanksgiving Week Stock Market: S&P 500 Each Year Since 1950
- Market history: all SimianX reference pages