
The Latest US Inflation Numbers, the CPI Calendar Through 2027 and Two Years of Release-Day Data
Updated October 15, 2026. This page is refreshed after every CPI release; the next update follows the November 10, 2026 report.
The latest US Consumer Price Index (CPI) report, for September 2026, was released on Wednesday, October 14, 2026. Consumer prices rose 0.6% in the month and 3.7% from a year earlier, up from 3.4% in August. Core CPI, which excludes food and energy, rose 0.3% in the month and 2.6% over the year. The next CPI report, for October 2026, is scheduled for Tuesday, November 10, 2026, at 8:30 a.m. ET.
This is SimianX's permanent page for the US CPI report. Rather than writing a new preview and a new recap every month, we update this page after each release: the summary box, the release calendar and the table of the last 24 reports — with the S&P 500 and Treasury moves on each release day — always show the latest data from the Bureau of Labor Statistics (BLS).
Latest CPI report: September 2026
| What | Detail |
|---|---|
| Released | Wednesday, October 14, 2026, 8:30 a.m. ET |
| Headline CPI, 12 months | 3.7%, up from 3.4% in August |
| Headline CPI, 1 month (seasonally adjusted) | +0.6%, after +0.4% in August |
| Core CPI, 12 months | 2.6%, up from 2.4% |
| Core CPI, 1 month (seasonally adjusted) | +0.3%, the same as in August |
| Main driver | Gasoline rose 9.1% in the month and accounted for more than half of the all-items increase; the energy index rose 5.2% in the month and 20.4% over the year |
| Shelter | +0.4% in the month, after +0.3% in August |
| Food | Unchanged in the month; +2.5% over the year |
| CPI-U index level | 336.940 (1982–84 = 100, not seasonally adjusted) |
| Market reaction that day | S&P 500 −1.11%; 2-year Treasury yield +3 bp; 10-year yield −2 bp |
| Next release | October 2026 CPI: Tuesday, November 10, 2026, 8:30 a.m. ET |
What the September report means. The 2026 inflation story is an energy story. Headline inflation was 2.4% as recently as February; energy prices then pushed it to 4.2% in May, its highest reading since April 2023, and after a dip in the summer it rose again in September as gasoline jumped. Core inflation has stayed in a narrow 2.4%–2.9% band all year, so the gap between headline and core — 1.1 percentage points in September — reflects energy rather than broad price pressure. That gap still matters to the Federal Reserve, which raised rates on September 16 to "support a timelier return" to its 2% goal. The Fed's next decision comes on October 28, before the October CPI is released; our always-updated Fed interest rate decision page tracks every move.
We report only the official BLS figures. Economists' consensus forecasts differ from survey to survey and are not published by the BLS, so we do not list them here.
CPI release schedule: remaining 2026 and 2027 dates
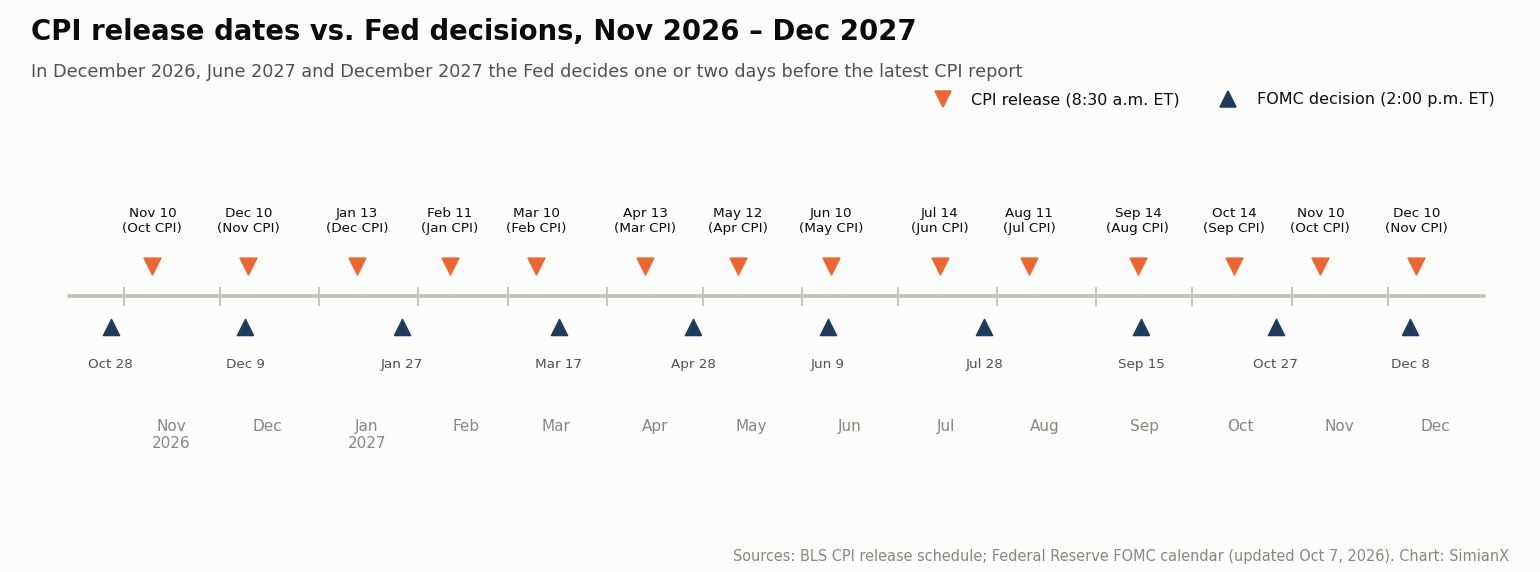
Every CPI report is released at 8:30 a.m. Eastern Time, before the US stock market opens. The BLS schedule lists these dates:
| Reference month | Release date | Day | Timing versus the Fed |
|---|---|---|---|
| October 2026 | November 10, 2026 | Tuesday | After the October 28 decision |
| November 2026 | December 10, 2026 | Thursday | One day after the December 9 decision |
| December 2026 | January 13, 2027 | Wednesday | Two weeks before the January 27 decision |
| January 2027 | February 11, 2027 | Thursday | No February meeting |
| February 2027 | March 10, 2027 | Wednesday | One week before the March 17 decision |
| March 2027 | April 13, 2027 | Tuesday | Two weeks before the April 28 decision |
| April 2027 | May 12, 2027 | Wednesday | Four weeks before the June 9 decision |
| May 2027 | June 10, 2027 | Thursday | One day after the June 9 decision |
| June 2027 | July 14, 2027 | Wednesday | Two weeks before the July 28 decision |
| July 2027 | August 11, 2027 | Wednesday | No August meeting |
| August 2027 | September 14, 2027 | Tuesday | First day of the September 14–15 meeting |
| September 2027 | October 14, 2027 | Thursday | Two weeks before the October 27 decision |
| October 2027 | November 10, 2027 | Wednesday | Four weeks before the December 8 decision |
| November 2027 | December 10, 2027 | Friday | Two days after the December 8 decision |
The report for December 2027 will be released in January 2028; the BLS has not yet scheduled it. Note the three meetings — December 2026, June 2027 and December 2027 — at which the Fed decides before that month's CPI is out. At those meetings the latest CPI the Committee has seen is about four weeks old, which raises the weight of the previous month's report.
The last 24 CPI reports: inflation data and market reaction
The table lists the last 24 published reports, newest first. Monthly changes are seasonally adjusted and shown as first reported; 12-month changes are not seasonally adjusted. The two market columns show the close-to-close change on the release day: the S&P 500 in percent, and the 2-year Treasury yield — the maturity most sensitive to expected Fed policy — in basis points.
| Reference month | Released | Headline, 1 month | Headline, 12 months | Core, 1 month | Core, 12 months | S&P 500 that day | 2-yr Treasury yield |
|---|---|---|---|---|---|---|---|
| September 2026 | Oct 14, 2026 | +0.6% | 3.7% | +0.3% | 2.6% | −1.11% | +3 bp |
| August 2026 | Sep 11, 2026 | +0.4% | 3.4% | +0.3% | 2.4% | +0.86% | +7 bp |
| July 2026 | Aug 12, 2026 | +0.1% | 3.4% | +0.2% | 2.5% | +0.26% | −2 bp |
| June 2026 | Jul 14, 2026 | −0.4% | 3.5% | 0.0% | 2.6% | +0.38% | −8 bp |
| May 2026 | Jun 10, 2026 | +0.5% | 4.2% | +0.2% | 2.9% | −1.62% | 0 bp |
| April 2026 | May 12, 2026 | +0.6% | 3.8% | +0.4% | 2.8% | −0.16% | +5 bp |
| March 2026 | Apr 10, 2026 | +0.9% | 3.3% | +0.2% | 2.6% | −0.11% | +3 bp |
| February 2026 | Mar 11, 2026 | +0.3% | 2.4% | +0.2% | 2.5% | −0.08% | +7 bp |
| January 2026 | Feb 13, 2026 | +0.2% | 2.4% | +0.3% | 2.5% | +0.05% | −7 bp |
| December 2025 | Jan 13, 2026 | +0.3% | 2.7% | +0.2% | 2.6% | −0.19% | −1 bp |
| November 2025 | Dec 18, 2025 | — | 2.7% | — | 2.6% | +0.79% | −3 bp |
| October 2025 | not published | — | — | — | — | — | — |
| September 2025 | Oct 24, 2025 | +0.3% | 3.0% | +0.2% | 3.0% | +0.79% | 0 bp |
| August 2025 | Sep 11, 2025 | +0.4% | 2.9% | +0.3% | 3.1% | +0.85% | −2 bp |
| July 2025 | Aug 12, 2025 | +0.2% | 2.7% | +0.3% | 3.1% | +1.13% | −4 bp |
| June 2025 | Jul 15, 2025 | +0.3% | 2.7% | +0.2% | 2.9% | −0.40% | +5 bp |
| May 2025 | Jun 11, 2025 | +0.1% | 2.4% | +0.1% | 2.8% | −0.27% | −7 bp |
| April 2025 | May 13, 2025 | +0.2% | 2.3% | +0.2% | 2.8% | +0.72% | +4 bp |
| March 2025 | Apr 10, 2025 | −0.1% | 2.4% | +0.1% | 2.8% | −3.46% | −7 bp |
| February 2025 | Mar 12, 2025 | +0.2% | 2.8% | +0.2% | 3.1% | +0.49% | +7 bp |
| January 2025 | Feb 12, 2025 | +0.5% | 3.0% | +0.4% | 3.3% | −0.27% | +7 bp |
| December 2024 | Jan 15, 2025 | +0.4% | 2.9% | +0.2% | 3.2% | +1.83% | −10 bp |
| November 2024 | Dec 11, 2024 | +0.3% | 2.7% | +0.3% | 3.3% | +0.82% | 0 bp |
| October 2024 | Nov 13, 2024 | +0.2% | 2.6% | +0.3% | 3.3% | +0.02% | −7 bp |
| September 2024 | Oct 10, 2024 | +0.2% | 2.4% | +0.3% | 3.3% | −0.21% | −1 bp |
Two notes on the data. First, the BLS revises seasonally adjusted figures every February for the previous five years, so a few of the 2024–2025 monthly changes now read 0.1 point differently in the BLS database; the 12-month changes are never revised. Second, there is no October 2025 report, and the November 2025 report had no monthly change, for reasons explained below.
What two years of CPI data show
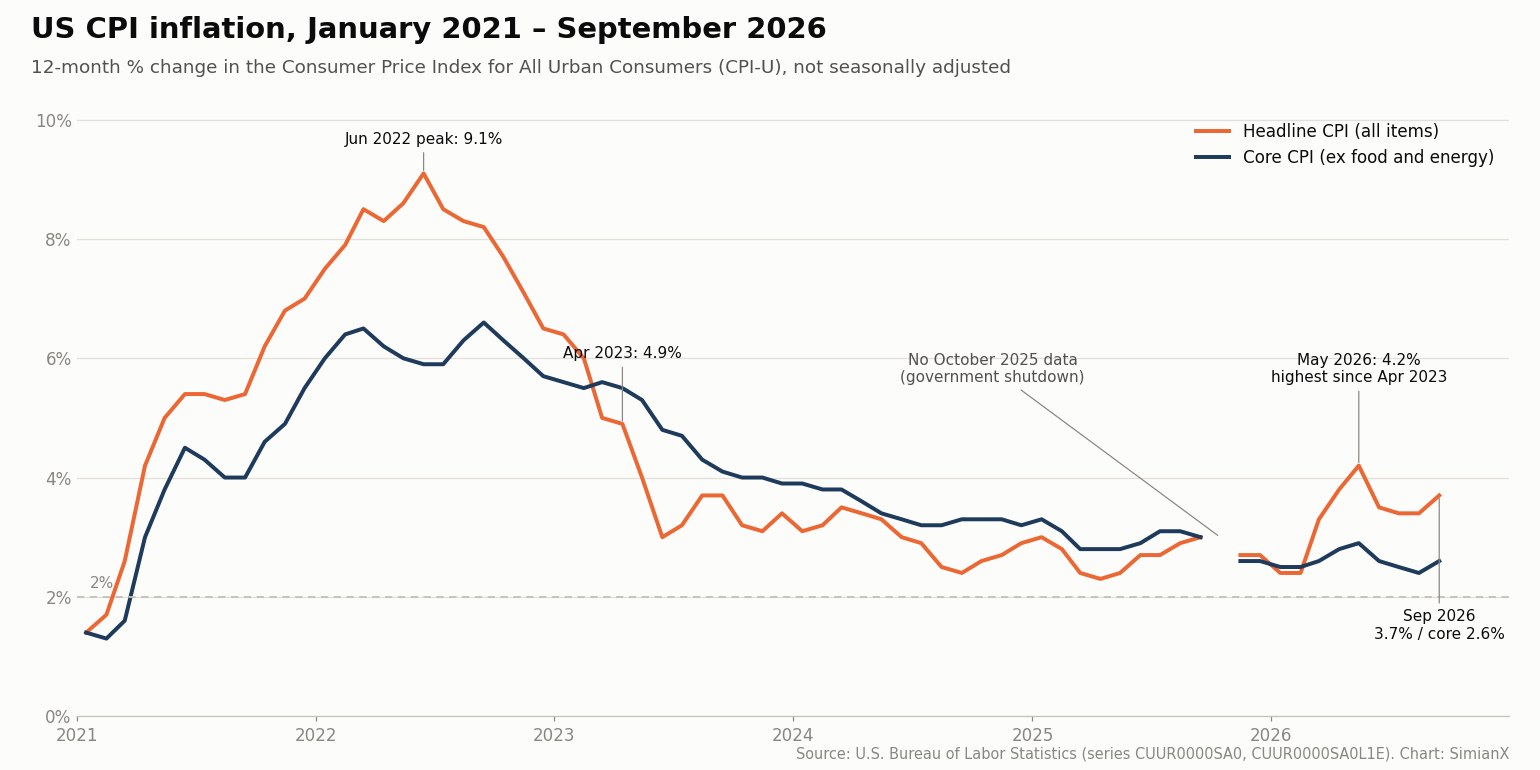
- Disinflation stalled in 2025. Headline inflation spent the year between 2.3% and 3.0%, and core between 2.6% and 3.3%. Inflation never fell back to the 2% area that the Fed was waiting for.
- The 2026 rise was an energy shock. Headline CPI jumped 0.9% in March 2026 alone — the largest monthly increase since June 2022 — and climbed to 4.2% over 12 months in May. Energy is only 6.4% of the CPI basket, but with the energy index up 20.4% over the year it adds roughly 1.3 percentage points to the headline rate on its own.
- Core inflation barely moved. Core CPI ranged from 2.4% to 2.9% throughout 2026. In May the headline rate ran 1.3 points above core, the widest gap since October 2022.
- Shelter is still the biggest single input. Shelter makes up 35.6% of the CPI and about 45% of core, so its monthly change — 0.4% in September — sets the floor for core inflation more than any other component.
How stocks and bonds react on CPI day
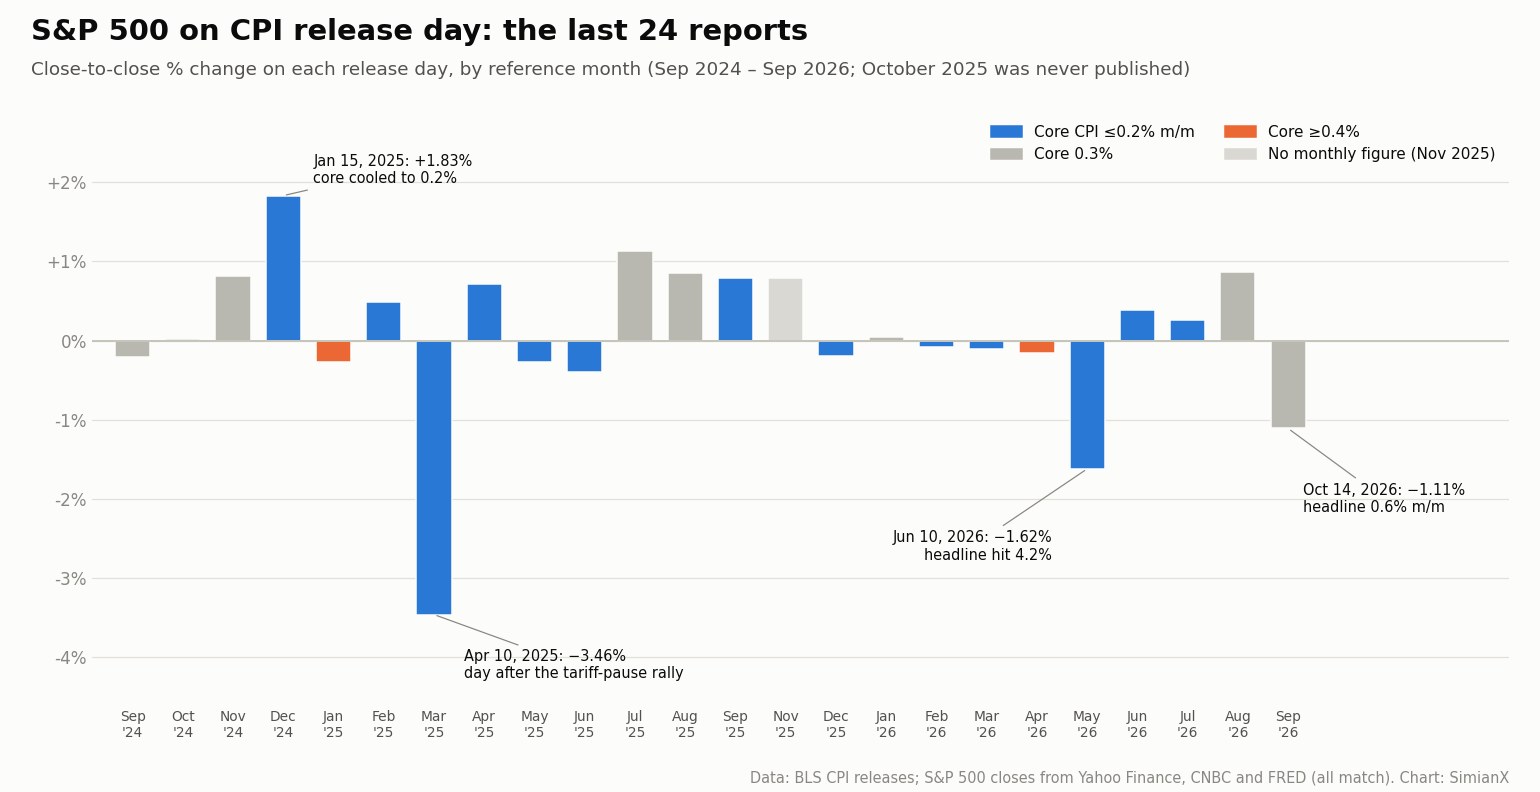
Over these 24 release days the S&P 500 rose 13 times (54%) and moved by an average of 0.70% in either direction, only slightly more than the 0.67% average on all other trading days over the same period. The 2-year Treasury yield moved by 4.5 basis points on average. Five release days produced a stock move of 1% or more, and they show why a CPI print alone rarely explains the day:
- April 10, 2025 (−3.46%). A soft report (−0.1% headline, +0.1% core) could not prevent a sell-off the day after the S&P 500's 9.52% rally on the pause in tariff increases. Trade policy, not inflation, drove that session.
- January 15, 2025 (+1.83%). Core inflation cooled to 0.2% after four straight 0.3% readings, and the 2-year yield fell 10 basis points.
- June 10, 2026 (−1.62%). Headline inflation reached 4.2%, the high of the energy shock.
- August 12, 2025 (+1.13%). Headline rose 0.2% and core 0.3%; the 2-year yield slipped 4 basis points, and the Fed went on to cut rates five weeks later, on September 17.
- October 14, 2026 (−1.11%). The September report showed a 0.6% monthly jump driven by gasoline.
The two hottest core readings in the table — 0.4% for January 2025 and April 2026 — were both followed by modest stock declines (−0.27% and −0.16%) and a higher 2-year yield (+7 and +5 basis points). For crypto, where CPI days have produced much larger swings, see our US CPI vs crypto playbook.
Why there is no October 2025 CPI report
The BLS did not collect CPI data from October 1 through November 12, 2025, during the lapse in federal government appropriations. As a result, the October 2025 report was never published, and the BLS database has no October 2025 value for the all-items or core index. The November 2025 report, released on December 18, gave 12-month changes but no monthly change, because there was no October index to compare with. The BLS says the missing October data also affected the April 2026 rent and owners' equivalent rent indexes, because each rental unit in the BLS sample is priced once every six months. Its shutdown impact page documents the effects.
How to read a CPI report
- Headline versus core. Headline CPI covers everything consumers buy. Core CPI removes food and energy, whose prices swing with weather and oil markets, to show the underlying trend. Core accounted for 79.9% of the index in December 2025.
- Monthly versus annual. The monthly change is seasonally adjusted and shows the latest momentum; the 12-month change is not seasonally adjusted and changes slowly. A 0.3% monthly increase works out to about 3.7% a year if repeated, so a run of 0.3% readings keeps core inflation well above 2%.
- Rounding matters. The BLS rounds to one decimal place, so a "0.3%" can be anything from 0.25% to 0.34%. Markets often react to the second decimal, which analysts compute from the index levels.
- Table A is the summary. The first table in every release shows the last seven monthly changes for each major component, plus the 12-month change. It is the quickest way to see whether a surprise came from energy, food, shelter or core goods.
- Seasonal revisions every February. With the January report, the BLS recalculates seasonal factors for the past five years. The latest update, on February 13, 2026, covered January 2021 to December 2025.
- CPI is not the Fed's target. The Fed's 2% goal is defined in terms of the PCE price index, which the Bureau of Economic Analysis publishes later each month. PCE gives shelter a smaller weight than the CPI. In the September 2026 projections, Fed officials expected PCE inflation of 3.7% and core PCE inflation of 3.4% for 2026.
For a real-time estimate between releases, the Cleveland Fed's Inflation Nowcasting page publishes daily estimates for the current month's CPI and PCE.
How this page is updated
How this page is updated: after every CPI release. On each release day we refresh the "Latest CPI report" box after the 8:30 a.m. ET publication, add the new month to the table of the last 24 reports (and drop the oldest), record the S&P 500 and 2-year Treasury moves at the close, and roll the "next release" date forward. Each February we note the BLS seasonal revisions, and when the BLS publishes the following year's release schedule we add it to the calendar. Last updated: October 15, 2026. The next update follows the October 2026 CPI report on November 10.
Follow the next CPI report with SimianX
CPI mornings move fast: the numbers come out an hour before the opening bell, and futures, Treasuries and the dollar react within seconds. SimianX's Market Pulse scores the headlines as they land, so the CPI print, the Fed reaction and the biggest market moves arrive ranked by importance. The Live Command Room puts a team of AI agents on any ticker in real time — SPY for the broad market, or rate-sensitive stocks such as JPM — and the Auto Digest delivers a daily AI briefing. Plans start free.
Frequently asked questions
What is the current US inflation rate?
Consumer prices rose 3.7% in the 12 months to September 2026, according to the CPI released on October 14, 2026. Core inflation, excluding food and energy, was 2.6%.
When is the next CPI report?
The October 2026 CPI will be released on Tuesday, November 10, 2026, at 8:30 a.m. ET. The November 2026 report follows on Thursday, December 10, 2026.
What time is the CPI released?
The BLS publishes the CPI at 8:30 a.m. Eastern Time, one hour before the New York Stock Exchange opens.
What is the difference between headline and core CPI?
Headline CPI measures the prices of all goods and services in the basket. Core CPI excludes food and energy, which are volatile, to show the underlying trend. In September 2026, headline was 3.7% and core 2.6%, a gap that mostly reflects higher energy prices.
Why was there no October 2025 CPI report?
The BLS did not collect price data from October 1 to November 12, 2025, during the federal government shutdown, so it never published an October 2025 report or October index values.
Does the stock market go up or down on CPI day?
Neither reliably. Over the last 24 reports the S&P 500 rose on 13 release days and fell on 11, with an average move of 0.70% in either direction. The biggest moves often reflected other news on the same day.
Which inflation measure does the Fed target?
The Fed targets 2% inflation as measured by the PCE price index, not the CPI. The two usually move together, but the CPI gives more weight to shelter, so it has tended to run higher.
Who publishes the CPI?
The U.S. Bureau of Labor Statistics, part of the Department of Labor, publishes the CPI every month. The data and full release archive are on bls.gov.
Methodology and sources
- Inflation figures come from each monthly BLS CPI news release (Table A), using the values first reported for the reference month. Every 12-month change was cross-checked against the BLS index levels for series CUUR0000SA0 (all items) and CUUR0000SA0L1E (core) from the BLS public data API, and all matched.
- Release dates are from the BLS release archive and its published CPI release schedule. FOMC dates are from the Federal Reserve's meeting calendar.
- Weights are the BLS relative importance of CPI components for December 2025.
- S&P 500 changes are close-to-close price changes on release day from Yahoo Finance, cross-checked against CNBC's index history and FRED; all three matched for every release day. "Other trading days" covers October 2024 to October 2026, excluding the 24 release days.
- Treasury yields are U.S. Treasury daily par yields; the change is from the previous trading day's close. Data compiled October 15, 2026. This page is for information only and is not investment advice.
Related Reading
- Fed Interest Rate Decision: Latest FOMC Result and History
- FOMC Meeting Dates 2027: How the S&P 500 Moves on Fed Days
- Every Fed Rate-Hike Cycle Since 1983: S&P 500 & Chip Stocks
- Every Fed Rate-Cut Cycle Since 1980: Stocks, Bonds & Gold
- Yield Curve Inversions and US Recessions: A Reference Table
- US CPI vs Crypto: 5%-Day Swings & Rate-Bet Playbook
- August 2026 CPI Report: What We Got Right and Wrong
- July CPI Report 2026: Inflation Falls, Fed Hike in Doubt
References
- U.S. Bureau of Labor Statistics — Consumer Price Index, September 2026
- U.S. Bureau of Labor Statistics — CPI release schedule
- U.S. Bureau of Labor Statistics — Archived CPI news releases
- U.S. Bureau of Labor Statistics — Relative importance of CPI components, December 2025
- U.S. Bureau of Labor Statistics — 2025 shutdown impact on the CPI
- U.S. Bureau of Labor Statistics — Updated seasonal factors, February 13, 2026
- U.S. Bureau of Economic Analysis — PCE price index
- Federal Reserve — Summary of Economic Projections, September 16, 2026
- Federal Reserve — Why the Fed aims for 2 percent inflation
- Federal Reserve Bank of Cleveland — Inflation Nowcasting
- U.S. Treasury — Daily Treasury par yield curve rates
- FRED — S&P 500 daily index (SP500)