
The Latest Fed Rate Decision and Every FOMC Move Since 2022
Updated October 15, 2026. This page is refreshed after every FOMC meeting; the next update follows the October 28, 2026 decision.
The Federal Reserve's latest interest rate decision came on Wednesday, September 16, 2026, when the Federal Open Market Committee (FOMC) voted 12–0 to raise the federal funds target range by 0.25 percentage point to 3.75%–4.00%. It was the Fed's first rate hike since July 2023. The next decision is due at 2:00 p.m. ET on Wednesday, October 28, 2026.
This is SimianX's permanent page for the Fed rate decision. Instead of publishing a new article for every meeting, we update this one: the summary box below, the full history table, the dot plot and the market reaction are refreshed after each FOMC statement, so the link always shows the current federal funds rate and the full record behind it.
Latest Fed decision: September 16, 2026
| What | Detail |
|---|---|
| Decision | Raised the federal funds target range by 25 basis points (0.25 percentage point), the first increase since July 26, 2023 |
| New target range | 3.75%–4.00%, effective September 17, 2026 (previously 3.50%–3.75%) |
| Vote | 12–0, unanimous. In July, three officials had dissented in favor of a hike |
| Chair | Kevin Warsh, at his third meeting as Chairman (he took office on May 22, 2026) |
| Dot plot median, end of 2026 | 4.1%, one more quarter-point hike by December; 16 of 18 officials projected at least one more increase this year |
| Dot plot median, 2027 / 2028 / 2029 / longer run | 4.1% / 3.9% / 3.6% / 3.2% |
| Key change in the statement | A new sentence: "Today's policy action will support a timelier return to the Committee's 2 percent goal." July's reference to supply shocks in energy was dropped |
| Other policy rates | Interest on reserve balances 3.90%; primary credit (discount) rate 4.00%; overnight reverse repo rate 3.75% |
| Market reaction that day | S&P 500 −0.45%; 10-year Treasury yield +1 bp; 2-year yield +7 bp |
| Effective federal funds rate | 3.88% on October 14, 2026 (New York Fed) |
| Minutes (released October 7) | "Most participants" judged that another increase "would likely be appropriate by year end" |
| Next decision | Wednesday, October 28, 2026, 2:00 p.m. ET; press conference 2:30 p.m. ET |
What changed in September. The statement described economic activity as "expanding at a solid pace", domestic spending as "resilient" and productivity growth as "strong", while repeating that "inflation remains elevated." Inflation was the reason for the move: headline consumer prices had climbed to 3.4% in August from 2.4% in February as energy prices surged, and the September report, released on October 14, showed 3.7% — see our always-updated US CPI report page for the latest print. The hike also completed a shift that began in June, when the dot plot first pointed to higher rates. In June, eight of 18 officials still expected to hold at 3.50%–3.75% through year-end and the median projection for the end of 2026 was 3.8%; by September the median had risen to 4.1%, and only two officials projected no further increase after the hike.
When is the next Fed meeting?
The next FOMC meeting is October 27–28, 2026, with the decision at 2:00 p.m. ET on Wednesday, October 28. It is not a projection meeting, so there will be no new dot plot. The last meeting of the year, December 8–9, 2026, comes with fresh projections — and the decision on December 9 lands one day before the November CPI report, which the Bureau of Labor Statistics releases on December 10.
| Meeting | Decision day | Projections and dot plot |
|---|---|---|
| October 27–28, 2026 | Wednesday, October 28, 2026 | No |
| December 8–9, 2026 | Wednesday, December 9, 2026 | Yes |
| January 26–27, 2027 | Wednesday, January 27, 2027 | No |
| March 16–17, 2027 | Wednesday, March 17, 2027 | Yes |
| April 27–28, 2027 | Wednesday, April 28, 2027 | No |
| June 8–9, 2027 | Wednesday, June 9, 2027 | Yes |
| July 27–28, 2027 | Wednesday, July 28, 2027 | No |
| September 14–15, 2027 | Wednesday, September 15, 2027 | Yes |
| October 26–27, 2027 | Wednesday, October 27, 2027 | No |
| December 7–8, 2027 | Wednesday, December 8, 2027 | Yes |
The Fed calls every date tentative until it is confirmed at the meeting before. Local announcement times in Asia and Europe, and how the S&P 500 has behaved on all 93 scheduled decision days since 2015, are in our FOMC meeting dates 2027 calendar.
Fed interest rate history: every FOMC decision since 2022
The table lists all 38 scheduled FOMC decisions from January 2022 to September 2026, newest first. An asterisk (*) marks a meeting with a Summary of Economic Projections, the release that includes the dot plot. "Vote" is the number of voting members for and against the action. The two market columns show the close-to-close change on decision day: the S&P 500 in percent, and the 10-year Treasury yield in basis points (one basis point is 0.01 percentage point).
| Decision date | Action | Target range after | Vote | S&P 500 | 10-yr Treasury yield |
|---|---|---|---|---|---|
| Sep 16, 2026 * | Hike +25 bp | 3.75–4.00% | 12–0 | −0.45% | +1 bp |
| Jul 29, 2026 | Hold | 3.50–3.75% | 9–3 | −1.52% | +6 bp |
| Jun 17, 2026 * | Hold | 3.50–3.75% | 12–0 | −1.21% | +6 bp |
| Apr 29, 2026 | Hold | 3.50–3.75% | 8–4 | −0.04% | +6 bp |
| Mar 18, 2026 * | Hold | 3.50–3.75% | 11–1 | −1.36% | +6 bp |
| Jan 28, 2026 | Hold | 3.50–3.75% | 10–2 | −0.01% | +2 bp |
| Dec 10, 2025 * | Cut −25 bp | 3.50–3.75% | 9–3 | +0.67% | −5 bp |
| Oct 29, 2025 | Cut −25 bp | 3.75–4.00% | 10–2 | 0.00% | +9 bp |
| Sep 17, 2025 * | Cut −25 bp | 4.00–4.25% | 11–1 | −0.10% | +2 bp |
| Jul 30, 2025 | Hold | 4.25–4.50% | 9–2 | −0.12% | +4 bp |
| Jun 18, 2025 * | Hold | 4.25–4.50% | 12–0 | −0.03% | −1 bp |
| May 7, 2025 | Hold | 4.25–4.50% | 12–0 | +0.43% | −4 bp |
| Mar 19, 2025 * | Hold | 4.25–4.50% | 11–1 | +1.08% | −4 bp |
| Jan 29, 2025 | Hold | 4.25–4.50% | 12–0 | −0.47% | 0 bp |
| Dec 18, 2024 * | Cut −25 bp | 4.25–4.50% | 11–1 | −2.95% | +10 bp |
| Nov 7, 2024 | Cut −25 bp | 4.50–4.75% | 12–0 | +0.74% | −11 bp |
| Sep 18, 2024 * | Cut −50 bp | 4.75–5.00% | 11–1 | −0.29% | +5 bp |
| Jul 31, 2024 | Hold | 5.25–5.50% | 12–0 | +1.58% | −6 bp |
| Jun 12, 2024 * | Hold | 5.25–5.50% | 12–0 | +0.85% | −8 bp |
| May 1, 2024 | Hold | 5.25–5.50% | 12–0 | −0.34% | −6 bp |
| Mar 20, 2024 * | Hold | 5.25–5.50% | 12–0 | +0.89% | −3 bp |
| Jan 31, 2024 | Hold | 5.25–5.50% | 12–0 | −1.61% | −7 bp |
| Dec 13, 2023 * | Hold | 5.25–5.50% | 12–0 | +1.37% | −16 bp |
| Nov 1, 2023 | Hold | 5.25–5.50% | 12–0 | +1.05% | −11 bp |
| Sep 20, 2023 * | Hold | 5.25–5.50% | 12–0 | −0.94% | −2 bp |
| Jul 26, 2023 | Hike +25 bp | 5.25–5.50% | 11–0 | −0.02% | −5 bp |
| Jun 14, 2023 * | Hold | 5.00–5.25% | 11–0 | +0.08% | −1 bp |
| May 3, 2023 | Hike +25 bp | 5.00–5.25% | 11–0 | −0.70% | −6 bp |
| Mar 22, 2023 * | Hike +25 bp | 4.75–5.00% | 11–0 | −1.65% | −11 bp |
| Feb 1, 2023 | Hike +25 bp | 4.50–4.75% | 12–0 | +1.05% | −13 bp |
| Dec 14, 2022 * | Hike +50 bp | 4.25–4.50% | 12–0 | −0.61% | −2 bp |
| Nov 2, 2022 | Hike +75 bp | 3.75–4.00% | 12–0 | −2.50% | +3 bp |
| Sep 21, 2022 * | Hike +75 bp | 3.00–3.25% | 12–0 | −1.71% | −6 bp |
| Jul 27, 2022 | Hike +75 bp | 2.25–2.50% | 12–0 | +2.62% | −3 bp |
| Jun 15, 2022 * | Hike +75 bp | 1.50–1.75% | 10–1 | +1.46% | −16 bp |
| May 4, 2022 | Hike +50 bp | 0.75–1.00% | 9–0 | +2.99% | −4 bp |
| Mar 16, 2022 * | Hike +25 bp | 0.25–0.50% | 8–1 | +2.24% | +4 bp |
| Jan 26, 2022 | Hold | 0.00–0.25% | 9–0 | −0.15% | +7 bp |
In total: 12 hikes (550 basis points), 6 cuts (175 basis points) and 20 holds. There were no unscheduled rate decisions in this period; the last emergency moves were the two cuts of March 2020. Some meetings show fewer than 12 votes because of vacancies on the Board of Governors or an absent member.
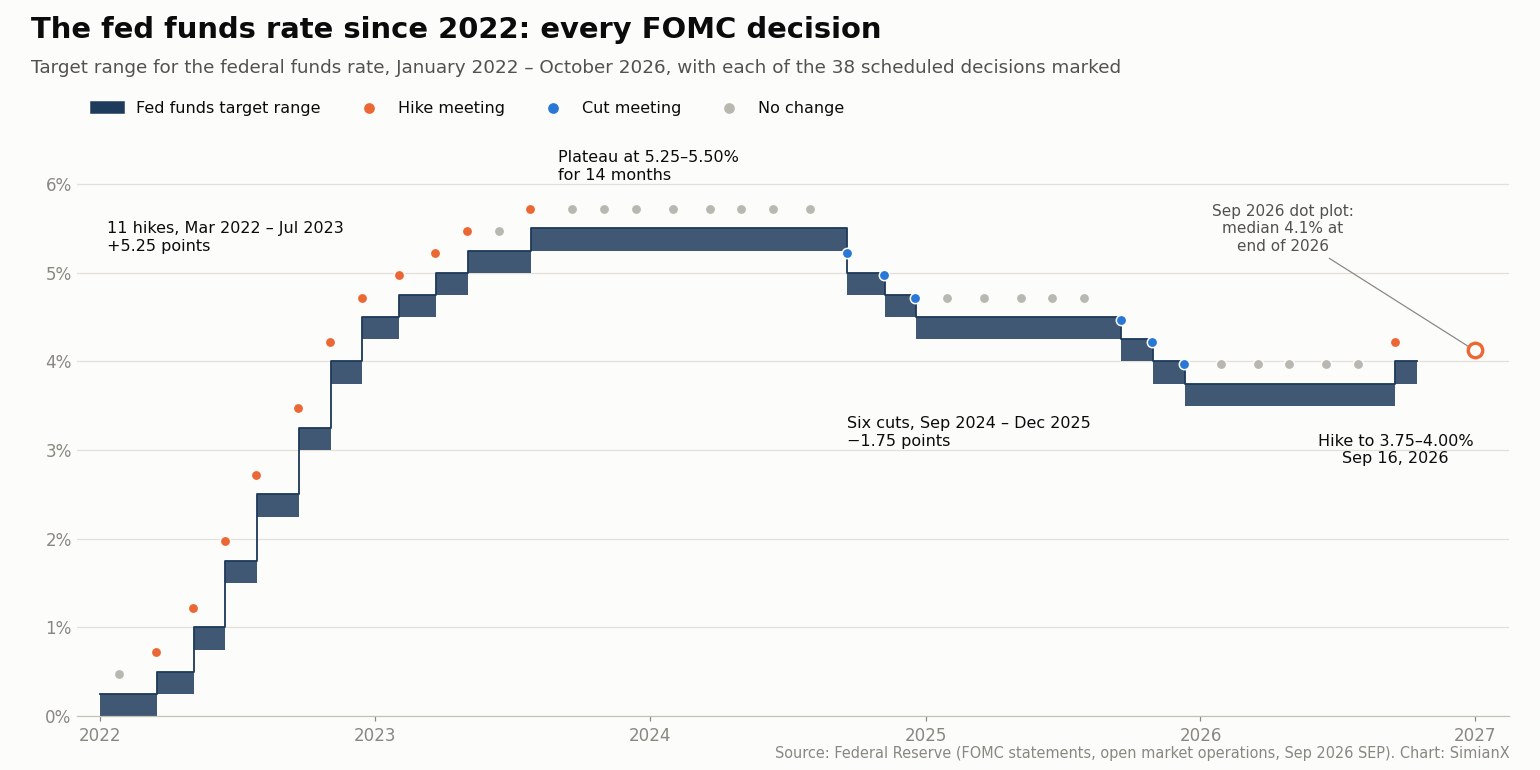
The 2022–2026 rate cycle in four phases
1. The fastest tightening since the early 1980s (March 2022 – July 2023)
Starting from near zero, the Fed raised rates 11 times in 16 months, a total of 5.25 percentage points. The June 15, 2022 increase of 75 basis points was the first move of that size since November 1994, and three more 75-point hikes followed in July, September and November. The campaign ended with the July 26, 2023 hike to 5.25%–5.50%. Our reference table of every Fed rate-hike cycle since 1983 puts that cycle in context: it produced the deepest during-cycle drawdown for stocks in the table, yet the S&P 500 finished the cycle higher.
2. The plateau (July 2023 – September 2024)
The Fed then held the target range at 5.25%–5.50% for eight consecutive meetings, about 14 months. The long hold is visible in the bond market: the 10-year yield fell on all eight of those hold days, including a 16-basis-point drop on December 13, 2023, when the projections pointed to three quarter-point cuts in 2024. The yield curve, measured by the 10-year minus the 2-year yield, stayed inverted on 274 of the 288 trading days in this period — see our yield curve inversions reference table for what that has historically meant.
3. The easing (September 2024 – December 2025)
The Fed cut six times for a total of 1.75 percentage points: by half a point in September 2024, by a quarter point in November and December 2024, and — after five holds in the first half of 2025 — by a quarter point each in September, October and December 2025. The votes became less unanimous as the cuts went on. In December 2025 three officials dissented: Stephen Miran wanted a half-point cut, while Austan Goolsbee and Jeffrey Schmid wanted no change. Our history of every Fed rate-cut cycle since 1980 shows how cuts made in a slowdown differ from cuts made in a crisis, and our Bitcoin after every Fed rate cut table covers the crypto side.
4. The 2026 reversal (January 2026 – today)
The Fed held at 3.50%–3.75% from January through July 2026 while the direction of dissent turned around. In January, Miran and Christopher Waller dissented in favor of a cut. In April, the vote was 8–4: Miran again wanted a cut, while Beth Hammack, Neel Kashkari and Lorie Logan supported the hold but objected to the statement's easing bias. Kevin Warsh took office as Chairman on May 22, 2026, and at his first meeting in June the projections flipped toward a hike, as covered in Warsh's first Fed meeting. In July, Hammack, Kashkari and Logan dissented for an immediate hike, and in September the full Committee joined them. Our breakdown of that meeting is in Warsh ignores Trump: the Fed's first rate hike since 2023.
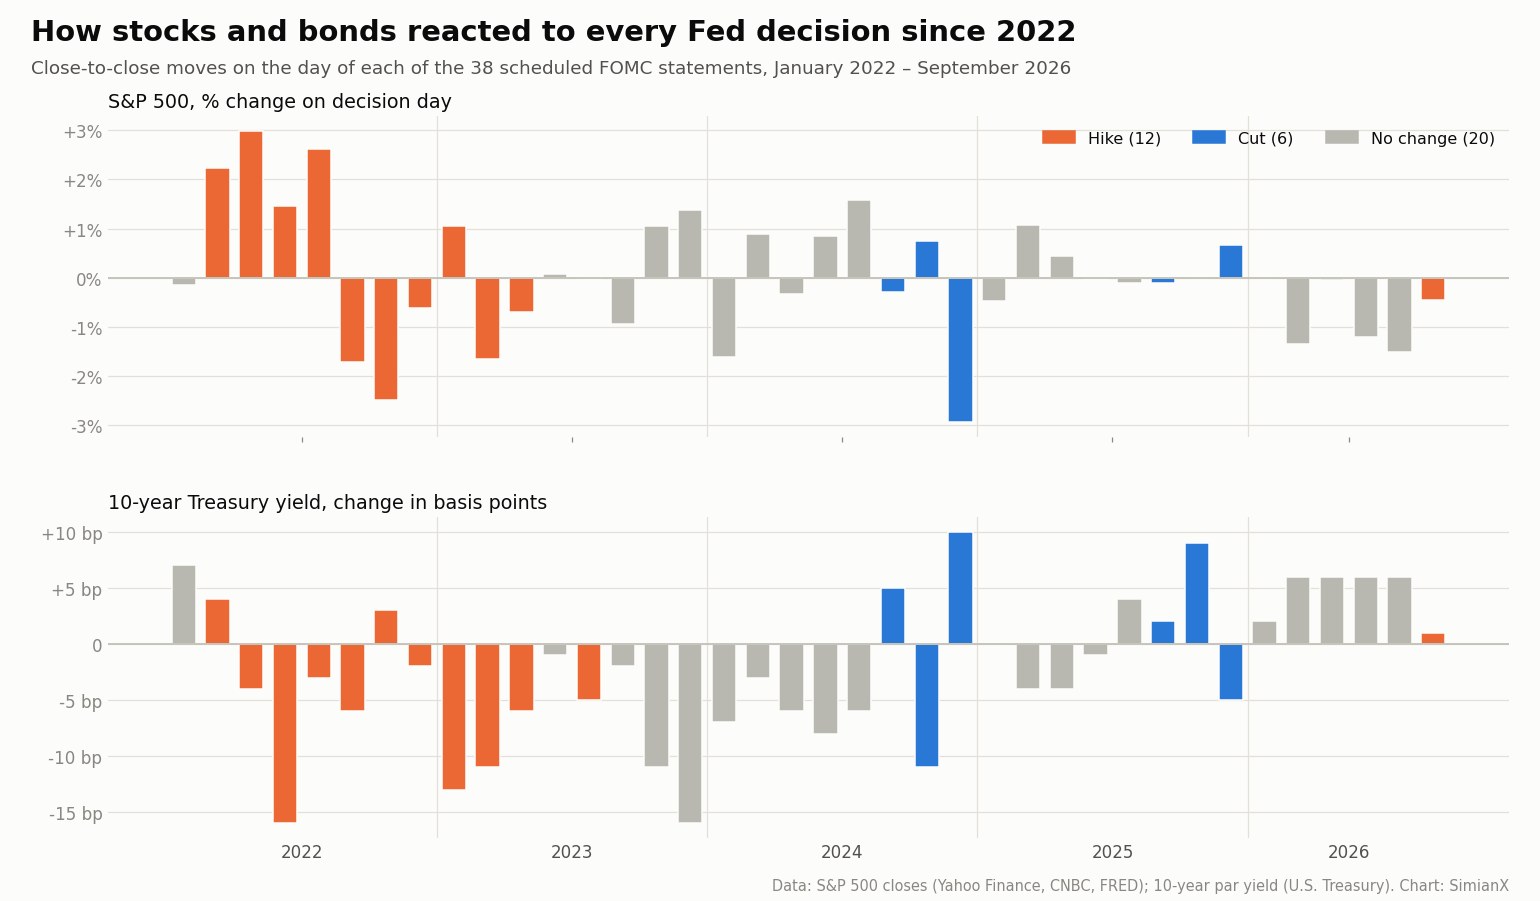
How stocks and bonds reacted to Fed decisions, 2022–2026
| Decision type | Meetings | S&P 500 closed higher | Average absolute S&P 500 move | 10-yr yield fell | Average 10-yr yield change |
|---|---|---|---|---|---|
| Hike | 12 | 5 | 1.50% | 9 of 12 | −4.8 bp |
| Cut | 6 | 2 | 0.79% | 2 of 6 | +1.7 bp |
| Hold | 20 | 8 | 0.76% | 12 of 20 | −1.6 bp |
| All decisions | 38 | 15 | 1.00% | 23 of 38 | −2.1 bp |
Four lessons stand out:
- Long-term yields often moved against the policy rate. The 10-year Treasury yield fell on nine of the 12 hike days and rose on four of the six cut days — by 10 basis points on December 18, 2024 and by 9 basis points on October 29, 2025. A cut does not automatically lower mortgage rates that afternoon; the 10-year reacts to what the Fed signals about the future, not to the cut itself.
- The guidance matters more than the move. The worst decision day in this sample was a cut: on December 18, 2024 the S&P 500 fell 2.95% after the projections showed fewer cuts ahead. The best was a hike: on May 4, 2022 the index rose 2.99% after the Chair played down the idea of a 75-basis-point move — a rally that was erased the next day.
- Dissents were an early signal. There were two dissenting votes in all of 2024, nine in 2025 and ten in the first six meetings of 2026. In 2026 the dissents moved from favoring cuts to favoring hikes two months before the Committee actually hiked.
- 2026 decision days have all been down days. The S&P 500 closed lower on all six 2026 decision days, by an average of 0.76%. The longer record on our FOMC calendar page shows Fed days lean negative: since 2015 the index has closed higher on only 45% of them.
How to read an FOMC statement
The statement is released at 2:00 p.m. ET on the second day of each meeting. It is short, and almost every word is chosen against the previous statement, so the most useful way to read it is side by side with the last one. The Fed does not publish a marked-up comparison, so readers do it themselves. Look at five parts:
- The economic assessment. The opening sentences describe growth, jobs and inflation. In September 2026, "inflation remains elevated" stayed, while July's line blaming supply shocks in sectors such as energy disappeared — a sign the Committee no longer treated the inflation as temporary.
- The decision sentence. It states the action and the new target range, written in fractions ("3-3/4 to 4 percent").
- The guidance. Any sentence about future policy. September's addition — the hike "will support a timelier return" to 2% — explained the move without promising more. In April 2026, three officials dissented over guidance alone: they backed the hold but opposed the statement's easing bias.
- The vote. Since June 2026 the statements give a tally ("by a 12–0 vote") and name only dissenters, rather than listing every voter. Earlier statements listed each member by name.
- The implementation note. Released with the statement, it sets the administered rates that keep the federal funds rate inside its range, such as interest on reserve balances (3.90% after the September hike) and the discount rate (4.00%).
The Chair's press conference starts at 2:30 p.m. ET, and the minutes follow three weeks later. The September minutes, published on October 7, said most participants expected another increase to be appropriate by year-end and that several viewed the current policy rate as "not restrictive or only mildly restrictive".
How to read the dot plot
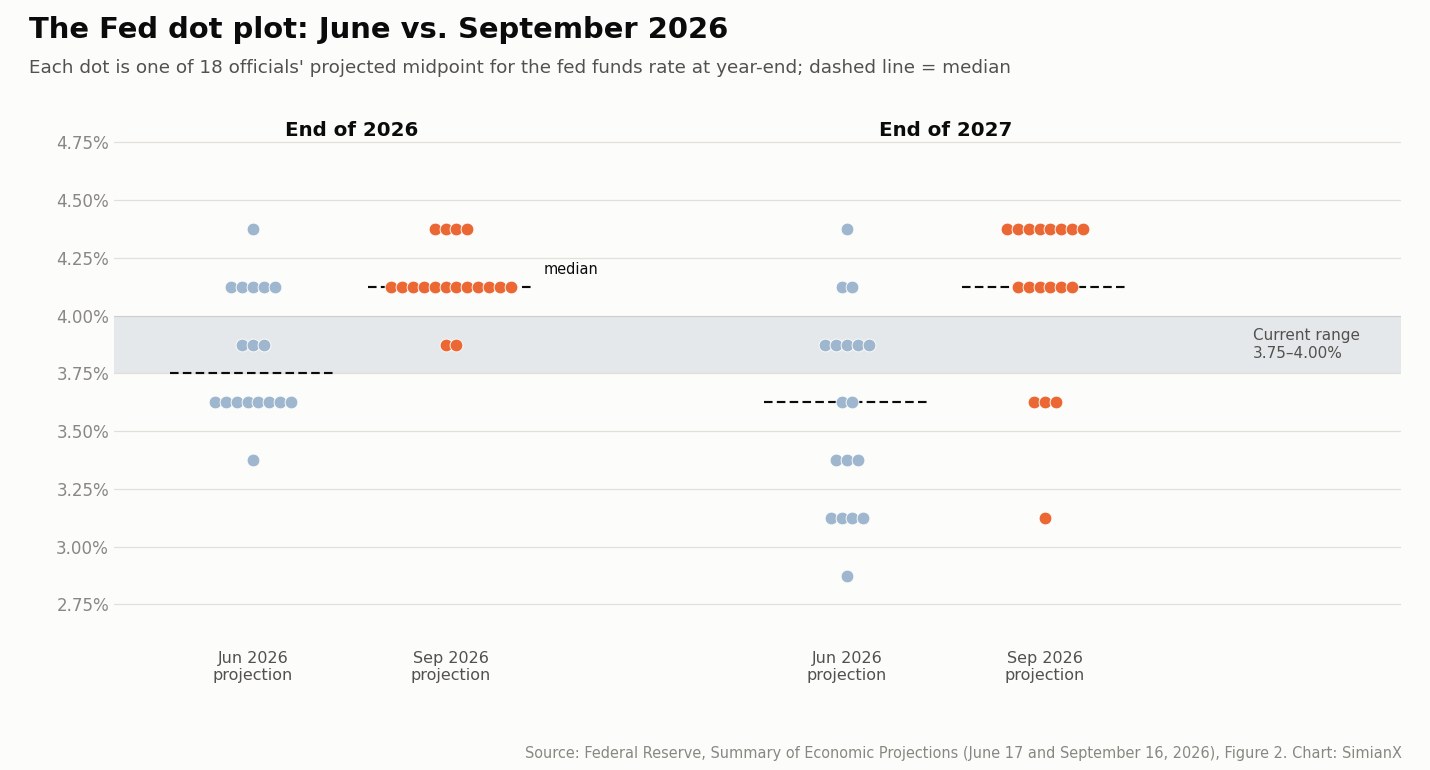
Four times a year — in March, June, September and December — the Fed publishes a Summary of Economic Projections. Its best-known chart, the dot plot, shows where each FOMC participant thinks the federal funds rate should be at the end of each year and in the longer run. Each dot is one official's projected midpoint of the target range. All participants submit projections, including the Reserve Bank presidents who do not vote that year, and the median is the number that makes headlines. The dots are individual views, not a Committee decision or a promise.
To translate dots into moves, compare them with the current midpoint. With the range at 3.75%–4.00%, the midpoint is 3.875%. A dot at 4.125% means one more quarter-point hike by year-end; a dot at 4.375% means two.
| Year-end 2026 midpoint | Target range it implies | June 2026 dots | September 2026 dots |
|---|---|---|---|
| 4.375% | 4.25%–4.50% | 1 | 4 |
| 4.125% | 4.00%–4.25% | 5 | 12 |
| 3.875% | 3.75%–4.00% | 3 | 2 |
| 3.625% | 3.50%–3.75% | 8 | 0 |
| 3.375% | 3.25%–3.50% | 1 | 0 |
| Median | 3.75% | 4.125% |
The table shows how far the Committee moved in three months. In June, the largest group expected no change for the rest of 2026 and one official still expected a cut. In September, 16 of 18 expected at least one more hike. The projections for 2027 rose even more: the median moved from 3.6% to 4.1%, and eight officials placed their 2027 dot at 4.375%. The longer-run median — the Committee's rough estimate of the neutral rate — edged up from 3.1% to 3.2%.
Markets keep their own score. The Atlanta Fed's Market Probability Tracker turns options prices into probabilities for each meeting, which shows whether investors believe the dots.
How this page is updated
How this page is updated: after every FOMC meeting. On each decision day we refresh the "Latest Fed decision" box after the 2:00 p.m. ET statement, add a new row to the history table with the S&P 500 and 10-year Treasury moves at the close, move the "next meeting" date forward and, at the four projection meetings, replace the dot-plot section. When the minutes are released three weeks later, we add their key line to the summary. Last updated: October 15, 2026. No FOMC meeting has taken place since September 16; the next update follows the October 28 decision.
Follow the next Fed decision with SimianX
On a Fed afternoon the first job is telling signal from noise. SimianX's Market Pulse scores breaking headlines as they land, so the statement, the press-conference soundbites and the market's reaction arrive ranked by importance. The Live Command Room runs a team of AI agents on any ticker in real time — SPY for the broad market, or rate-sensitive stocks such as JPM and NVDA — and the Auto Digest sends a daily AI briefing if you would rather read than watch. Plans start free.
Frequently asked questions
What is the current Fed interest rate?
The federal funds target range is 3.75%–4.00%, in effect since September 17, 2026. The effective federal funds rate, the average rate banks actually pay each other overnight, was 3.88% on October 14, 2026.
Did the Fed raise or cut rates in September 2026?
It raised them. On September 16, 2026 the FOMC voted 12–0 to lift the target range by a quarter point to 3.75%–4.00%, its first hike since July 2023.
When is the next Fed rate decision?
The next decision is at 2:00 p.m. ET on Wednesday, October 28, 2026, at the end of the October 27–28 meeting. After that, the Fed meets December 8–9, 2026, with a decision on December 9.
Will the Fed raise rates again in 2026?
The September dot plot points that way — the median official expects the range to end 2026 at 4.00%–4.25%, one more quarter-point hike — and the minutes say most participants saw another increase as likely appropriate by year-end. Projections are not promises; the decision will depend on inflation and jobs data before the October and December meetings.
How many times has the Fed changed rates since 2022?
Eighteen times: 11 hikes from March 2022 to July 2023, six cuts from September 2024 to December 2025, and one hike in September 2026.
What time is the Fed announcement?
The FOMC statement is released at 2:00 p.m. Eastern Time on the last day of each meeting, and the Chair's press conference starts at 2:30 p.m. ET.
What is the dot plot?
It is a chart in the Fed's quarterly Summary of Economic Projections showing where each official expects the federal funds rate to be at the end of the next few years and in the longer run. The median dot is widely read as the Committee's expected path, but each dot is an individual projection.
How do stocks react to Fed rate decisions?
Inconsistently. Since 2022 the S&P 500 closed higher on 15 of 38 decision days. Hike days were the most volatile, with an average move of 1.50%, and the market's reaction usually depended more on the guidance than on the decision itself.
Methodology and sources
- Decisions, ranges and votes are taken from each FOMC statement on federalreserve.gov and checked against the Fed's table of target-rate changes. Votes are counts of voting members for and against the policy action as reported in each statement.
- Projections are from the Summary of Economic Projections of June 17 and September 16, 2026 (Table 1 and Figure 2). The minutes quote is from the minutes of the September 15–16 meeting.
- S&P 500 changes are close-to-close price changes on decision day from Yahoo Finance, cross-checked against CNBC's index history and FRED; all three matched for every meeting.
- 10-year yield changes use the U.S. Treasury's daily par yield curve, cross-checked against CNBC's closing yields, which moved in the same direction at 36 of 38 meetings and differed by 1.6 basis points on average because the two sources record yields at slightly different times of day.
- Effective federal funds rate from the New York Fed. Data compiled October 15, 2026. This page is for information only and is not investment advice.
Related Reading
- US CPI Report: Latest Inflation Data and Release Schedule
- FOMC Meeting Dates 2027: How the S&P 500 Moves on Fed Days
- Every Fed Rate-Hike Cycle Since 1983: S&P 500 & Chip Stocks
- Every Fed Rate-Cut Cycle Since 1980: Stocks, Bonds & Gold
- Yield Curve Inversions and US Recessions: A Reference Table
- Warsh Ignores Trump: The Fed's First Rate Hike Since 2023
- Warsh's First Fed Meeting 2026: Dot Plot Flips to Hike
- Bitcoin After Every Fed Rate Cut: 2019-2026 Reference
References
- Federal Reserve — FOMC statement, September 16, 2026
- Federal Reserve — Implementation note, September 16, 2026
- Federal Reserve — Summary of Economic Projections, September 16, 2026
- Federal Reserve — Minutes of the FOMC, September 15–16, 2026
- Federal Reserve — Target federal funds rate changes
- Federal Reserve — FOMC meeting calendars
- Federal Reserve — Kevin Warsh, Chairman
- Federal Reserve — Why the Fed aims for 2 percent inflation
- Federal Reserve Bank of New York — Effective federal funds rate
- Federal Reserve Bank of Atlanta — Market Probability Tracker
- U.S. Treasury — Daily Treasury par yield curve rates
- FRED — S&P 500 daily index (SP500)
- Wikipedia — Federal Open Market Committee