Reading Ericsson's Third Quarter Against the Quarter It Is Compared With
Ericsson reported its third quarter on October 15, 2026, and the headline looked bad: adjusted EBITA down 36%, net income down 49%, diluted earnings per share down 47%. The shares rose anyway — ERIC B closed up 6.8% in Stockholm after touching +10.9%, and the Nasdaq ADR gained 11.8%.
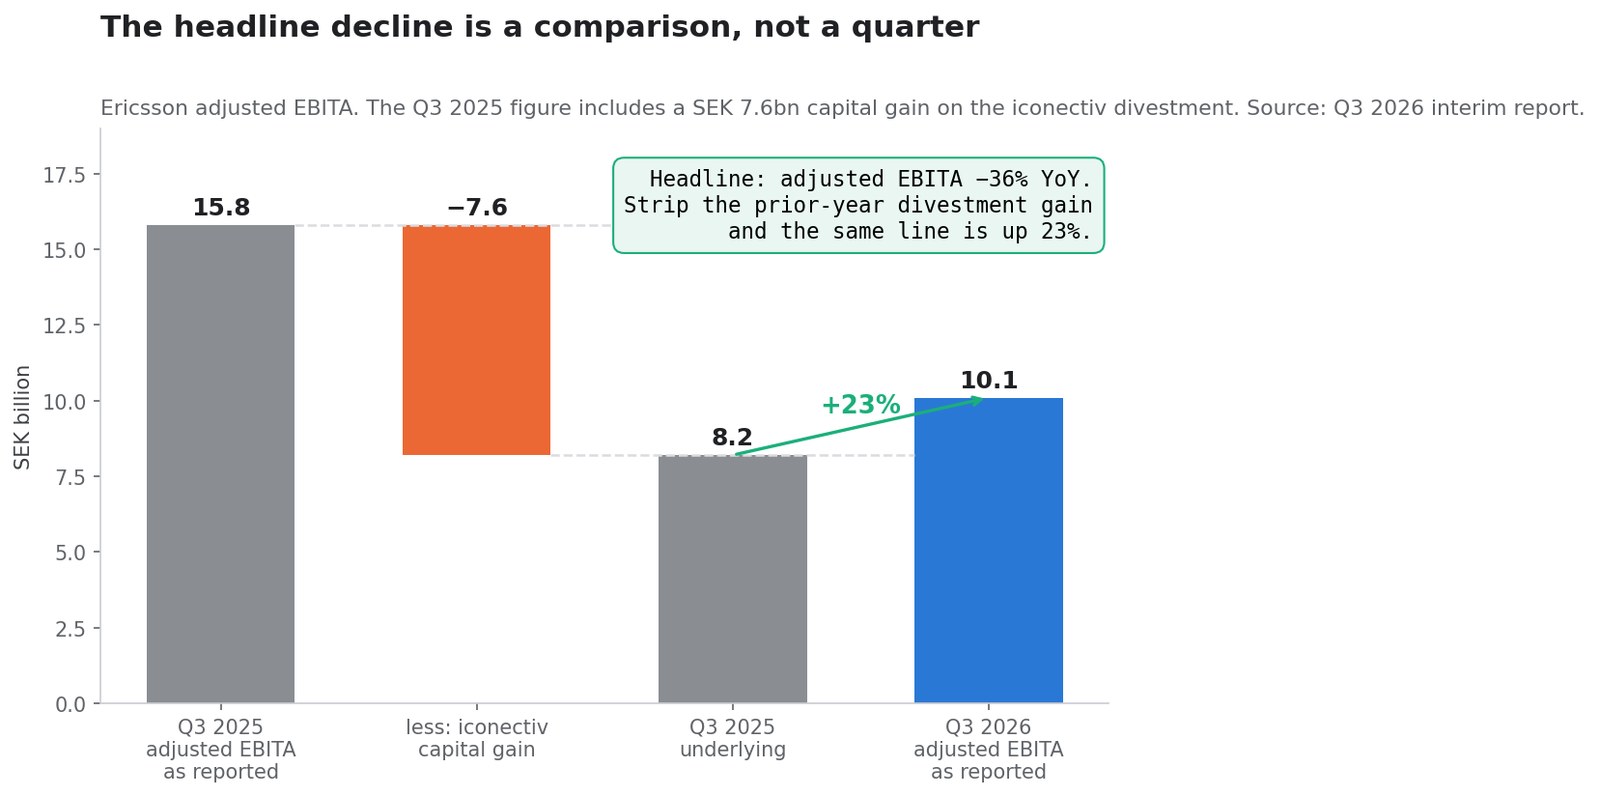
Both facts are correct. The reconciliation sits in one line of the report: the third quarter of 2025 contained a SEK 7.6 billion capital gain on the sale of iconectiv. Strip it out and the same adjusted EBITA line went from SEK 8.2 billion to SEK 10.1 billion — up 23%.
This page is a ledger, not a reaction. It separates what grew from what was compared, prices the part of the improvement that came from licensing rather than radios, sets what management guided in July against what it delivered in October, and records what the company said about 2027. Every figure comes from a document filed with the SEC: Ericsson's Q3 2026 interim report, its Q2 2026 interim report, the same-day reorganisation announcement, and the June 2026 CEO change.
Figures reflect documents published through October 15, 2026. All amounts are Swedish krona unless stated. This is research and education, not personalized investment advice.
The Comparison, Not the Quarter
Three numbers in the release fall by roughly half. All three are measured against a quarter that contained a one-off disposal gain.
| Line | Q3 2026 | Q3 2025 as reported | Q3 2025 excluding the gain | Change on the clean basis |
|---|---|---|---|---|
| Adjusted EBITA | SEK 10.1bn | SEK 15.8bn | SEK 8.2bn | +23% |
| Adjusted EBITA margin | 17.0% | 28.1% | 14.6% | +240bp |
| Diluted EPS | SEK 1.77 | SEK 3.33 | SEK 1.61 | +9.9% |
The SEK 7.6 billion sat in "other operating income and expenses", which fell from SEK 7.7 billion to SEK 0.1 billion year over year. The report states it plainly: EBITA "decreased to SEK 9.2 (15.5) b. reflecting a SEK 7.6 b. capital gain in the prior-year period as well as higher restructuring charges. Profitability improved excluding the capital gain."
The EPS line needs the same treatment. Ericsson notes that "prior-year EPS included a SEK 1.72 per share divestment gain". SEK 3.33 less SEK 1.72 is SEK 1.61, against SEK 1.77 delivered — a 9.9% increase, not a 47% collapse. The gap between those two descriptions of the same quarter is the entire reason a stock can fall for weeks into a print and then rise 11% on the day.
What the Headline Numbers Actually Were
| Measure | Q3 2026 | Q3 2025 | Change | Jan–Sep 2026 | Jan–Sep 2025 |
|---|---|---|---|---|---|
| Net sales | SEK 59.5bn | SEK 56.2bn | +6% reported, +7% organic | SEK 161.5bn | SEK 167.4bn |
| Gross income | SEK 28.0bn | SEK 26.8bn | +5% | SEK 75.4bn | SEK 80.0bn |
| Adjusted gross margin | 47.7% | 48.1% | −40bp | 48.0% | 48.2% |
| Adjusted EBITA | SEK 10.1bn | SEK 15.8bn | −36% | SEK 22.6bn | SEK 30.2bn |
| EBIT | SEK 8.9bn | SEK 15.2bn | −41% | SEK 16.2bn | SEK 27.5bn |
| Net income | SEK 5.8bn | SEK 11.3bn | −49% | SEK 10.8bn | SEK 20.1bn |
| Diluted EPS | SEK 1.77 | SEK 3.33 | −47% | SEK 3.24 | SEK 5.94 |
| Free cash flow before M&A | SEK 4.9bn | SEK 6.6bn | −26% | SEK 11.2bn | SEK 11.9bn |
| Net cash, end of period | SEK 60.7bn | SEK 51.9bn | +17% | — | — |
Two cost lines are worth keeping in view. Restructuring charges were SEK −0.9 billion against SEK −0.3 billion a year earlier, and for the nine months they reached SEK −5.3 billion against SEK −1.2 billion. Financial income and expenses swung to SEK −0.9 billion from SEK −0.2 billion, which the company attributes to provisions for interest on the resolution of tax matters plus a currency hedge effect. Neither is in the adjusted number; both are real cash or near-cash.
The tax line carries a forward signal: Ericsson now expects a 28% effective tax rate for the full year, against 25% in 2025, "mainly reflecting the impact of elevated restructuring costs and provisions for resolutions of tax matters."
What Was Guided in July and What Arrived in October
This is the part a single-day headline cannot carry, and it is the cleanest available test of whether the quarter was a surprise or a plan.
In the Q2 report dated July 14, 2026, Ericsson published its planning assumptions for the third quarter. The Q3 report then disclosed the outcome.
| Guided on July 14 | What that meant numerically | Delivered on October 15 |
|---|---|---|
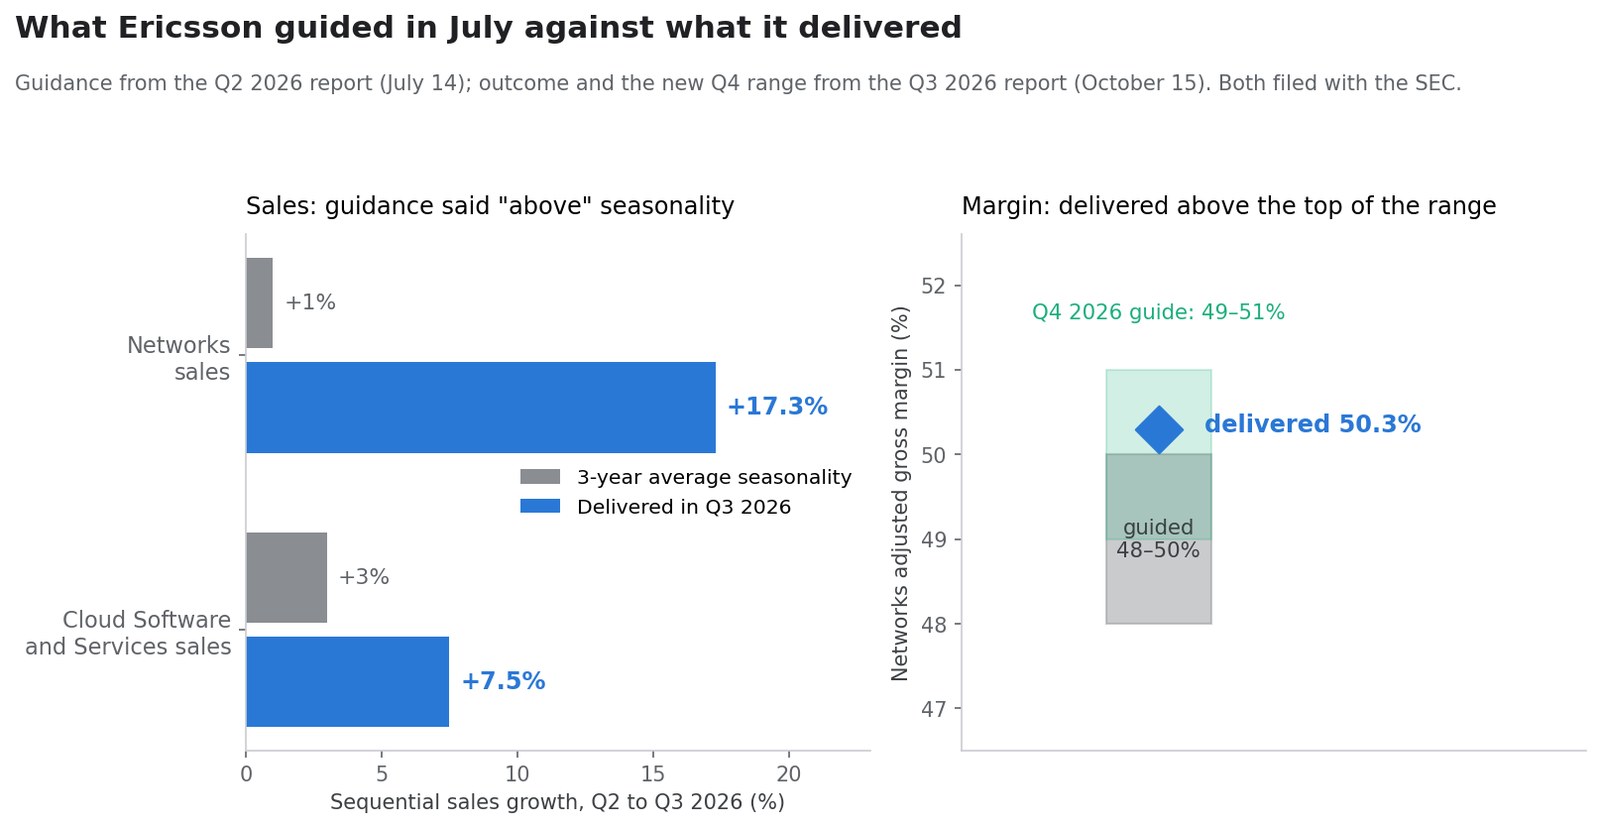
| Networks sales growth "above" 3-year average seasonality | 3-year average Q2→Q3 is +1% | +17.3% (SEK 33.0bn → SEK 38.7bn) |
| Networks adjusted gross margin of 48% to 50% | — | 50.3% — above the top of the range |
| Cloud Software and Services growth "broadly similar" to seasonality | 3-year average Q2→Q3 is +3% | +7.5% (SEK 14.7bn → SEK 15.8bn) |
| Q3 currency assumption USD:SEK 9.7, EUR:SEK 11.0 | — | Spot was near SEK 9.94 to the dollar on the reporting day |
Management told the market to expect a better-than-seasonal quarter in Networks and delivered seventeen times the three-year average sequential move. That is the beat. It is also why the forward guidance matters more than the backward comparison.
For the fourth quarter, Ericsson now assumes USD:SEK 10.0 and EUR:SEK 11.3, expects Networks and Cloud Software sales growth "broadly similar" to three-year seasonality — which for Networks is +17% and for Cloud Software is +29% sequentially — and guides the Networks adjusted gross margin to 49% to 51%, a full point above the range it set three months ago.
The Segment Ledger
| Segment | Q3 2026 sales | Organic growth | Adjusted EBITA | Adjusted EBITA margin | Rolling four quarters |
|---|---|---|---|---|---|
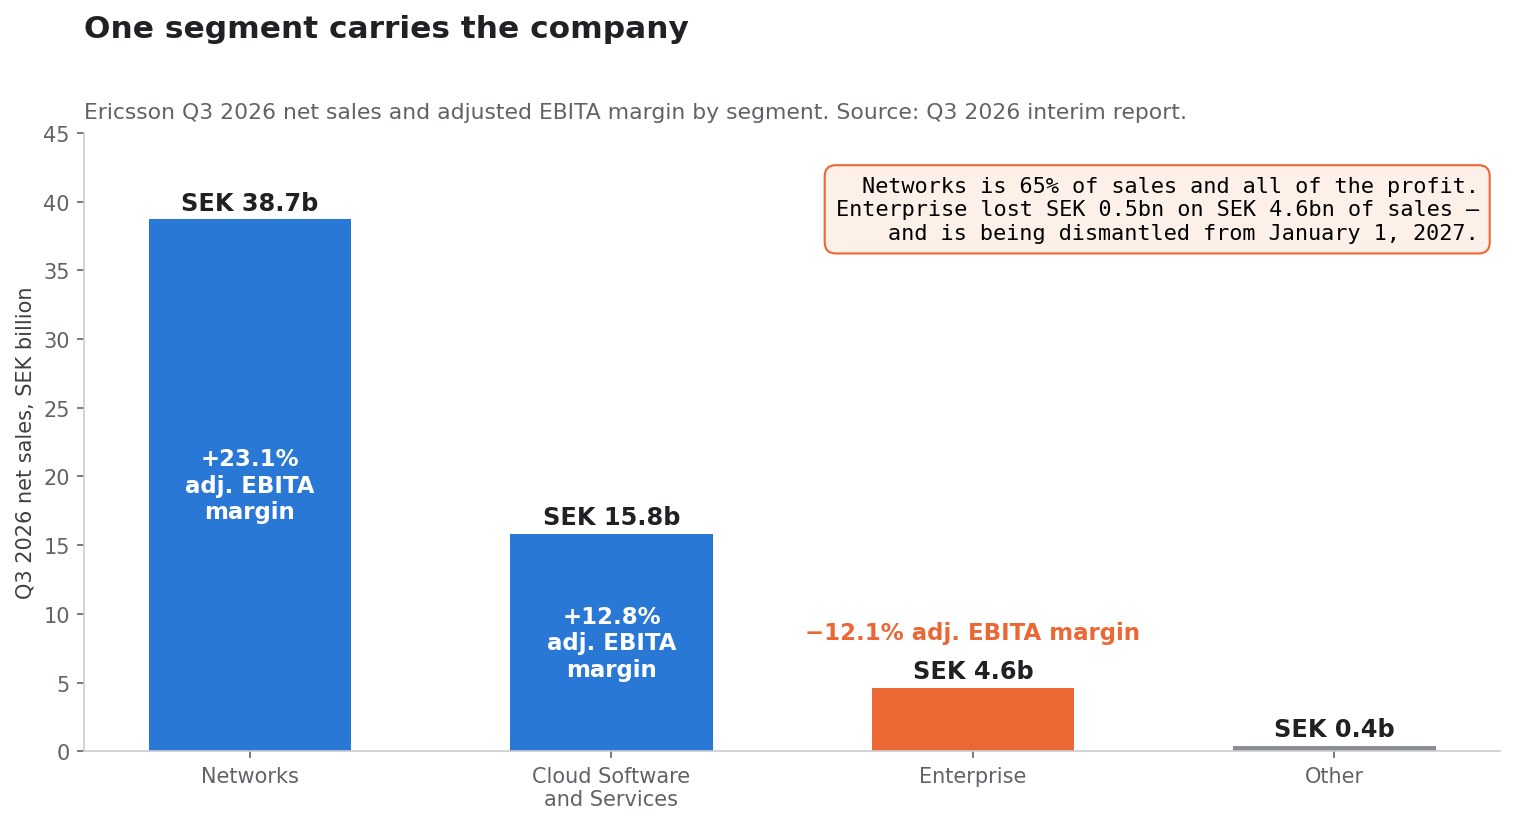
| Networks | SEK 38.7bn | +9% | SEK 9.0bn | 23.1% (20.3%) | SEK 148.9bn at 21.0% |
| Cloud Software and Services | SEK 15.8bn | +3% | SEK 2.0bn | 12.8% (12.5%) | SEK 62.4bn at 13.1% |
| Enterprise | SEK 4.6bn | +1% | SEK −0.5bn | −12.1% (138.7%) | SEK 17.8bn at −22.2% |
| Other | SEK 0.4bn | — | — | — | — |
Networks is 65% of group sales and effectively all of the group's profit. Its adjusted EBITA margin of 23.1% is the highest quarterly figure in the three columns the report prints, and the rolling four-quarter margin of 21.0% shows this is not a single-quarter artefact.
The Enterprise comparison looks absurd — a 138.7% margin a year ago against −12.1% now — because the SEK 7.6 billion iconectiv gain was booked inside that segment. Stripping it, Enterprise lost money then as it loses money now. On a rolling four-quarter basis it is a SEK 17.8 billion business running at −22.2%, which is roughly SEK 4 billion of annual operating loss against a group that earns about SEK 35 billion at the segment line.
That number is the reason for the structural announcement made on the same day.
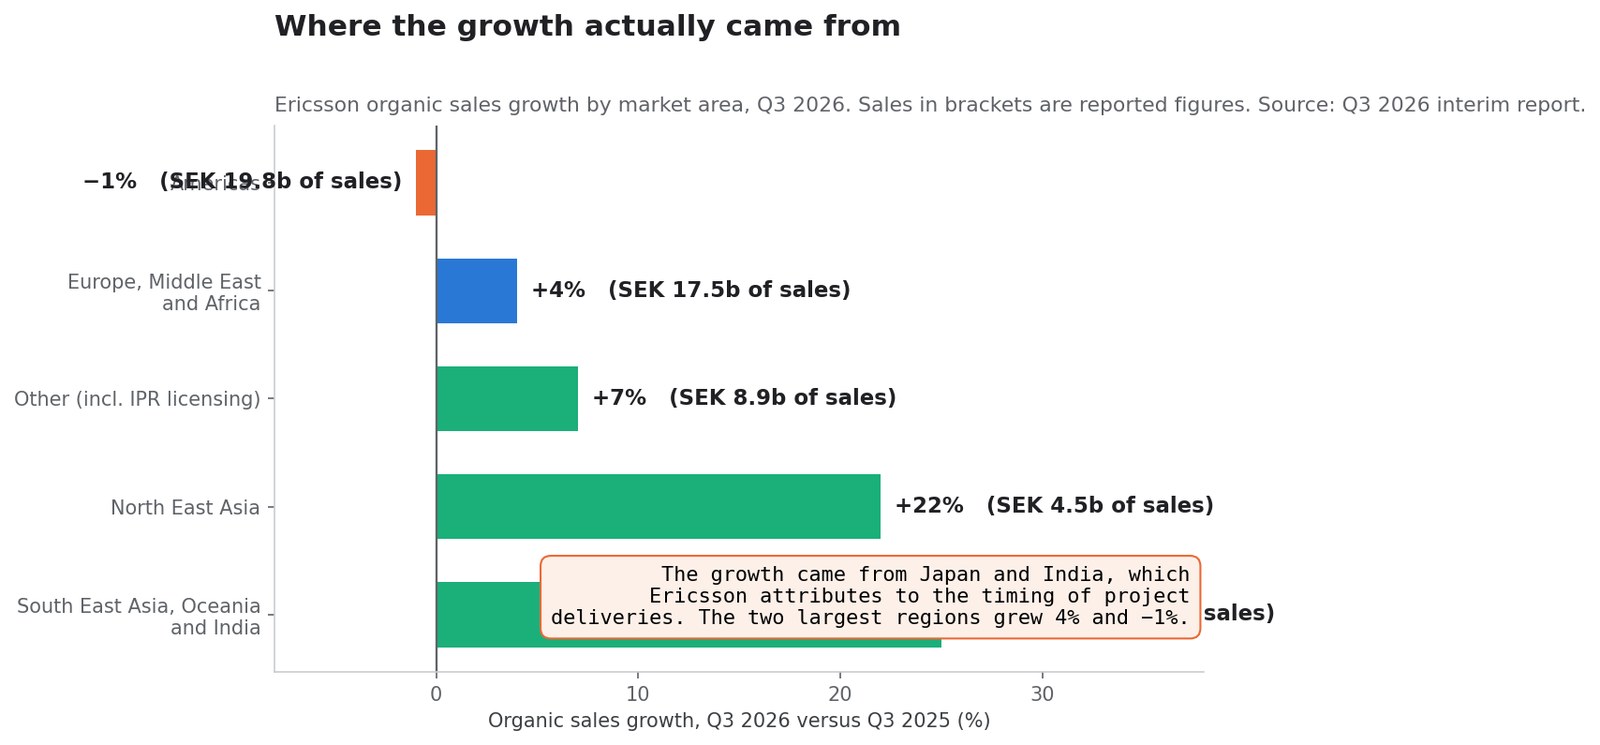
Where the Growth Actually Came From
| Market area | Q3 2026 sales | Organic growth | Jan–Sep organic |
|---|---|---|---|
| Americas | SEK 19.8bn | −1% | −1% |
| Europe, Middle East and Africa | SEK 17.5bn | +4% | +5% |
| South East Asia, Oceania and India | SEK 8.8bn | +25% | +14% |
| North East Asia | SEK 4.5bn | +22% | +15% |
| Other (includes IPR licensing) | SEK 8.9bn | +7% | +1% |
| Total | SEK 59.5bn | +7% | +4% |
The two regions that grew at double-digit rates are the two smallest, and Ericsson attributes both to timing rather than demand: in North East Asia growth was "primarily driven by Japan, supported by higher project deliveries"; in South East Asia, Oceania and India it came from "the timing of project deliveries in South East Asia and India".
Americas — the largest region at a third of group sales — declined 1% organically, with "slight growth in North America offset by lower sales in Latin America". For the nine months Americas is down 1% organically and down 8% reported.
That asymmetry is the honest version of the bear case. A quarter whose sequential growth is 17 times the three-year seasonal average, concentrated in the regions where management explicitly names delivery phasing, has borrowed something from the quarters on either side of it. Ericsson's own Q4 guidance — growth "broadly similar" to seasonality rather than above it — is consistent with that reading.
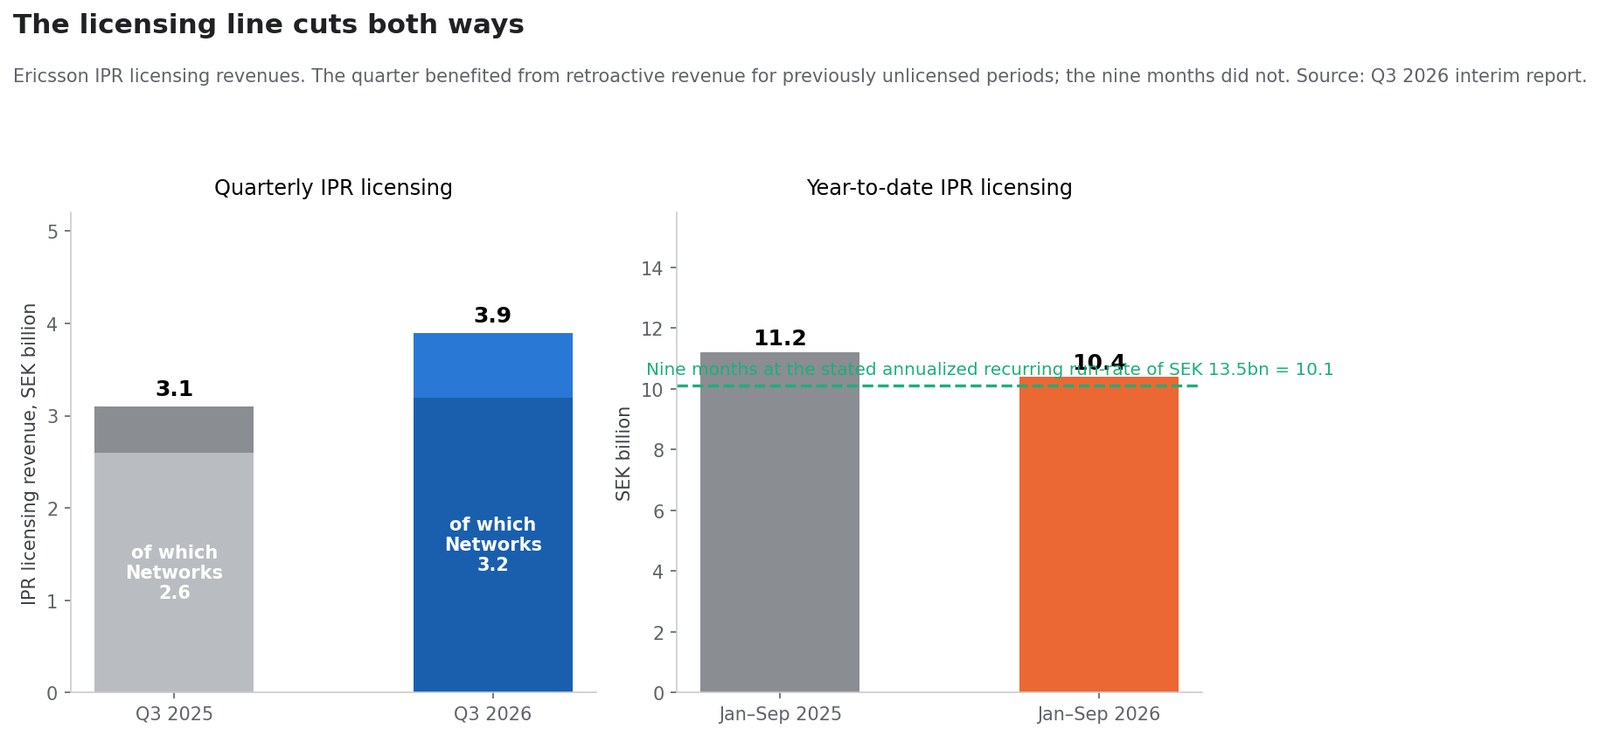
The Licensing Line Cuts Both Ways
Intellectual-property licensing is the highest-margin revenue Ericsson has, and it moved this quarter.
| IPR licensing revenue | Q3 2026 | Q3 2025 | Jan–Sep 2026 | Jan–Sep 2025 |
|---|---|---|---|---|
| Group total | SEK 3.9bn | SEK 3.1bn | SEK 10.4bn | SEK 11.2bn |
| Of which in Networks | SEK 3.2bn | SEK 2.6bn | — | — |
| Of which in Cloud Software and Services | SEK 0.7bn | SEK 0.6bn | — | — |
Ericsson says the quarterly increase "was partly driven by retroactive revenue related to previously unlicensed periods" and puts 82% of IPR licensing revenues in segment Networks. It also discloses an annualized recurring IPR run-rate of approximately SEK 13.5 billion, which works out to about SEK 10.1 billion over nine months.
Both halves of the table matter. The quarter was helped by retroactive licensing; the nine months were hurt by the absence of the larger retroactive revenue booked in 2025. Year to date, IPR is down SEK 0.8 billion. A reader who credits the Q3 licensing tailwind should also debit the year-to-date licensing headwind.
How Much of the Improvement Was Radios and How Much Was Royalties
This is the reader's arithmetic, not the company's, and it rests on one assumption stated openly: licensing revenue carries almost no incremental cost, so an increase in IPR drops close to fully into EBITA.
- Group adjusted EBITA, excluding the prior-year gain, improved by SEK 1.9 billion (SEK 8.2bn → SEK 10.1bn).
- Group IPR licensing revenue rose by SEK 0.8 billion (SEK 3.1bn → SEK 3.9bn).
- On that assumption, licensing accounts for roughly 42% of the improvement.
The same test inside Networks:
- Networks adjusted EBITA rose SEK 1.8 billion (SEK 7.2bn → SEK 9.0bn).
- Networks IPR rose SEK 0.6 billion (SEK 2.6bn → SEK 3.2bn).
- Licensing therefore explains about one third of the Networks improvement.
That still leaves roughly SEK 1.1 billion of Networks profit improvement from the equipment business itself, on 9% organic sales growth, with the report crediting "a positive impact from product mix and retroactive IPR licensing revenues, partly offset by increased component costs". The operating improvement is real. It is just smaller than the headline margin expansion implies, and part of it does not recur at the same size.
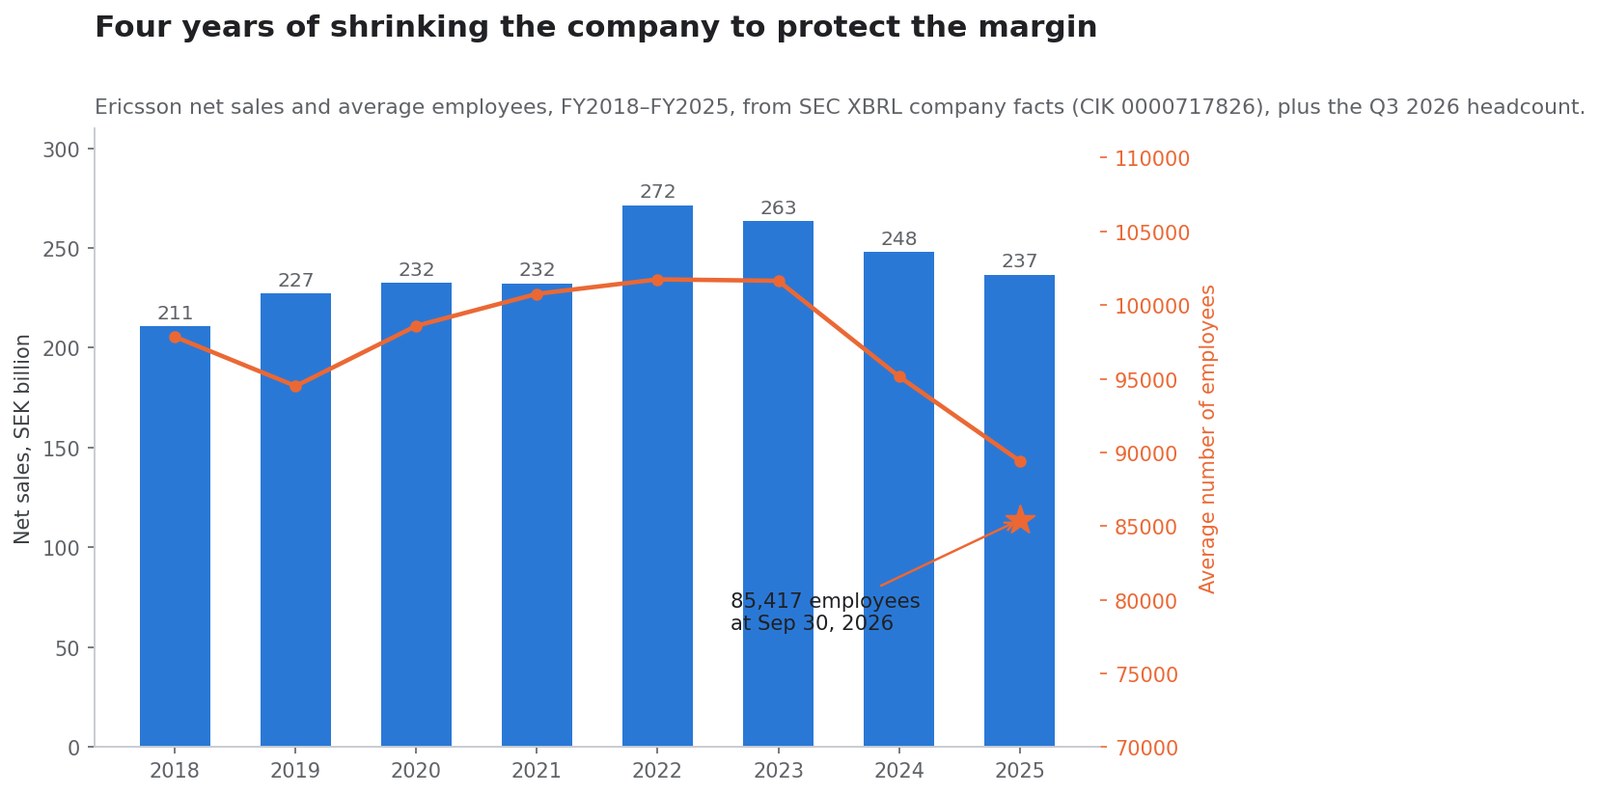
Four Years of Shrinking the Company to Protect the Margin
| Fiscal year | Net sales | Average employees |
|---|---|---|
| 2018 | SEK 210.8bn | 97,843 |
| 2019 | SEK 227.2bn | 94,503 |
| 2020 | SEK 232.4bn | 98,589 |
| 2021 | SEK 232.3bn | 100,757 |
| 2022 | SEK 271.5bn | 101,741 |
| 2023 | SEK 263.4bn | 101,644 |
| 2024 | SEK 247.9bn | 95,154 |
| 2025 | SEK 236.7bn | 89,425 |
Source: SEC XBRL company facts, CIK 0000717826.
Revenue peaked in 2022 at SEK 271.5 billion and has fallen 12.8% since. Average headcount peaked the same year and is down 12.1%. The headcount reduction has continued past the annual data: 85,417 employees at September 30, 2026, against 86,536 three months earlier and 89,898 a year earlier — 4,481 fewer people year over year, or 5.0%.
This is the mechanism behind the margin story. Networks' adjusted EBITA margin went from 20.3% to 23.1% in a year while the company employed 5% fewer people and spent SEK 48.9 billion on R&D in 2025 against SEK 53.5 billion in 2024. Cost discipline of that kind improves a margin reliably and improves a growth rate not at all.
A New Chief Executive and a Day-One Reorganisation
The Q2 report in July carried a comment from Börje Ekholm. The Q3 report carries one from Per Narvinger, who writes that he is "excited to lead the company in this period of rapid technology change."
The handover is documented. On June 16, 2026 Ericsson announced that Narvinger, then head of Business Area Networks, would become President and CEO, with Ekholm stepping down on September 30, 2026 and acting as executive advisor until June 15, 2027. On June 18 the company named David Hammarwall head of Business Area Networks, effective October 1, 2026.
Q3 2026 is therefore the handover quarter: the results were earned under one chief executive and presented by another, on his first reporting day.
He used that day to announce a restructure, filed as a separate press release:
- Market Areas North East Asia and South East Asia, Oceania and India merge into a single Asia-Pacific market area from January 1, 2027, headed by Patrick Johansson, currently head of EMEA. A search for a new EMEA head begins.
- Business Area Enterprise Wireless Solutions is dismantled. Neutral Host and Ericsson Private 5G move into Business Area Networks; Wireless WAN becomes a standalone business reporting to the head of Market Area Americas.
- Three executive team members — Åsa Tamsons, Chafic Nassif and Andres Vicente — transition out of their positions on December 31, 2026.
Read against the segment table, the logic is not subtle. The two market areas being merged are the two smallest. The business area being broken up is the one losing SEK 4 billion a year on a rolling basis. A new chief executive is consolidating the parts that do not pay for themselves into the part that does.
What the Balance Sheet Looks Like
| Item | September 30, 2026 | Comparison |
|---|---|---|
| Gross cash | SEK 98.0bn | up SEK 6.7bn sequentially |
| Net cash | SEK 60.7bn | SEK 51.9bn a year earlier, +17% |
| Liabilities for post-employment benefits | SEK 14.3bn | SEK 18.0bn at June 30 |
| Average maturity of parent company borrowings | 2.9 years | 2.5 years at June 30 |
| Shares outstanding, basic | 3,257m | 3,333m a year earlier, −2.3% |
| Treasury shares | 114.1m | 38.0m at December 31, 2025 |
Financing cash flow was a SEK 0.4 billion inflow, combining SEK 4.5 billion of share repurchases with SEK 5.5 billion of new borrowings, reflecting a EUR 500 million bond issued in September. In the quarter Ericsson repurchased 49,225,701 Class B shares for SEK 4.8 billion; year to date the figure is 78,761,682 shares for SEK 8.1 billion.
Operating cash flow was SEK 6.5 billion against SEK 7.9 billion, with the report flagging "higher inventories, reflecting timing of project deliveries and higher component prices". The same pressure that management warns about for 2027 is already visible in working capital.
What Ericsson Told You About 2027
Four forward statements sit in the report, and three of them are warnings:
- "The RAN market is flat." Ericsson's own cited source agrees: Dell'Oro estimates the global radio access network equipment market will remain stable in 2026.
- "Component costs are a headwind to gross margin next year." This appears in the CEO comment and again in the Networks margin discussion, where increased component costs partly offset a favourable mix.
- "Restructuring charges for 2026 are expected to be at elevated levels", and the full-year tax rate rises to 28% partly because of them.
- The one positive: the Networks adjusted gross margin guide moves up to 49–51% for the fourth quarter, from 48–50% three months ago.
A company that guides its most important margin higher for the next quarter while warning that input costs bite the year after is telling you where the hinge is. The question for 2027 is not demand — management has already said the market is flat — but whether pricing, mix and the reorganisation can absorb a component bill that is rising.
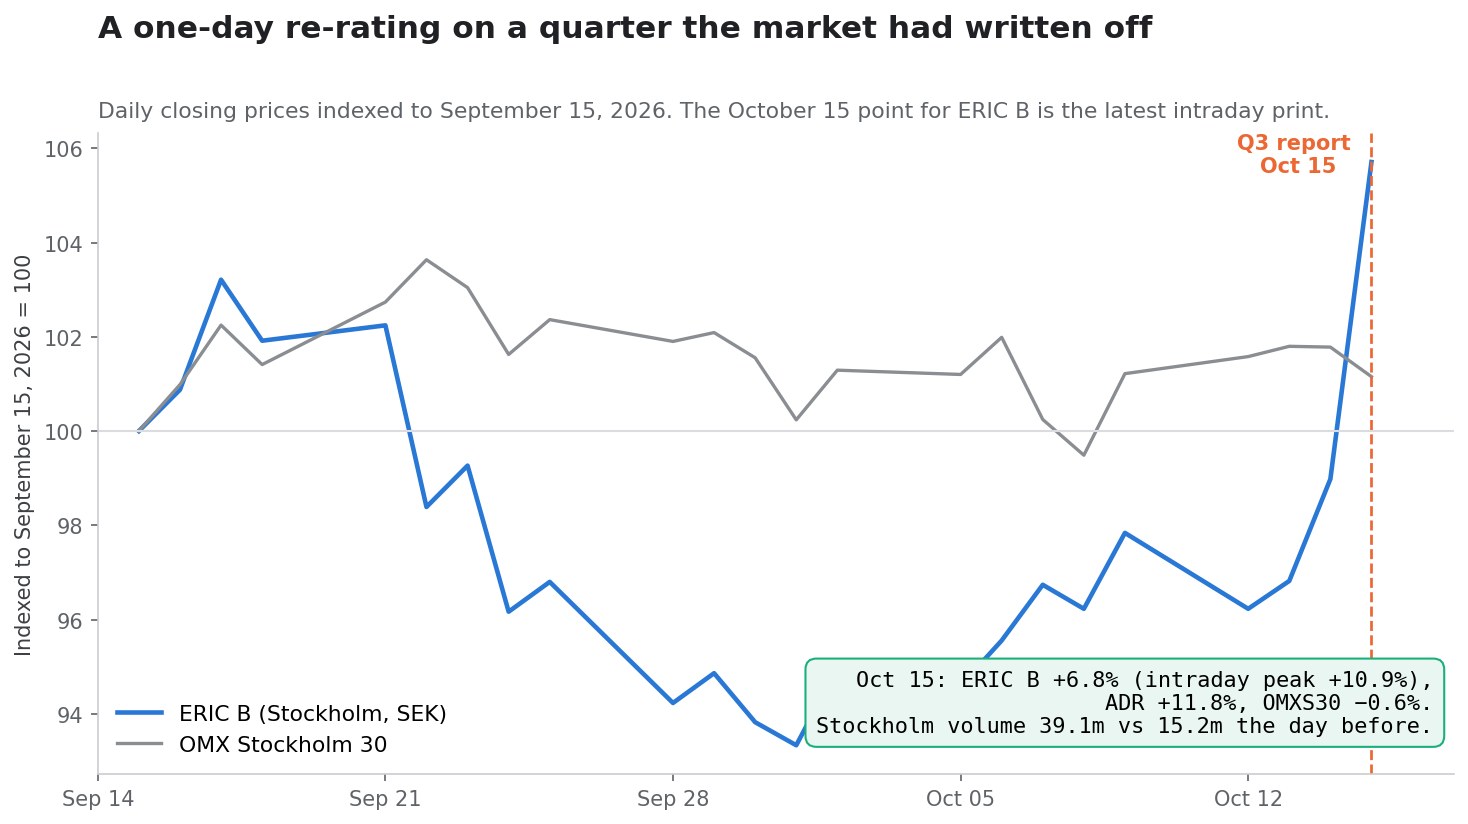
How the Market Priced It
| Listing | Previous close | October 15 | Change | Volume |
|---|---|---|---|---|
| ERIC B (Stockholm, SEK) | 97.10 | 103.70, intraday high 107.65 | +6.8%, peak +10.9% | 39.1m vs 15.2m |
| ERIC ADR (Nasdaq, USD) | 9.58 | 10.71 | +11.8% | 41.0m vs 18.9m |
| OMX Stockholm 30 | 3,276.27 | 3,256.08 | −0.62% | — |
Two details keep this honest. First, the two listings disagree because they are priced in different currencies and closed at different times; at SEK 103.70 and a dollar rate near 9.94, the ordinary share is worth about USD 10.44 against an ADR at USD 10.71. Second, the move started from a depressed base: ERIC B went into the print about 23.7% below its six-month high.
The market was positioned for the headline and repriced on the bridge. That is what a 2.6-times volume day on an 11% ADR move looks like.
Valuation After the Move
At SEK 103.70 and 3,257 million shares outstanding, Ericsson's market capitalization is approximately SEK 338 billion, or roughly USD 34 billion. Net cash of SEK 60.7 billion gives an enterprise value near SEK 277 billion.
Against that, the rolling four-quarter adjusted EBITA disclosed for the three reporting segments sums as follows:
| Segment | Rolling four-quarter sales | Adjusted EBITA margin | Implied adjusted EBITA |
|---|---|---|---|
| Networks | SEK 148.9bn | 21.0% | SEK 31.3bn |
| Cloud Software and Services | SEK 62.4bn | 13.1% | SEK 8.2bn |
| Enterprise | SEK 17.8bn | −22.2% | SEK −4.0bn |
| Sum of the three segments | — | — | SEK 35.5bn |
That puts the enterprise value at roughly 7.8 times segment-level adjusted EBITA. The figure excludes segment Other and any unallocated corporate cost, so treat it as an anchor rather than a precise multiple — but it frames the question correctly. A buyer at this price is paying under eight times for a business whose largest segment earns a 21% margin, and is being handed SEK 60.7 billion of net cash, in exchange for accepting a flat end market and a component-cost headwind.
The arithmetic that would change it is straightforward. If the Enterprise loss of roughly SEK 4 billion a year disappears through the reorganisation — not an unreasonable base case given the business is being broken up — the same enterprise value sits on about SEK 39.5 billion, or 7.0 times. Fixing a loss-making segment is worth more to this multiple than a point of RAN growth.
Scenarios
| Scenario | What has to be true | Financial path | Valuation implication |
|---|---|---|---|
| Bull | Q4 lands on the raised 49–51% Networks margin guide; the reorganisation removes most of the Enterprise loss during 2027; component costs are offset by pricing and mix | Group adjusted EBITA margin holds in the high teens; buybacks continue near SEK 4–5bn a quarter | The multiple re-rates toward the historical premium as the loss-making segment stops subtracting |
| Base | Asian project phasing reverses in the next two quarters; RAN stays flat as Dell'Oro expects; component costs cost a point of gross margin in 2027, partly offset | Sales broadly flat organically; margins hold through cost reduction rather than growth | Roughly the current multiple, with the net cash doing the work |
| Bear | The Q3 strength was pulled forward; Americas stays negative; component inflation exceeds the pricing response; restructuring stays elevated past 2026 | Adjusted EBITA margin slips back toward the 14% nine-month level; buyback pace slows | Back toward the level the shares traded at before the print |
The base case is not "annualise the third quarter". It is that a 17%-above-seasonal quarter in a flat market is a timing event, and the durable improvements — headcount, mix, the Enterprise restructure — are the ones worth capitalising.
What Would Settle It
The thesis resolves on disclosures, not on a single quarter:
- The Q4 Networks adjusted gross margin against the 49–51% guide. Ericsson has now beaten the top of its own range once; doing it twice would say pricing is holding against component costs.
- Americas organic growth. Down 1% in the quarter and down 1% for nine months. The largest region has to turn before "recovery" means anything.
- Whether Asia gives back the quarter. North East Asia +22% and South East Asia, Oceania and India +25% were both attributed to delivery timing. Watch Q4 and Q1.
- Year-to-date IPR licensing. SEK 10.4 billion against the SEK 13.5 billion annualized run-rate implies a soft fourth quarter unless new agreements land.
- Enterprise losses after the break-up. The segment disappears as a reporting unit from January 1, 2027. Watch whether the loss disappears with it or simply relocates into Networks.
- Restructuring charges in 2027. Guided "elevated" for 2026; a second elevated year would mean the reorganisation is costing more than it saves.
- The effective tax rate. 28% expected for 2026 against 25% in 2025, driven partly by tax-matter provisions.
- Buyback pace. SEK 8.1 billion year to date and a share count down 2.3%. A slowdown without an earnings explanation would signal the balance sheet is being conserved.
- Headcount. 85,417 and falling. The margin story depends on it; so does execution risk.
You can wire several of these into an automated watchlist with SimianX AI's stock tools, which track filings, segment disclosures and price reactions together:
- SimianX AI — the research platform
- Live analysis command room — real-time multi-agent analysis of
ERIC - Market Pulse — event detection on single names
- Crypto Leaderboard — model-by-model performance tracking
- Points and pricing — how usage works
Frequently Asked Questions
Why did Ericsson stock rise when profit fell 49%?
Because the fall is a comparison effect. The third quarter of 2025 included a SEK 7.6 billion capital gain from selling iconectiv. Excluding it, adjusted EBITA rose from SEK 8.2 billion to SEK 10.1 billion, up 23%, and diluted EPS rose from an underlying SEK 1.61 to SEK 1.77. Sales also grew 7% organically against a market Ericsson itself describes as flat.
Did Ericsson beat its own guidance?
Yes, on both counts it published. In July it guided Networks sales growth "above" three-year average seasonality of +1% sequentially and delivered +17.3%; it guided the Networks adjusted gross margin to 48–50% and delivered 50.3%.
How much of the improvement came from patent licensing?
IPR licensing revenue rose SEK 0.8 billion group-wide, against a SEK 1.9 billion improvement in adjusted EBITA excluding the prior-year gain. Licensing carries almost no incremental cost, so it accounts for roughly 42% of the improvement. Inside Networks the share is about one third.
Is the 5G market recovering?
Not according to the source Ericsson cites. Dell'Oro estimates the global RAN equipment market will remain stable in 2026, and the CEO's own comment states that "the RAN market is flat". Ericsson's growth this quarter came from project timing in Japan and India, higher licensing revenue, and cost reduction — not from a larger market.
Who runs Ericsson now?
Per Narvinger became President and CEO on October 1, 2026, succeeding Börje Ekholm, who stepped down on September 30 and remains an executive advisor until June 15, 2027. The appointment was announced on June 16, 2026. Q3 2026 is Narvinger's first reported quarter.
What is happening to the Enterprise segment?
It is being dismantled. From January 1, 2027, Neutral Host and Ericsson Private 5G move into Business Area Networks and Wireless WAN becomes a standalone business under Market Area Americas. On a rolling four-quarter basis Enterprise is a SEK 17.8 billion business running at a −22.2% adjusted EBITA margin.
What is the biggest risk to 2027?
Component costs. Ericsson states twice in the report that they are a headwind to gross margin next year, and the effect is already visible in inventories. With the RAN market flat, pricing and mix have to carry the offset.
Related Reading
- SpaceX's $8B Spectrum Deal: AT&T, Verizon, T-Mobile Ranked
- Crown Castle's Fourth-Carrier Test: SpaceX vs DISH's Ledger
- SK Hynix Stock Surges 8%: Is the AI Supercycle Real?
References
- Ericsson — third quarter report 2026, filed with the SEC
- Ericsson — second quarter report 2026, filed with the SEC
- Ericsson — simplification of Group structure and Executive Team changes
- Ericsson — Per Narvinger appointed President and CEO as Börje Ekholm steps down
- Ericsson — David Hammarwall appointed Head of Business Area Networks
- SEC EDGAR — LM Ericsson Telephone Company filings, CIK 0000717826
- SEC XBRL — Ericsson company facts
- Dell'Oro Group — mobile radio access network market research