
 By Marcus Reeve
IHSG Annual Returns: Every Calendar Year of the Jakarta Composite Since 1991 and 2026 So Far
Updated October 23, 2026, with Indonesia Stock Exchange closes through October 23, 2026. The 2026 row is refreshed every month; the full table is finalized after the last trading day of December.
Short answer: From 1991 to 2025 the IHSG (Jakarta Composite Index, JCI) rose in 23 of 35 calendar years. Its average annual return was +14.3% and its median +9.4%; compounded, it grew +9.0% a year in rupiah but only +2.5% a year in US dollars. Best year: 1993, +115%. Worst: 2008, −50.6%. Over the last 10 years (2016–2025) it compounded +6.5% a year. 2026 through October 23: −37.1%, at 5,439.26.
This page lists IHSG returns by year for every calendar year from 1991 to 2025, plus 2026 to date. For each year it gives the year-end close, the price return in rupiah, the year-end rupiah exchange rate, the same return measured in US dollars, and the S&P 500's return in the same year, with every year-end close checked against at least two independent sources. It also answers the questions Indonesian investors search for most: the average return of the IHSG per year, how the index did over the last 10 years and the last five, which years were the best and worst, and how deep every major crash went. For the US benchmark on its own, see our S&P 500 returns by year table.
How this page is updated
- Every month: the 2026 row (close, year-to-date return, the Bank Indonesia JISDOR rate, the S&P 500 comparison), the answer box, the chart and the "2026 so far" section are refreshed after the last trading day of the month, and also after any session in which the IHSG closes 5% or more higher or lower.
- Every January: after the Indonesia Stock Exchange's last session of December, the 2026 row becomes a full year and every average, median, compound rate and "last 10 years" window moves forward by one year. Since 2010 the exchange has never traded on December 31, so the year-end close is usually December 29 or 30.
- Corrections: a historical close changes only if the exchange's own statistics disagree with the daily data used here. Every check made so far is listed under the main table.
IHSG historical returns at a glance
| Measure (calendar-year price return) | 1991–2025 | 1996–2025 | 2006–2025 | 2016–2025 | 2021–2025 |
|---|---|---|---|---|---|
| Years | 35 | 30 | 20 | 10 | 5 |
| Up years | 23 (66%) | 20 (67%) | 14 (70%) | 7 (70%) | 4 (80%) |
| Average (arithmetic) | +14.3% | +14.3% | +14.2% | +6.9% | +8.0% |
| Median | +9.4% | +9.2% | +8.1% | +5.1% | +6.2% |
| Compound annual growth (rupiah) | +9.0% | +9.9% | +10.6% | +6.5% | +7.7% |
| Compound annual growth (US$) | +2.5% | +2.8% | +7.6% | +4.5% | +4.0% |
| S&P 500, compound annual (US$) | +9.0% | +8.4% | +8.9% | +12.8% | +12.8% |
| Standard deviation | 35.6 pts | 31.5 pts | 29.1 pts | 9.7 pts | 9.2 pts |
| Best year | +115% (1993) | +87.0% (2009) | +87.0% (2009) | +22.1% (2025) | +22.1% (2025) |
| Worst year | −50.6% (2008) | −50.6% (2008) | −50.6% (2008) | −5.1% (2020) | −2.7% (2024) |
Three things stand out. First, the median year (+9.4%) is well below the average (+14.3%): a handful of huge rebounds — 1993, 2009, 1999 and 2003 — pull the average up, so a "typical" year has been closer to +9% than +14%. Second, the compound rate in rupiah (+9.0% a year from 1991 to 2025, a 20.7x rise from 417.79 to 8,646.94) is almost exactly the same as the S&P 500's price return in dollars over the same 35 years (+9.0%). Third, the rupiah changes the picture: one US dollar cost Rp1,901 at the end of 1990 and Rp16,782 at the end of 2025 (8.8x), so for a dollar-based investor the IHSG compounded only +2.5% a year.
The spread of outcomes is wide. The standard deviation of annual returns since 1991 is 35.6 points, roughly double the S&P 500's 17.0 points over the same period, and the index fell in 12 of the 35 years.
IHSG returns by year: the complete table, 1991–2026
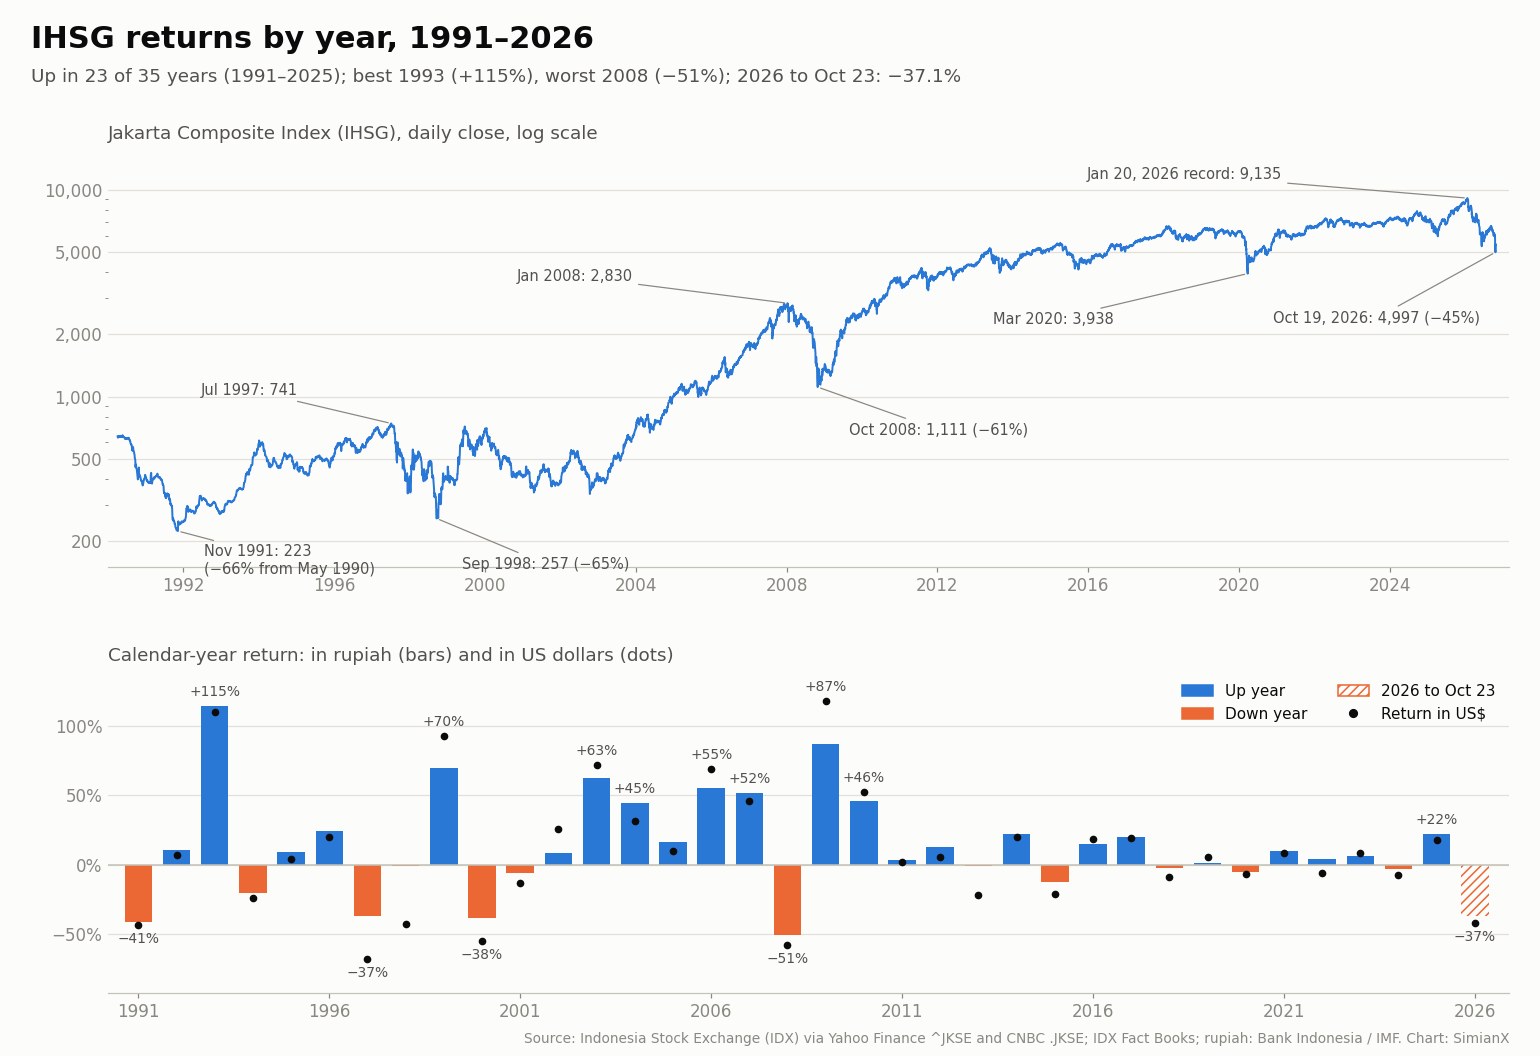
Newest first. Down years are in bold. The year-end close is the closing level of the last trading day of each year. The return in US dollars converts the index at the year-end rupiah rate; the S&P 500 column is its price return in dollars, without dividends, so it is comparable with the IHSG, which is also a price index.
| Year | Year-end close | IHSG return (rupiah) | Rupiah per US$ (year-end) | IHSG return in US$ | S&P 500 return (US$) |
|---|---|---|---|---|---|
| 2026 (to Oct 23) | 5,439.26 | −37.1% | 18,069 | −41.6% | +11.4% |
| 2025 | 8,646.94 | +22.1% | 16,782 | +17.6% | +16.4% |
| 2024 | 7,079.90 | −2.7% | 16,162 | −7.1% | +23.3% |
| 2023 | 7,272.80 | +6.2% | 15,416 | +8.3% | +24.2% |
| 2022 | 6,850.62 | +4.1% | 15,731 | −5.6% | −19.4% |
| 2021 | 6,581.48 | +10.1% | 14,269 | +8.8% | +26.9% |
| 2020 | 5,979.07 | −5.1% | 14,105 | −6.5% | +16.3% |
| 2019 | 6,299.54 | +1.7% | 13,901 | +5.9% | +28.9% |
| 2018 | 6,194.50 | −2.5% | 14,481 | −8.8% | −6.2% |
| 2017 | 6,355.65 | +20.0% | 13,548 | +19.0% | +19.4% |
| 2016 | 5,296.71 | +15.3% | 13,436 | +18.4% | +9.5% |
| 2015 | 4,593.01 | −12.1% | 13,795 | −20.8% | −0.7% |
| 2014 | 5,226.95 | +22.3% | 12,440 | +19.8% | +11.4% |
| 2013 | 4,274.18 | −1.0% | 12,189 | −21.4% | +29.6% |
| 2012 | 4,316.69 | +12.9% | 9,670 | +5.9% | +13.4% |
| 2011 | 3,821.99 | +3.2% | 9,068 | +2.3% | −0.003% |
| 2010 | 3,703.51 | +46.1% | 8,991 | +52.8% | +12.8% |
| 2009 | 2,534.36 | +87.0% | 9,400 | +118% | +23.5% |
| 2008 | 1,355.41 | −50.6% | 10,950 | −57.5% | −38.5% |
| 2007 | 2,745.83 | +52.1% | 9,419 | +45.6% | +3.5% |
| 2006 | 1,805.52 | +55.3% | 9,020 | +69.2% | +13.6% |
| 2005 | 1,162.63 | +16.2% | 9,830 | +9.9% | +3.0% |
| 2004 | 1,000.23 | +44.6% | 9,290 | +31.7% | +9.0% |
| 2003 | 691.89 | +62.8% | 8,465 | +72.0% | +26.4% |
| 2002 | 424.94 | +8.4% | 8,940 | +26.1% | −23.4% |
| 2001 | 392.04 | −5.8% | 10,400 | −13.1% | −13.0% |
| 2000 | 416.32 | −38.5% | 9,595 | −54.6% | −10.1% |
| 1999 | 676.92 | +70.1% | 7,085 | +92.6% | +19.5% |
| 1998 | 398.04 | −0.9% | 8,025 | −42.6% | +26.7% |
| 1997 | 401.71 | −37.0% | 4,650 | −67.7% | +31.0% |
| 1996 | 637.43 | +24.1% | 2,383 | +20.1% | +20.3% |
| 1995 | 513.85 | +9.4% | 2,308 | +4.3% | +34.1% |
| 1994 | 469.64 | −20.2% | 2,200 | −23.5% | −1.5% |
| 1993 | 588.77 | +115% | 2,110 | +110% | +7.1% |
| 1992 | 274.34 | +10.9% | 2,062 | +7.1% | +4.5% |
| 1991 | 247.39 | −40.8% | 1,992 | −43.5% | +26.3% |
| 1990 (base) | 417.79 | — | 1,901 | — | — |
Notes: daily closes are from Yahoo Finance (^JKSE) and CNBC (.JKSE), which agree to three decimals on every year-end from 1990 to 2025 and on October 23, 2026. The year-end closes for 1998–2013 were also checked against the Indonesia Stock Exchange's own IDX Fact Books (editions 2006, 2010 and 2014) and match exactly; 1990–2012 were also checked against the Wikipedia list of IDX Composite year-end values, which matches everywhere except 2000, where it shows 413.58 instead of the exchange's 416.32. The year-end rupiah rate is the Bank Indonesia reference rate for the end of December (JISDOR since 2013, the Bank Indonesia middle rate before that) as published in the IMF's International Financial Statistics, cross-checked with the OECD series on FRED; the 2026 figure is the JISDOR rate of October 23, 2026. The table starts in 1991 because 1990 is the first year-end that two independent daily sources record; earlier figures are covered further down.
IHSG in the last 10 years: return and growth
The most-searched version of the question is "what did the IHSG return over the last 10 years?" Here is the answer for the last 10 complete years, the last five, and the stretch from the end of 2015 to the latest close.
| Measure | Last 10 years (2016–2025) | Last 5 years (2021–2025) | End-2015 to October 23, 2026 |
|---|---|---|---|
| Start → end (IHSG close) | 4,593.01 → 8,646.94 | 5,979.07 → 8,646.94 | 4,593.01 → 5,439.26 |
| Total change | +88.3% | +44.6% | +18.4% |
| Compound annual growth (rupiah) | +6.5% | +7.7% | +1.6% |
| Average annual return | +6.9% | +8.0% | — |
| Up years | 7 of 10 | 4 of 5 | — |
| Rp10 million grew to | Rp18.8 million | Rp14.5 million | Rp11.8 million |
| Compound annual growth (US$) | +4.5% | +4.0% | −0.9% |
| S&P 500, compound annual (US$) | +12.8% | +12.8% | +12.9% |
From the end of 2015 (4,593.01) to the end of 2025 (8,646.94) the IHSG rose 88.3% in total, or +6.5% a year: Rp10 million that tracked the index (before dividends and costs) became about Rp18.8 million. It rose in 7 of those 10 years, with an average annual return of +6.9% and a median of +5.1%. That is well below the compound rate of the full 1991–2025 period (+9.0%), because the decade contained no rebound year like 1993, 2003 or 2009: its best year was 2025, at +22.1%. In US dollars the 10-year rate was +4.5% a year, against +12.8% for the S&P 500.
The 2026 decline changes the result sharply. Measured from the end of 2015 to October 23, 2026, the gain shrinks to 18.4%: the same Rp10 million would be worth about Rp11.8 million. Most of a decade's gains were erased in less than 10 months.
IHSG returns by decade
| Period | IHSG, compound annual (rupiah) | IHSG, compound annual (US$) | S&P 500, compound annual (US$) | IHSG cumulative (rupiah) | IHSG up years |
|---|---|---|---|---|---|
| 1991–1999 | +5.5% | −8.8% | +18.0% | +62.0% | 5 of 9 |
| 2000s | +14.1% | +10.9% | −2.7% | +274% | 7 of 10 |
| 2010s | +9.5% | +5.3% | +11.2% | +149% | 7 of 10 |
| 2020–2025 | +5.4% | +2.2% | +13.3% | +37.3% | 4 of 6 |
| 1991–2025 (all years) | +9.0% | +2.5% | +9.0% | +1,970% | 23 of 35 |
The 2000s were the IHSG's decade: the index fell 38.5% in the first year and still finished the decade with the best rate of any period on this page, as the post-crisis recovery ran through 2003–2007 and again in 2009. The 1990s were the weakest in dollar terms, because the 1997–98 crisis cut the rupiah's value by more than two thirds. In the 2010s and 2020s the S&P 500 beat the IHSG in dollars by a wide margin.
The best and worst years for the IHSG
| Rank | Best year | Return | Worst year | Return |
|---|---|---|---|---|
| 1 | 1993 | +115% | 2008 | −50.6% |
| 2 | 2009 | +87.0% | 1991 | −40.8% |
| 3 | 1999 | +70.1% | 2000 | −38.5% |
| 4 | 2003 | +62.8% | 1997 | −37.0% |
| 5 | 2006 | +55.3% | 1994 | −20.2% |
| 6 | 2007 | +52.1% | 2015 | −12.1% |
| 7 | 2010 | +46.1% | 2001 | −5.8% |
| 8 | 2004 | +44.6% | 2020 | −5.1% |
| 9 | 1996 | +24.1% | 2024 | −2.7% |
| 10 | 2014 | +22.3% | 2018 | −2.5% |
Best years. The biggest gain came in 1993, when the index more than doubled (+115%, from 274.34 to 588.77). The next three — 2009 (+87.0%), 1999 (+70.1%) and 2003 (+62.8%) — were all rebounds from a crash in the year or two before. The best year of the last decade was 2025 (+22.1%), when the index ended the year at 8,646.94, close to a record.
Worst years. 2008 (−50.6%) was the worst calendar year on record: the index fell from 2,830.26 on January 9 to 1,111.39 on October 28, and on October 8 the exchange suspended trading after a one-day fall of 10.38%. 1991 (−40.8%) reversed the boom that followed the 1987–88 deregulation, which had opened the market to foreign investors and new listings. 1997 (−37.0%) was the start of the Asian financial crisis, and 2000 (−38.5%) came as the post-crisis recovery reversed amid political turmoil.
In dollar terms the ranking is different. The worst year for a dollar-based investor was 1997 (−67.7%), not 2008, because the rupiah lost almost half its value that year (from Rp2,383 to Rp4,650 per dollar). In 1998 the IHSG was almost flat in rupiah (−0.9%) but lost 42.6% in dollars as the rate went to Rp8,025.
How often does the IHSG fall in a year?
From 1991 to 2025 the IHSG finished 12 of 35 calendar years lower, about one year in three. Most down years were mild: six of the twelve lost less than 6% (1998, 2001, 2013, 2018, 2020 and 2024). The other six include all five of the index's 20%-plus annual losses: 2008 (−50.6%), 1991 (−40.8%), 2000 (−38.5%), 1997 (−37.0%) and 1994 (−20.2%), plus 2015 (−12.1%).
The index has never fallen three years in a row. It fell two years running twice — 1997–1998 and 2000–2001 — and both times the next year was a large gain (1999: +70.1%; 2002: +8.4%). The longest winning streak was six years, from 2002 to 2007, when the index rose from 392.04 to 2,745.83.
Even good years usually contained a sharp fall. In 2006 the IHSG gained 55.3% but fell more than 20% between May and June; in 2011 it ended +3.2% after a decline of more than 20% between August and October.
Every IHSG decline of 20% or more since 1990
A decline here is measured from a record close to the lowest close before the index set a new record. Data start in April 1990.
| Peak (close) | Low (close) | Decline | Back above the peak | Peak to recovery |
|---|---|---|---|---|
| 9,134.70 (January 20, 2026) | 4,996.61 (October 19, 2026) | −45.3% | not yet | — |
| 7,905.39 (September 19, 2024) | 5,967.99 (April 9, 2025) | −24.5% | August 14, 2025 | 10 months |
| 6,689.29 (February 19, 2018) | 3,937.63 (March 24, 2020) | −41.1% | November 11, 2021 | 3 yr 8 mo |
| 5,523.29 (April 7, 2015) | 4,120.50 (September 28, 2015) | −25.4% | March 17, 2017 | 1 yr 11 mo |
| 5,214.98 (May 20, 2013) | 3,967.84 (August 27, 2013) | −23.9% | September 3, 2014 | 1 yr 3 mo |
| 4,193.44 (August 1, 2011) | 3,269.45 (October 4, 2011) | −22.0% | April 3, 2012 | 8 months |
| 2,830.26 (January 9, 2008) | 1,111.39 (October 28, 2008) | −60.7% | April 5, 2010 | 2 yr 2 mo |
| 2,401.14 (July 24, 2007) | 1,908.63 (August 16, 2007) | −20.5% | October 2, 2007 | 2 months |
| 1,553.06 (May 11, 2006) | 1,234.20 (June 14, 2006) | −20.5% | October 10, 2006 | 4 months |
| 740.83 (July 8, 1997) | 256.83 (September 21, 1998) | −65.3% | January 9, 2004 | 6 yr 6 mo |
| 647.40 (May 22, 1990) | 223.25 (November 11, 1991) | −65.5% | January 6, 1997 | 6 yr 7 mo |
Three crashes stand apart: 1990–91 (−65.5%), 1997–98 (−65.3%) and 2008 (−60.7%). After the 1997 peak it took more than six years — until January 2004 — for the index to close above 740.83 again. The 2008 crash was fast rather than long: the IHSG lost 60.7% in under 10 months but was back at a record by April 2010. The 2018–2020 decline (−41.1%) included the COVID-19 low of 3,937.63 on March 24, 2020.
The current decline, from the record 9,134.70 on January 20, 2026 to 4,996.61 on October 19, 2026 (−45.3%), is already the fourth-deepest since 1990, and the index has not recovered.
IHSG vs. the S&P 500
Over the full 1991–2025 period the two indices compounded at almost the same rate in their own currencies (+9.0% for the IHSG in rupiah, +9.0% for the S&P 500 in dollars). Converted into dollars, the IHSG beat the S&P 500 in 16 of the 35 years, but the losing years were costly: in 1997 the IHSG lost 67.7% in dollars while the S&P 500 gained 31.0%.
The relationship has not been stable. In 2002 the IHSG gained 8.4% while the S&P 500 lost 23.4%; in 2022 the IHSG rose 4.1% while the S&P 500 fell 19.4%. In 2026 the gap runs the other way: to October 23 the IHSG is −37.1% and the S&P 500 +11.4%. For an Indonesian investor the S&P 500 return in rupiah is usually higher than its dollar return, because the rupiah weakened against the dollar in 26 of the 35 years from 1991 to 2025; the year-by-year S&P 500 return in rupiah is in the Indonesian version of our S&P 500 table, and the rupiah rate by year in our US dollar exchange rate table. For other assets measured in rupiah, see the Indonesian versions of our gold price by year (rupiah per gram) and Bitcoin returns by year (in rupiah) tables.
2026 so far
Through October 23, 2026, the IHSG stood at 5,439.26, down 37.1% from its 2025 close of 8,646.94. In US dollars the loss was 41.6%, because the rupiah weakened 7.7% against the dollar to Rp18,069 (JISDOR). If the year ended today, it would be the IHSG's worst year since 2008 and the 4th-worst since 1991. Over the same period the S&P 500 gained 11.4%.
The year began with a record close of 9,134.70 on January 20, 2026. The turning point came a week later: after MSCI froze index changes for Indonesian stocks over free-float concerns, the IHSG fell 7.35% on January 28, 2026, to 8,320.56, and the exchange halted trading. The slide continued through the first half; on June 8, 2026 the index closed at 5,342.14 (−4.52%) as MSCI's warning about a possible downgrade to frontier status, a Bank Indonesia rate increase and a weak rupiah weighed on the market. On October 16, 2026, after MSCI opened a consultation on reclassifying Indonesia from an emerging market to a standalone market, the IHSG fell 11.57% to 5,185.10 — its second-worst day on record after January 8, 1998 (−11.95%). The low so far is 4,996.61 on October 19, 2026, 45.3% below the January record and the lowest close since October 2020. MSCI's decision is due by June 2027. Live AI analysis of individual stocks is available in SimianX, and every SimianX market-history page is listed on the market history topic hub.
Before 1991: the early years of the index
The IHSG was introduced on April 1, 1983, as an index of all stocks listed on the Jakarta Stock Exchange, with a base of 100 on August 10, 1982, according to the exchange's fact books. For most of the 1980s the market was tiny; it grew rapidly only after deregulation in 1987–88 opened it to foreign investors and new listings. Year-end values for 1983–1989 appear in secondary lists, but this page does not tabulate them because the two daily sources used here begin in April 1990 and the earlier figures could not be confirmed by a second source. The year-end 1990 close of 417.79 is the base for all returns on this page.
How to read IHSG returns
- Rupiah or dollars matters more than the index. From 1991 to 2025 the IHSG compounded +9.0% a year in rupiah and +2.5% in dollars. The difference is the rupiah, which went from Rp1,901 to Rp16,782 per dollar.
- The start date dominates the answer. The last 10 years compounded +6.5% a year; the last 20 (2006–2025), +10.6%; the full period, +9.0%. Quoting an IHSG return without its period says little.
- The median is a better guide than the average. A few huge rebound years lift the average (+14.3%) far above the median (+9.4%).
- These are price returns. The IHSG does not include dividends, so a fund that tracks it earns the dividend yield on top, before fees and taxes.
- Calendar years hide the path. 15 of the 35 years from 1991 to 2025 contained a decline of 20% or more inside the year, including 1999, 2006, 2007 and 2011, which still ended higher.
Frequently asked questions
What is the average annual return of the IHSG?
From 1991 to 2025 the IHSG's average calendar-year return was +14.3% and its median +9.4%. Compounded, it grew +9.0% a year in rupiah (from 417.79 to 8,646.94) and +2.5% a year in US dollars.
What was the IHSG's return over the last 10 years?
From the end of 2015 to the end of 2025 the IHSG rose 88.3%, or +6.5% a year, from 4,593.01 to 8,646.94. It rose in 7 of the 10 years. Including 2026 to October 23, the gain since the end of 2015 shrinks to 18.4%.
What was the IHSG's best year?
1993, when the index rose 115%, from 274.34 to 588.77. The next best were 2009 (+87.0%), 1999 (+70.1%) and 2003 (+62.8%).
What was the IHSG's worst year?
2008, at −50.6% (from 2,745.83 to 1,355.41). The other losses of 20% or more were 1991 (−40.8%), 2000 (−38.5%), 1997 (−37.0%) and 1994 (−20.2%). 2026 is −37.1% through October 23.
How many years has the IHSG gone down?
12 of 35 calendar years from 1991 to 2025. It has never fallen three years in a row.
What is the IHSG's return in 2026 so far?
−37.1% through October 23, 2026 (5,439.26 against 8,646.94 at the end of 2025), or −41.6% in US dollars. The record close is 9,134.70 on January 20, 2026; the lowest close of the year so far is 4,996.61 on October 19, 2026.
What was the IHSG at the end of each year?
5,296.71 (2016), 6,355.65 (2017), 6,194.50 (2018), 6,299.54 (2019), 5,979.07 (2020), 6,581.48 (2021), 6,850.62 (2022), 7,272.80 (2023), 7,079.90 (2024) and 8,646.94 (2025). Every year back to 1990 is in the table above.
Has the IHSG beaten the S&P 500?
In local currency, over 1991–2025, the two are almost tied (+9.0% vs. +9.0% a year). In US dollars the S&P 500 won clearly, because the rupiah lost most of its value against the dollar over the period.
Methodology and sources
- IHSG closes are daily closing levels of the Jakarta Composite Index from Yahoo Finance (^JKSE) and CNBC (.JKSE), both starting on April 6, 1990, and checked against the Indonesia Stock Exchange IDX Fact Books for 1998–2013 and the Wikipedia list for 1990–2012 (one discrepancy, 2000, footnoted above).
- Returns are price returns from the last close of one year to the last close of the next; dividends are not included. Declines of 20% or more use the same daily closes, measured from a record close to the lowest close before the next record.
- Exchange rates are the Bank Indonesia end-December reference rate (JISDOR from 2013) as reported in the IMF's International Financial Statistics, checked against the OECD series on FRED and Bank Indonesia's own daily rates. The same rates are used in our US dollar by year table.
- S&P 500 returns are price returns from Yahoo Finance (^GSPC), checked against CNBC (.SPX), the same series as our S&P 500 table.
- 2026 events are dated from the daily closes; the news context is from Bisnis.com, Kontan and MSCI.
- Data compiled October 23, 2026. This page is for information only and is not investment advice.
Related Reading
- S&P 500 Returns by Year: Every Year 1928–2026 Table
- KOSPI Returns by Year: Every Year 1982–2026 (Table)
- Nifty 50 & Sensex Returns Year Wise: Every Year 1980–2026
- BIST 100 Returns by Year: Every Year in TL and USD 1991–2026
- US Dollar Rate History by Year: 14 Currencies Since 1971
- Gold Price by Year: Every Year 1971–2026 With Returns Table
- Bitcoin Returns by Year: Every Year 2011–2026 Table
- South Korea Stock Market Crash 2026 vs Every KOSPI Crash
- How Long Every Bear Market Took to Recover: 1929-2022
- Nasdaq Returns by Year: Every Year 1972–2026 Table
- Dow Jones Returns by Year: Every Year 1915–2026 Table
- Market history: all SimianX reference pages
References
- Indonesia Stock Exchange (IDX) — statistics and IDX Fact Book
- Yahoo Finance — IDX Composite (^JKSE) historical data
- Bank Indonesia — JISDOR reference rate
- IMF — International Financial Statistics
- FRED — Indonesian rupiah to US dollar, end of period (OECD)
- MSCI — Market classification
- Wikipedia — IDX Composite
- Wikipedia — 1997 Asian financial crisis