
 By Marcus Reeve
Wall Street's S&P 500 Year-End Targets: 2027 Outlooks, 2026 Calls and Every Year's Forecast vs Actual
Updated October 23, 2026 (U.S. Pacific), with the S&P 500 at 7,623.68 (close of Friday, October 23, 2026). Two banks have published a year-end 2027 target so far; most 2027 outlooks are expected from mid-November to mid-December 2026, and this page is updated as each one lands.
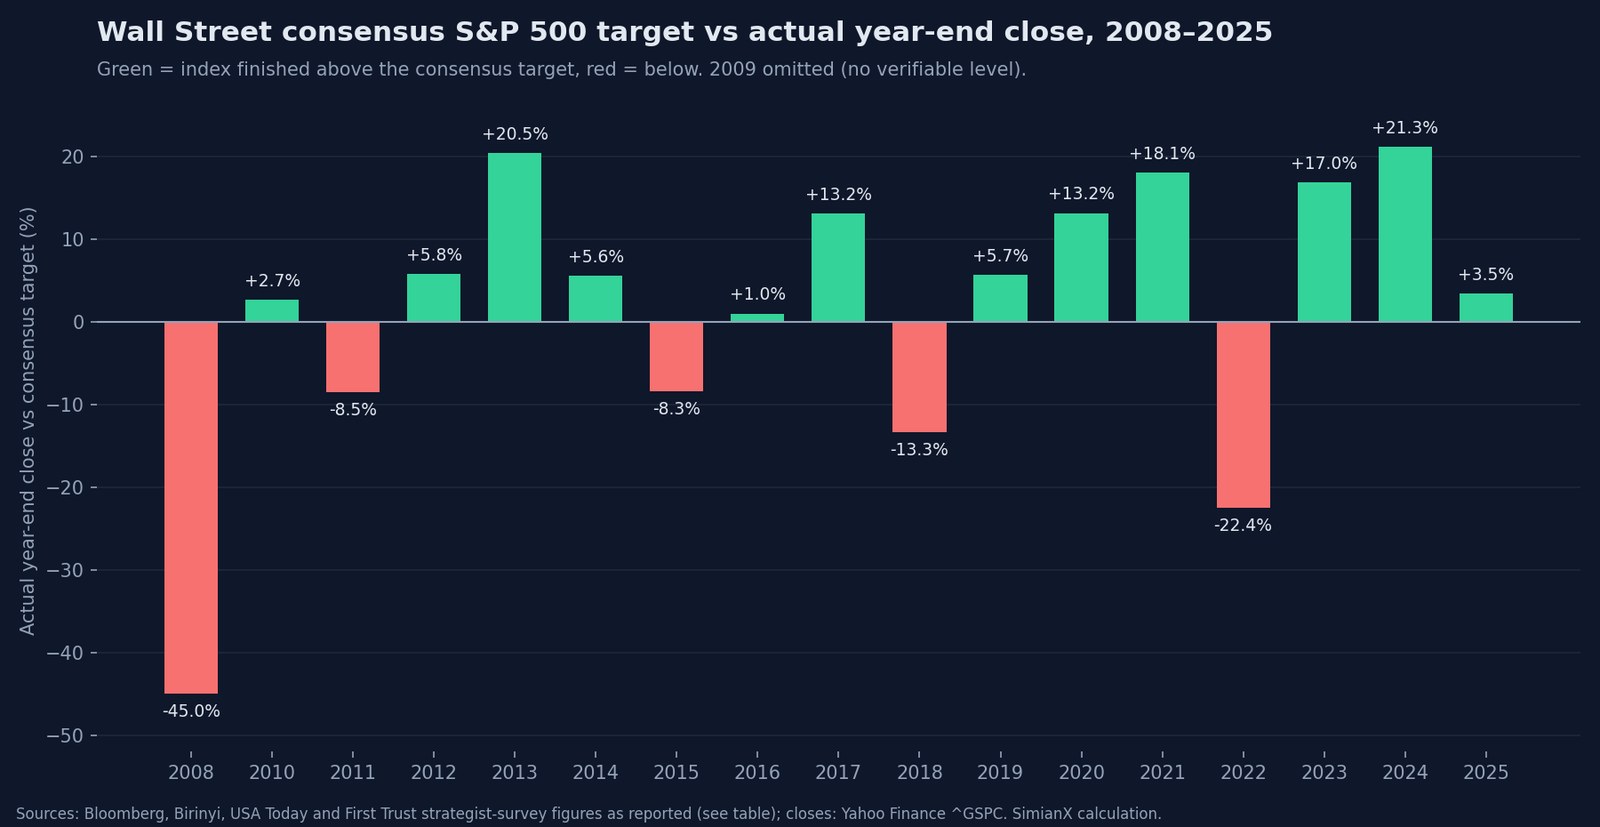
Quick answer: what is Wall Street's S&P 500 forecast for 2027? As of October 23, 2026, two major banks have published a year-end 2027 target: Goldman Sachs at 8,700 (October 19, 2026) and Barclays at 8,800 (June 2026, reaffirmed in September). Wells Fargo Investment Institute has a 2027 range of 8,600–8,800. Those levels sit 12.8% to 15.4% above the October 23 close of 7,623.68. For year-end 2026, the 23 firms tracked below have targets from 7,380 to 8,100 (median 7,950); Bloomberg's survey average was 7,970 on September 22. History says to treat any single number loosely: since 2008 the consensus year-end target has missed the actual close by a median 13.2%, landed within 5% in only 3 of 17 years, and was too low in 12 of 17.
| Year-end 2027 target | Firms | Status |
|---|---|---|
| 8,700 | Goldman Sachs | Published October 19, 2026 |
| 8,800 | Barclays | Published June 23, 2026; kept September 9 |
| 8,600–8,800 | Wells Fargo Investment Institute | Published June 2026 (midyear outlook) |
| Not yet published | Morgan Stanley, JPMorgan, Bank of America, Citi, UBS, Wells Fargo Securities, Deutsche Bank, HSBC, RBC, Evercore ISI, Oppenheimer, Yardeni, Société Générale, Jefferies, BMO, Fundstrat, BNP Paribas, Stifel, Canaccord, Seaport | Expected mid-November to mid-December 2026 |
This SimianX AI page is a permanent tracker with one stable address. It records every major firm's year-end S&P 500 target as it is published, every revision during the year, the strategist consensus, and, once the year is over, how far the forecast was from the actual close. The year in the title rolls forward each December; the history table only grows. For the actual closes behind the scorecard, see our table of S&P 500 returns by year since 1928. To test your own view on the index or on any stock before the 2027 outlooks arrive, you can run a live AI market analysis on SimianX.
How this page is updated. Last updated October 23, 2026. Every target comes from the bank's own published note or from a reputable news report quoting it (Reuters, Bloomberg, Yahoo Finance, BNN Bloomberg, The Globe and Mail and others, each linked). A figure we could not trace to such a source is left out, even when it circulates on social media or aggregator sites. Index levels are official S&P 500 closes from Yahoo Finance and CNBC, which must agree. From November 1 to December 15 we check for new 2027 outlooks every day; the rest of the year we check weekly for revisions. When the year ends we add the actual close and the miss to the history table. Nothing here is investment advice.
2027 S&P 500 Targets: Bank by Bank
The table below is the 2027 scorecard in the making. Each row changes from "not yet published" to a number the day the firm's outlook is reported. The "vs close" column measures the target against the S&P 500 close on October 23, 2026 (7,623.68).
| Firm | Strategist | Year-end 2027 target | Published | vs Oct 23 close |
|---|---|---|---|---|
| Goldman Sachs | Ben Snider | 8,700 | Oct 19, 2026 | +14.1% |
| Barclays | Venu Krishna | 8,800 | Jun 23, 2026 (kept Sep 9) | +15.4% |
| Wells Fargo Investment Institute | — | 8,600–8,800 | Jun 2026 | +12.8% to +15.4% |
| Morgan Stanley | Mike Wilson | Not yet published | Expected Nov 2026 | — |
| JPMorgan | Dubravko Lakos-Bujas | Not yet published | Expected late Nov 2026 | — |
| Bank of America | Savita Subramanian | Not yet published | Expected Nov–Dec 2026 | — |
| Citi | Scott Chronert | Not yet published | Expected Nov–Dec 2026 | — |
| UBS Global Research | Keith Parker | Not yet published | Expected Nov 2026 | — |
| UBS Global Wealth Management | CIO office | Not yet published | Expected Nov–Dec 2026 | — |
| Wells Fargo Securities | Ohsung Kwon | Not yet published | Expected Nov 2026 | — |
| Deutsche Bank | Binky Chadha | Not yet published | Expected Nov 2026 | — |
| HSBC | Nicole Inui | Not yet published | Expected Nov 2026 | — |
| RBC Capital Markets | Lori Calvasina | Not yet published | Expected Nov–Dec 2026 | — |
| Evercore ISI | Julian Emanuel | Not yet published | Expected Nov–Dec 2026 | — |
| Oppenheimer Asset Management | John Stoltzfus | Not yet published | Expected Dec 2026 | — |
| Yardeni Research | Ed Yardeni | Not yet published | Expected Nov–Dec 2026 | — |
| Société Générale | Manish Kabra | Not yet published | Expected Nov–Dec 2026 | — |
| Jefferies | — | Not yet published | Expected Nov–Dec 2026 | — |
| BMO Capital Markets | Francois Trahan | Not yet published | — | — |
| Fundstrat | Tom Lee | Not yet published | Expected Nov–Dec 2026 | — |
| Stifel | Barry Bannister | Not yet published | Expected Nov–Dec 2026 | — |
| BNP Paribas | — | Not yet published | Expected Nov–Dec 2026 | — |
| Canaccord Genuity | — | Not yet published | Expected Nov–Dec 2026 | — |
| Seaport Research Partners | Jonathan Golub | Not yet published | Expected Nov–Dec 2026 | — |
"Expected" dates are our estimate, based on when the 2026 outlooks appeared last year; they are not announcements. By November 30, 2025, Yahoo Finance already listed 2026 targets from Deutsche Bank, Morgan Stanley, Wells Fargo, JPMorgan and HSBC, and Reuters ran its full brokerage factbox on December 24, 2025. BMO published its 2026 target only on February 6, 2026.
What exists already for 2027, short of a year-end target:
- Mid-2027 and 12-month targets: Morgan Stanley 8,300 (12-month target set May 13, 2026), UBS Global Wealth Management 8,400 (raised from 8,200 on August 21, 2026), Yardeni Research 8,400 (moved from year-end 2026 to mid-2027 in September). Reuters' May 2026 strategist poll had a mid-2027 median of 8,050.
- 2027 earnings-per-share estimates for the S&P 500, the input most targets are built on: Goldman Sachs $385 (May), Morgan Stanley $380, JPMorgan $420, Barclays $414, Citi $400 (preliminary), Wells Fargo $425, Yardeni $425. According to Yahoo Finance in October, Goldman's Ben Snider models 11% earnings growth in 2027 after 36% in 2026.
2026 Year-End Targets: First Call vs Latest, Every Major Firm
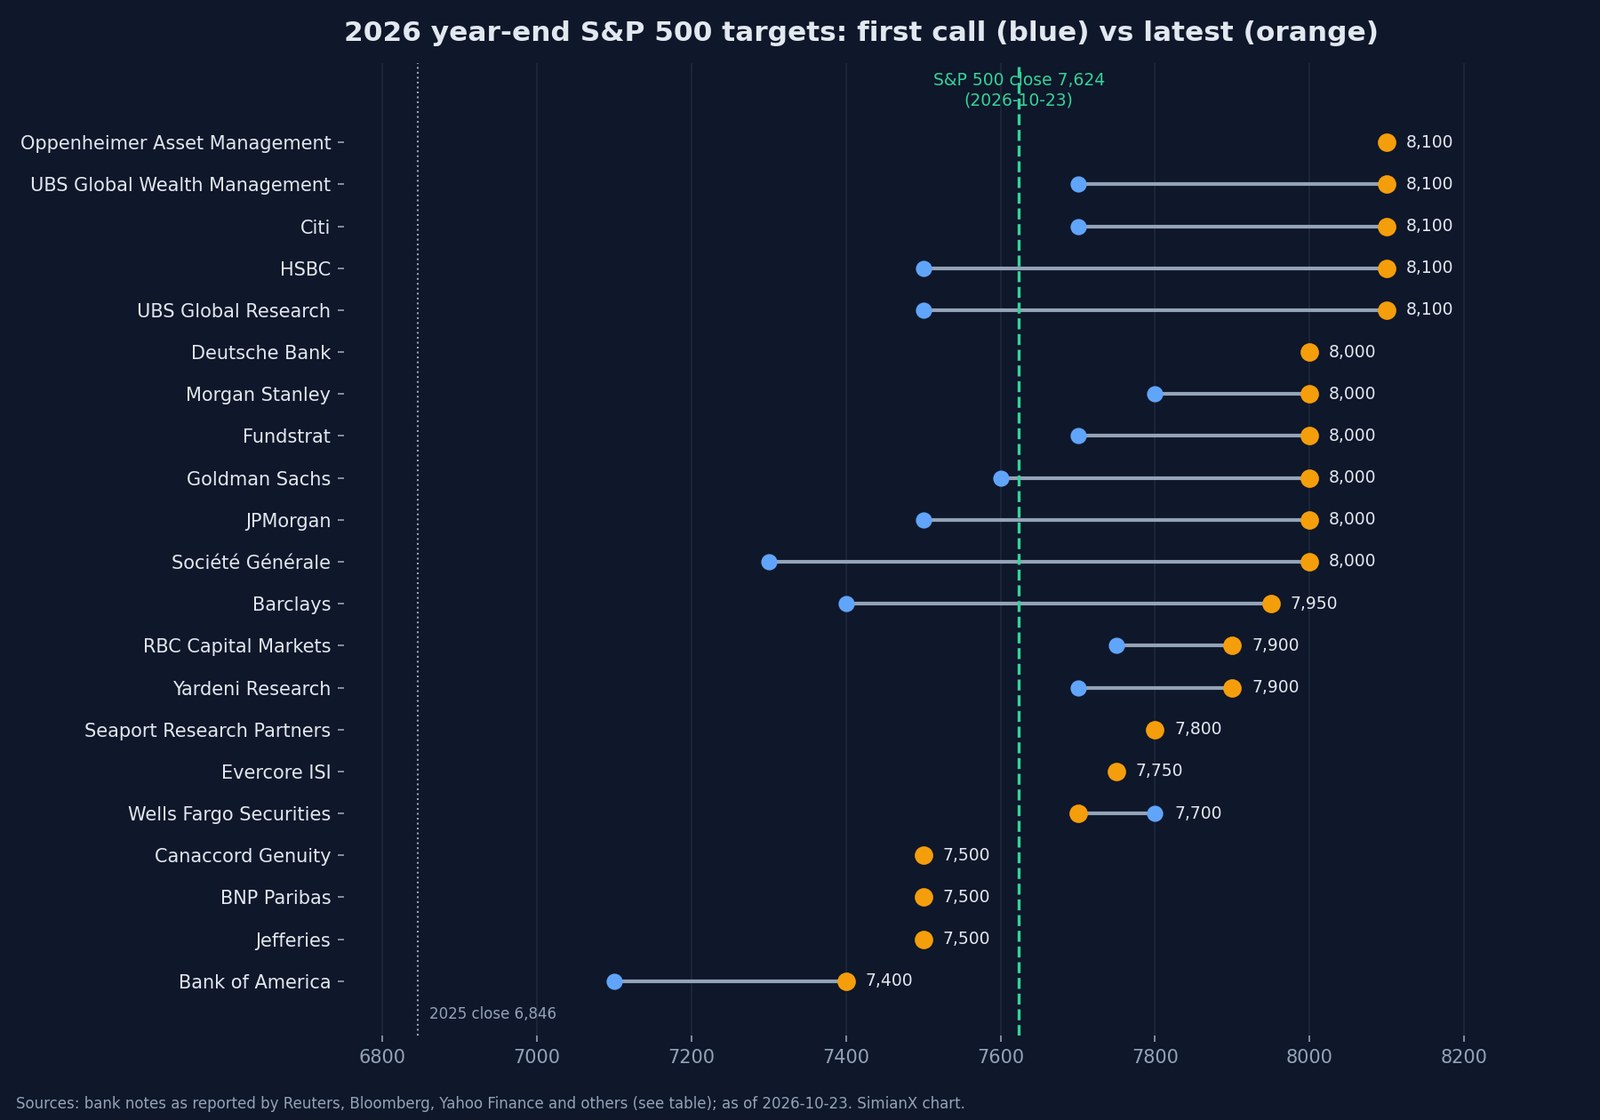
The 2026 cycle is the live test. The S&P 500 ended 2025 at 6,845.50, set a record close of 7,818.93 on October 6, 2026, and closed at 7,623.68 on October 23, up 11.4% for the year and 2.5% below the record. The first column is each firm's initial 2026 call, mostly from November–December 2025; the second is the latest figure we can source.
| Firm (strategist) | First 2026 target | Latest 2026 target | Change | Revisions | Latest vs Oct 23 close |
|---|---|---|---|---|---|
| Goldman Sachs (Ben Snider) | 7,600 | 8,000 (May 26; kept Oct 19) | +400 | 1 | +4.9% |
| Morgan Stanley (Mike Wilson) | 7,800 | 8,000 (May 13) | +200 | 1 | +4.9% |
| JPMorgan (Dubravko Lakos-Bujas) | 7,500 | 8,000 (Aug 10) | +500 | 4 | +4.9% |
| Bank of America (Savita Subramanian) | 7,100 | 7,400 (Sep 14) | +300 | 1 | −2.9% |
| Citi (Scott Chronert) | 7,700 | 8,100 (Jun 2026) | +400 | 1 | +6.2% |
| UBS Global Research (Keith Parker) | 7,500 | 8,100 (Jul 21) | +600 | 1 | +6.2% |
| UBS Global Wealth Management | 7,700 | 8,100 (Aug 21) | +400 | 3 | +6.2% |
| Wells Fargo Securities (Ohsung Kwon) | 7,800 | 7,700 (Sep 14) | −100 | 3 | +1.0% |
| Wells Fargo Investment Institute | 7,400–7,600 | 7,800–8,000 (Jun 15) | +400 | 1 | range |
| Deutsche Bank (Binky Chadha) | 8,000 | 8,000 | 0 | 0 | +4.9% |
| Barclays (Venu Krishna) | 7,400 | 7,950 (Sep 9) | +550 | 3 | +4.3% |
| HSBC (Nicole Inui) | 7,500 | 8,100 (Sep 8) | +600 | 2 | +6.2% |
| RBC Capital Markets (Lori Calvasina) | 7,750 | 7,900 (May 8) | +150 | 1 | +3.6% |
| Yardeni Research (Ed Yardeni) | 7,700 | 7,900 (Sep 2026) | +200 | 3 | +3.6% |
| Oppenheimer Asset Management (John Stoltzfus) | 8,100 | 8,100 | 0 | 0 | +6.2% |
| Evercore ISI (Julian Emanuel) | 7,750 | 7,750 | 0 | 0 | +1.7% |
| Société Générale (Manish Kabra) | 7,300 | 8,000 (by Sep 10) | +700 | 1 | +4.9% |
| Jefferies | 7,500 | 7,500 (as of Sep 10) | 0 | 0 | −1.6% |
| Fundstrat (Tom Lee) | 7,700 | 8,000 (Jun 26) | +300 | 1 | +4.9% |
| Stifel (Barry Bannister) | — | 7,800 (Jun 23) | — | — | +2.3% |
| BMO Capital Markets (Francois Trahan) | 7,380 (Feb 6) | 7,380 | 0 | 0 | −3.2% |
| BNP Paribas | 7,500 | 7,500 (as of Sep 10) | 0 | 0 | −1.6% |
| Canaccord Genuity | 7,500 | 7,500 (as of Sep 10) | 0 | 0 | −1.6% |
| Seaport Research Partners (Jonathan Golub) | 7,800 | 7,800 (as of Sep 10) | 0 | 0 | +2.3% |
Sources for every row are listed under References; "as of Sep 10" means the level shown in the Reuters brokerage factbox of September 10, 2026, the latest complete list we could open. "Revisions" counts changes of the year-end level during 2026, not reiterations.
What the 2026 table shows:
- The street moved up with the market. Of the 21 firms with a numeric target from the November–December 2025 cohort, 13 raised their year-end level during 2026, one (Wells Fargo Securities) ended with a net cut, and 7 have not changed it. The median first call was 7,700; the median latest target across all 23 firms is 7,950.
- Ten of those 21 first calls have already been passed. At 7,623.68, the index is above every initial target of 7,600 or lower, including Goldman Sachs (7,600), JPMorgan, UBS Global Research, HSBC (7,500 each), Barclays (7,400), Société Générale (7,300) and Bank of America (7,100).
- Five current targets are below the index. Bank of America (7,400) and BMO (7,380), plus Jefferies, BNP Paribas and Canaccord at 7,500 as of the last factbox, would need a fall of 1.6% to 3.2% from here to be hit exactly.
- The high end is 8,100, shared by Citi, HSBC, Oppenheimer and both UBS divisions, 6.2% above the October 23 close. Eleven of the 23 latest targets are 8,000 or higher.
How the 2026 Targets Moved: Revision Timeline
The revisions tell the story of the year better than the targets do. The index fell 5.1% in March as the Iran conflict weighed on markets, bottoming at 6,343.72 on March 30, then rallied 10.4% in April on very strong earnings, and the targets followed.
- February 6: BMO Capital Markets initiates at 7,380.
- March: JPMorgan cuts to 7,200 from 7,500 (around March 20). Wells Fargo Securities cuts to 7,300 from 7,800, citing the Iran conflict. Barclays raises to 7,650 from 7,400 on March 24.
- April: UBS Global Wealth Management trims to 7,500 from 7,700. JPMorgan lifts to 7,600 on April 21 as the AI rally regains momentum.
- May: RBC raises to 7,900 (May 8); Yardeni to 8,250 (May 10); HSBC to 7,650 (May 11); Morgan Stanley to 8,000 (May 13); UBS Global Wealth Management to 7,900 (May 22); Goldman Sachs to 8,000 (May 26), lifting its 2027 EPS forecast to $385.
- June: Citi to 8,100; Wells Fargo Securities to 7,950 and Wells Fargo Investment Institute to 7,800–8,000 (June 15); Barclays to 7,800 and Stifel to 7,800 (June 23); JPMorgan to 7,800 (June 24); Fundstrat's Tom Lee to 8,000 (June 26).
- July: UBS Global Research to 8,100 from 7,500 (July 21).
- August: JPMorgan to 8,000 (August 10); Yardeni to 8,400 (August 12); UBS Global Wealth Management to 8,100 (August 21).
- September: HSBC to 8,100 (September 8); Barclays to 7,950 (September 9); Bank of America to 7,400 from 7,100, which had been the lowest target among the major banks all year (September 14); Wells Fargo Securities cuts to 7,700 from 7,950 on valuation risk (September 14); Yardeni cuts to 7,900 from 8,400 after the rise in bond yields, moving 8,400 to mid-2027.
- October: Goldman Sachs keeps 8,000 for 2026 and publishes 8,700 for year-end 2027 (October 19).
Strategist Consensus for 2026: From 7,269 to 7,970
| Date | Survey | 2026 year-end target | Index vs target on Oct 23 |
|---|---|---|---|
| Nov 19, 2025 | Bloomberg survey average (9 strategists) | 7,269 | Index 4.9% above |
| Nov 2025 | Reuters poll median | 7,490 | Index 1.8% above |
| Dec 17, 2025 | Bloomberg survey average (21 strategists) | 7,555 | Index 0.9% above |
| May 15, 2026 | Bloomberg survey average (21; range 7,000–8,250) | 7,612 | Index 0.2% above |
| May 27, 2026 | Reuters poll median (47 strategists) | 7,620 | Index in line |
| Sep 22, 2026 | Bloomberg survey average (20; range 7,400–8,410) | 7,970 | Target 4.5% above index |
The December 2025 Bloomberg average of 7,555, the number that goes into the history table below as the 2026 consensus, implied a gain of about 10.4% from the 2025 close. With just over two months left, the index is already 0.9% above it. Bloomberg figures are as reported by First Trust; the May Reuters poll is from Reuters' strategist survey.
Forecast vs Actual: Every Year's Consensus Target Since 2008
This is the table nobody else keeps in one place. For each year it shows the strategist consensus published in December of the prior year (or the first days of January), the actual year-end close, and the miss. A positive miss means the index finished above the consensus target, so strategists were too cautious; a negative miss means they were too optimistic.
| Year | Consensus target | Survey and date | Implied gain vs prior close | Actual close | Actual gain | Miss (actual vs target) | Reuters poll median | Reuters miss |
|---|---|---|---|---|---|---|---|---|
| 2008 | 1,642 | Birinyi Associates average, 11 firms, start of 2008 | +11.8% | 903.25 | −38.5% | −45.0% | — | — |
| 2010 | 1,225 | First Trust strategist average, Jan 7, 2010 | +9.9% | 1,257.64 | +12.8% | +2.7% | — | — |
| 2011 | 1,374 | Bloomberg average, 11 strategists, Dec 2010 | +9.3% | 1,257.60 | 0.0% | −8.5% | — | — |
| 2012 | 1,348 | Bloomberg average, 12 strategists, Jan 2012 | +7.2% | 1,426.19 | +13.4% | +5.8% | — | — |
| 2013 | 1,534 | Bloomberg average, 15 strategists, Jan 2013 | +7.6% | 1,848.36 | +29.6% | +20.5% | — | — |
| 2014 | 1,950 | Bloomberg consensus, 21 strategists, Dec 26, 2013 | +5.5% | 2,058.90 | +11.4% | +5.6% | — | — |
| 2015 | 2,230 | USA Today average, 15 firms, Dec 2014 | +8.3% | 2,043.94 | −0.7% | −8.3% | — | — |
| 2016 | 2,216 | Bloomberg average, Dec 2015 | +8.4% | 2,238.83 | +9.5% | +1.0% | 2,207 | +1.4% |
| 2017 | 2,362 | Bloomberg average, start of 2017 | +5.5% | 2,673.61 | +19.4% | +13.2% | 2,350 | +13.8% |
| 2018 | 2,893 | Bloomberg average, Jan 2018 | +8.2% | 2,506.85 | −6.2% | −13.3% | — | — |
| 2019 | 3,056 | Bloomberg average, 14 strategists, Nov 30, 2018 | +21.9% | 3,230.78 | +28.9% | +5.7% | 2,975 | +8.6% |
| 2020 | 3,318 | Bloomberg average, 21 strategists, Dec 17, 2019 | +2.7% | 3,756.07 | +16.3% | +13.2% | 3,260 | +15.2% |
| 2021 | 4,035 | Bloomberg average, 17 strategists, Dec 12, 2020 | +7.4% | 4,766.18 | +26.9% | +18.1% | 3,900 | +22.2% |
| 2022 | 4,950 | Bloomberg average, 19 strategists, Dec 16, 2021 | +3.9% | 3,839.50 | −19.4% | −22.4% | 4,910 | −21.8% |
| 2023 | 4,078 | Bloomberg average, 22 strategists, Dec 19, 2022 | +6.2% | 4,769.83 | +24.2% | +17.0% | 4,200 | +13.6% |
| 2024 | 4,850 | Bloomberg median, Dec 30, 2023 | +1.7% | 5,881.63 | +23.3% | +21.3% | 4,700 | +25.1% |
| 2025 | 6,614 | Bloomberg average, 19 strategists, Dec 11, 2024 | +12.5% | 6,845.50 | +16.4% | +3.5% | 6,500 | +5.3% |
| 2026 | 7,555 | Bloomberg average, 21 strategists, Dec 17, 2025 | +10.4% | Open (7,623.68 on Oct 23) | +11.4% so far | Index 0.9% above so far | 7,490 | Index 1.8% above so far |
| 2027 | Pending | Consensus forms Nov–Dec 2026 | — | — | — | — | — | — |
Method. Consensus = the average (or, where only that was reported, the median or "consensus") year-end S&P 500 target from a strategist survey published in December of the prior year or the first days of January, as reported in a dated article we opened; each cell links to it. The main series is Bloomberg's survey. Where no Bloomberg level could be sourced we use the closest equivalent and say so (Birinyi Associates for 2008, a First Trust strategist average for 2010, USA Today's survey for 2015), and 2024 is a median. Reuters' late-November poll median is shown as a second series where we found it. "Implied gain" is measured from the prior year-end close; the 2019 figure is inflated because the survey was taken on November 30, 2018, before the December 2018 sell-off. 2009 is left out: the only level we found (1,056, Bloomberg, January 2009) came from a search snippet we could not open. Years before 2007 are left out because we found only percentage forecasts, not index levels. Actual closes are official year-end closes (Yahoo Finance, cross-checked against FRED and our S&P 500 by-year table). Miss = actual close ÷ consensus target − 1.
What the Track Record Says: Five Patterns
1. The consensus has never called a down year in this sample. All 17 consensus targets were above the prior year-end close, with implied gains from +1.7% (2024) to +12.5% (2025) and a median of +7.6%. The index fell in five of those years (2008, 2011 by four hundredths of a point, 2015, 2018 and 2022). The two big declines, 2008 and 2022, produced the two biggest optimistic misses: −45.0% and −22.4%. Our list of every S&P 500 bear market since 1929 shows why: bear markets are rarely visible in December forecasts.
2. The typical miss is about 13%, and exact hits are rare. The median absolute miss across the 17 years is 13.2% (mean also 13.2%). The consensus landed within 5% of the actual close in only three years (2010, 2016 and 2025) and within 10% in eight. The Reuters median, where available, did no better: a median absolute miss of 13.8% over nine years.
3. Misses lean to the upside: strategists are usually too cautious. The index finished above the consensus target in 12 of 17 years. In those 17 years the average actual gain was 9.8% against an average implied gain of 8.1%, and the median actual gain was 13.4% against a median implied gain of 7.6%. The gap is widest in strong bull years: 2013 (+20.5%), 2021 (+18.1%), 2023 (+17.0%) and 2024 (+21.3%), when the consensus called for only 1.7% and the index rose 23.3%.
4. After a boom year, the consensus expects a pause. The four strongest years in the sample were 2013 (+29.6%), 2019 (+28.9%), 2021 (+26.9%) and 2023 (+24.2%). The consensus for the following year implied gains of only +5.5%, +2.7%, +3.9% and +1.7%, all below the 7.6% median. The index then rose 11.4% in 2014, 16.3% in 2020 and 23.3% in 2024; only 2022 (−19.4%) delivered the pause, and it overshot into a bear market. Strategists rarely forecast a second boom year, which is why the misses are largest exactly when the market keeps going.
5. During the year, revisions chase the price. In 2026, 13 of 21 first-cohort firms raised their targets as the index climbed, and Bloomberg's survey average went from 7,555 in December 2025 to 7,970 by late September. Only Wells Fargo Securities finished the period with a net cut. Upgrades that follow a rally add little information about where the index will be on December 31.
How to Use Year-End Targets (and How Not To)
A year-end target is a single number standing in for a range of outcomes, and the banks know it: most notes also publish bull and bear cases, earnings forecasts and sector calls, which are usually more useful than the headline level.
- Read the earnings path, not just the level. Most targets are an earnings-per-share estimate times an assumed price-to-earnings multiple. The 2027 EPS estimates above ($380 to $425) differ by about 12%; that, plus the multiple, is the real debate.
- Use the dispersion. In September the 20 strategists in Bloomberg's survey ranged from 7,400 to 8,410. A wide range is a sign of genuine uncertainty, not of one firm being smart.
- Compare with the base rate. From 1928 to 2025 the S&P 500 rose in 66 of 98 years, about two years in three; our S&P 500 returns by year table has every year. A consensus forecast of "up mid-single digits" mostly restates that base rate.
- Watch the calendar, not just the forecast. Fed meetings, inflation and jobs data and big-tech earnings move the index more than outlook notes do. Our US economic calendar in your time zone and Magnificent 7 earnings tracker list the dates; late-year seasonality is covered in our pages on the Thanksgiving week and the Santa Claus rally.
- Do not trade the target. A bank lifting its target is a description of what has already happened to earnings and prices. Volatility around the news, tracked in our VIX spikes history, matters more for risk than any year-end number.
Frequently Asked Questions
What is the S&P 500 forecast for 2027? As of October 23, 2026, Goldman Sachs forecasts 8,700 and Barclays 8,800 for the end of 2027, and Wells Fargo Investment Institute has a range of 8,600–8,800. Most other banks publish their 2027 targets between mid-November and mid-December 2026; this page adds each one as it is reported.
What is Wall Street's S&P 500 target for the end of 2026? The 23 firms tracked here range from 7,380 (BMO) to 8,100 (Citi, HSBC, Oppenheimer, UBS), with a median of 7,950. Bloomberg's survey average was 7,970 on September 22, 2026. The index closed at 7,623.68 on October 23.
How accurate are Wall Street's S&P 500 forecasts? Not very, on a single-year basis. From 2008 to 2025 (17 years with a sourced consensus), the year-end consensus missed the actual close by a median 13.2%, was within 5% only three times and was too low in 12 years. It has never predicted a down year in that sample.
Which bank is most bullish on the S&P 500 for 2027? Among published year-end 2027 targets, Barclays is highest at 8,800, the top of Wells Fargo Investment Institute's 8,600–8,800 range. Goldman Sachs is at 8,700. The list will change as the November–December outlooks arrive.
When do banks publish their 2027 stock market outlooks? Mostly from mid-November to mid-December. Last year, Deutsche Bank, Morgan Stanley, Wells Fargo, JPMorgan and HSBC had published by November 30, and Reuters compiled the full list on December 24. A few firms, such as BMO, publish in the new year.
Who has the most accurate S&P 500 forecast? No firm has been consistently right; rankings flip from year to year because the market's path in any year is dominated by events nobody forecast (2008, 2020, 2022). This page tracks the consensus rather than individual hit rates; we will add a per-firm 2026 scorecard after the December 31, 2026 close.
Related Reading
- S&P 500 Returns by Year: Every Year 1928–2026 Table
- Every S&P 500 Bear Market Since 1929: When Was the Last?
- Magnificent 7 Earnings Dates and Results: Q3 2026 Tracker
- US Economic Calendar November 2026: Dates in Your Time Zone
- Santa Claus Rally: Every Year Since 1950 and What Came Next
- Thanksgiving Week Stock Market: S&P 500 Each Year Since 1950
- S&P 500 Seasonality: The Best & Worst Months 1950–2026
- Stock Market After Midterm Elections: Every Cycle 1950–2026
- VIX Spikes History: Every Major Volatility Spike Since 1990
More reference tables in the Market history topic hub, and every story in the SimianX stories library.
References
- Reuters — brokerage forecasts for the S&P 500 in 2026, factbox (December 24, 2025)
- Reuters — brokerage forecasts for the S&P 500 in 2026, factbox (September 10, 2026)
- Yahoo Finance — Wall Street's 2026 forecasts are rolling in (November 30, 2025)
- Yahoo Finance — Goldman Sachs keeps 8,000 for 2026, sees 8,700 at end-2027 (October 19, 2026)
- Yahoo Finance — Goldman Sachs raises its S&P 500 target to 8,000 (May 2026)
- MarketScreener (Reuters) — Morgan Stanley lifts its S&P 500 target to 8,000 (May 13, 2026)
- AOL (TheStreet) — JPMorgan resets its S&P 500 target to 7,200 (March 2026)
- Bloomberg Law (Bloomberg) — JPMorgan lifts its S&P 500 target to 7,600 (April 21, 2026)
- Kitco (Reuters) — JPMorgan lifts its 2026 target to 8,000 from 7,800 (August 10, 2026)
- Bloomberg Línea — BofA raises its S&P 500 target to 7,400 (September 15, 2026)
- Kitco (Reuters) — Citigroup lifts its year-end target to 8,100 (June 8, 2026)
- InvestingLive — UBS lifts its S&P 500 target to 8,100 (July 21, 2026)
- BNN Bloomberg (Reuters) — UBS Global Wealth Management lifts its forecast to 7,900 (May 22, 2026)
- Zawya (Reuters) — UBS Global Wealth Management lifts its target to 8,100 (August 21, 2026)
- MarketScreener (Reuters) — Wells Fargo raises its target to 7,950; Wells Fargo Investment Institute sets 2027 range of 8,600–8,800 (June 16, 2026)
- Kitco (Reuters) — Wells Fargo trims its year-end target to 7,700 (September 15, 2026)
- BNN Bloomberg — Barclays raises its 2026 target to 7,650 (March 24, 2026)
- The San Juan Daily Star (Reuters) — Barclays and Stifel lift their targets to 7,800 (June 2026)
- BNN Bloomberg (Reuters) — Barclays lifts its target to 7,950, sees 8,800 at end-2027 (September 9, 2026)
- Investing.com — HSBC and Yardeni raise their year-end targets (May 2026)
- Kitco (Reuters) — HSBC lifts its year-end target to 8,100 (September 8, 2026)
- Kitco (Reuters) — RBC lifts its year-end target to 7,900 (May 8, 2026)
- Yardeni QuickTakes — raising the 2026 S&P 500 target to 8,250 (May 2026)
- Bloomberg Línea — Yardeni lifts his target to 8,400 (August 2026)
- Advisor Perspectives (Bloomberg) — Yardeni cuts his target to 7,900 (September 16, 2026)
- The Globe and Mail (Reuters) — BMO initiates at 7,380 (February 6, 2026)
- Fundstrat — Lee and Newton raise year-end targets to 8,000 (June 26, 2026)
- Reuters poll via WHBL — S&P 500 forecast to end the year slightly higher (May 27, 2026)
- First Trust — Bloomberg survey averages for 2026 (September 22, 2026)
- First Trust — Bloomberg survey average of November 19, 2025 (December 12, 2025)
- First Trust — A Recap of December 2025 (Bloomberg survey, 7,555)
- Yahoo Finance — S&P 500 (^GSPC) historical prices
- FRED — S&P 500 daily close