
Inside Amazon's July 30 Report: AWS Growth, Margins, and the $200B AI Bet
The Amazon Q2 Earnings 2026 report may become a defining test of whether the artificial intelligence infrastructure boom is creating durable economic value—or simply consuming enormous amounts of cash.
Amazon will report its second-quarter results on July 30, 2026, after the market closes. Investors will be focused less on headline earnings per share and more on three connected questions: Is Amazon Web Services still accelerating? Can AWS preserve its unusually strong operating margin as depreciation rises? And is Amazon’s planned $200 billion in 2026 capital expenditure supported by enough contracted AI demand to produce attractive long-term returns?
For investors using SimianX AI, the right approach is not to classify the report as a simple earnings “beat” or “miss.” Amazon is simultaneously operating a global retail platform, a high-margin advertising business, and the world’s largest cloud infrastructure franchise.
Understanding the stock therefore requires separating short-term accounting pressure from the potential long-term economics of AWS, Trainium, Bedrock, and enterprise AI workloads.
Amazon Q2 2026 Earnings Date, Guidance, and Expectations
Amazon’s Q2 earnings call is scheduled for Thursday, July 30, 2026, at 2:00 p.m. Pacific Time and 5:00 p.m. Eastern Time.
Management’s official guidance calls for quarterly revenue of $194 billion to $199 billion, representing year-over-year growth of approximately 16% to 19%. Operating income is expected to fall between $20 billion and $24 billion, compared with $19.2 billion in the second quarter of 2025.
Public earnings estimates currently place consensus revenue near $196 billion and adjusted earnings expectations around $1.81 to $1.82 per share, although estimates may change before the announcement.
| Q2 2026 metric | Current reference point | What investors should examine |
|---|---|---|
| Revenue guidance | $194B–$199B | Organic demand, foreign exchange, and Prime Day contribution |
| Revenue growth | 16%–19% | Whether growth remains broad across retail, AWS, and advertising |
| Operating-income guidance | $20B–$24B | AWS profitability versus rising depreciation |
| AWS Q1 growth baseline | 28% | Acceleration, stability, or renewed deceleration |
| 2026 capex plan | About $200B | Demand commitments, deployment timing, and expected returns |
| Q2 report date | July 30, 2026 | Forward guidance may determine the stock reaction |
The EPS figure deserves special caution. Amazon’s first-quarter net income included a $16.8 billion pre-tax gain related to its Anthropic investment, making sequential comparisons of reported net income less useful than comparisons of segment operating income, cash flow, and underlying business growth.
The most important number may not be Amazon’s Q2 EPS. It may be the relationship between AWS revenue growth and the rate at which Amazon’s AI infrastructure costs are entering the income statement.
Why AWS Growth Is the Center of the Amazon Earnings Debate
AWS entered the quarter with substantial momentum.
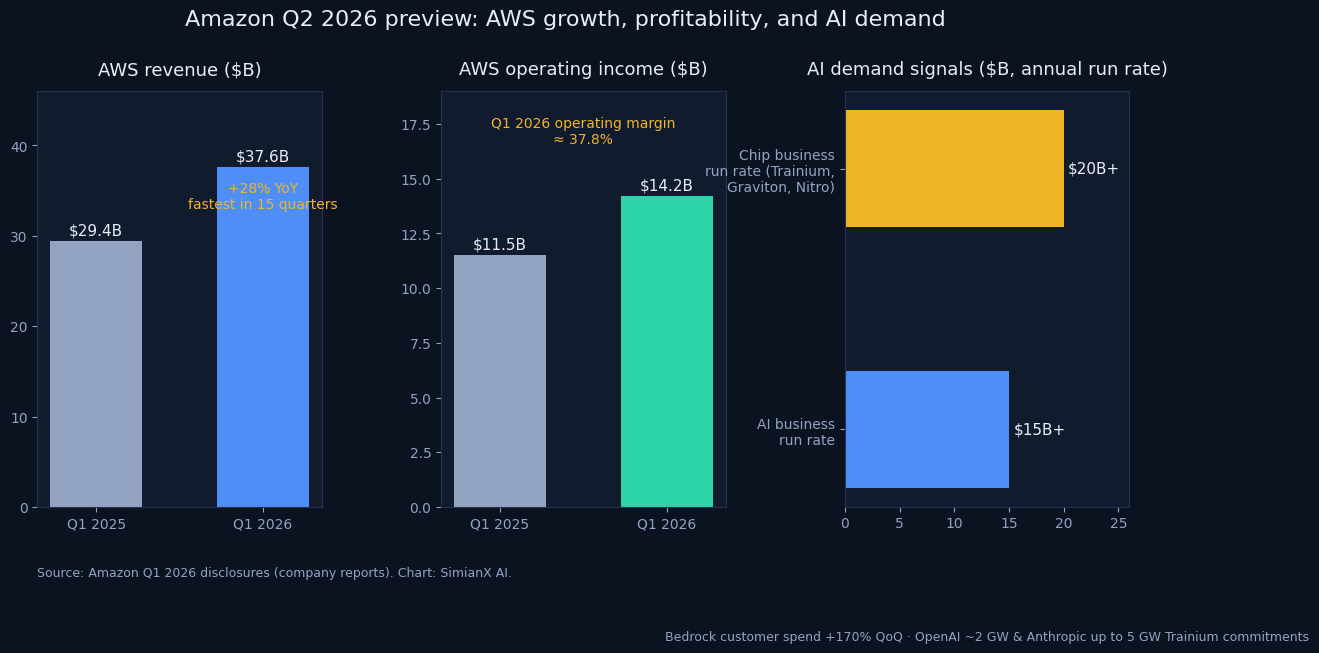
First-quarter AWS revenue increased 28% year over year to $37.6 billion, its fastest growth rate in 15 quarters. AWS operating income reached $14.2 billion, up from $11.5 billion a year earlier.
Based on those reported figures, the segment generated an operating margin of approximately 37.8%.
That margin matters because AWS remains Amazon’s primary profit engine. Retail revenue is much larger, but cloud services produce far more operating income per dollar of sales. A small change in AWS growth or profitability can therefore have a disproportionate impact on consolidated earnings.
AWS is also becoming Amazon’s principal route for monetizing the AI cycle. Management said its AI business had surpassed a $15 billion annual revenue run rate by the first quarter.
Amazon Bedrock customer spending increased 170% quarter over quarter, while the service processed more tokens in Q1 than it had processed in all previous years combined.
Additional demand indicators include:
- A commitment from OpenAI to use approximately two gigawatts of Trainium capacity, beginning to ramp in 2027.
- Anthropic plans to secure as much as five gigawatts of current and future Trainium capacity.
- Amazon said it had landed more than 2.1 million AI chips over the preceding 12 months.
- More than one million Nvidia GPUs were scheduled to begin deployment in 2026.
- Amazon’s chip business, including Trainium, Graviton, and Nitro, surpassed a $20 billion annual revenue run rate in Q1.
These disclosures strengthen the demand case. However, they do not by themselves prove that the investment will generate acceptable returns.
Investors still need evidence that revenue, operating income, and eventually free cash flow can rise faster than the associated infrastructure costs.
Can AWS Growth Justify Amazon’s $200B AI Capital Expenditure?
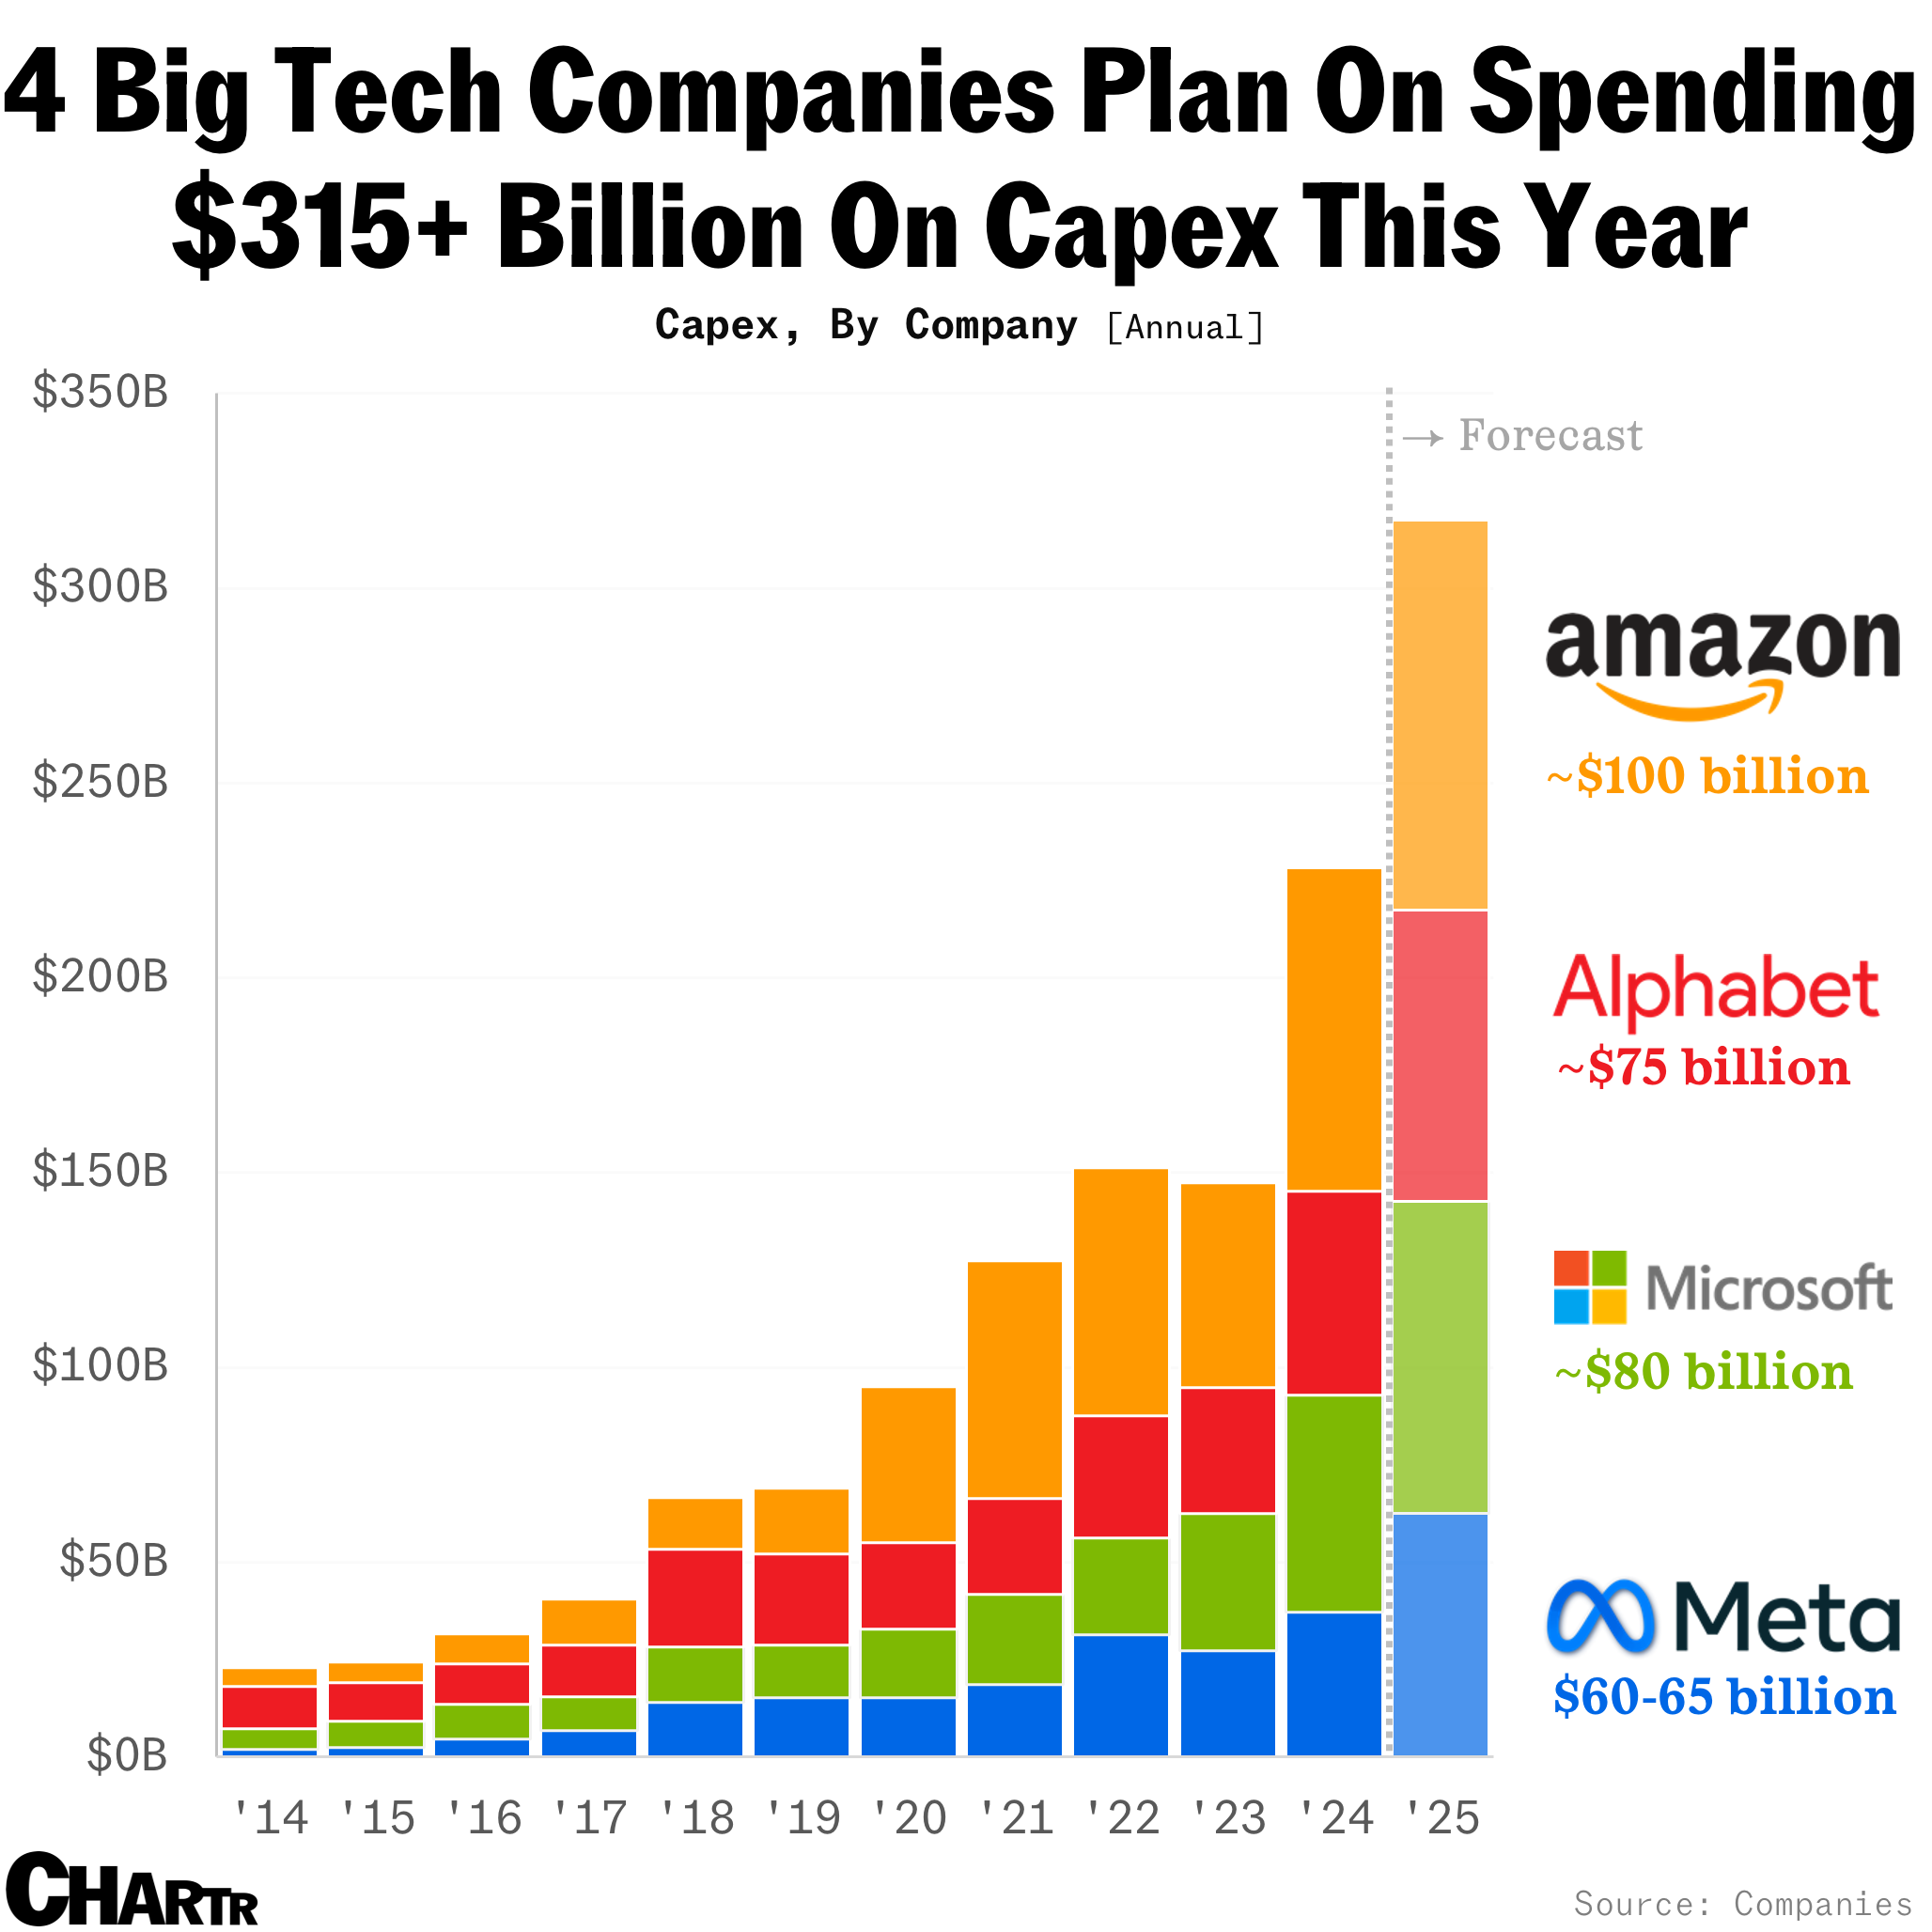
Amazon expects to invest approximately $200 billion in capital expenditures during 2026, covering AI infrastructure as well as investments across the broader company.
Management has said the spending is supported by strong demand in AI, custom chips, cloud computing, robotics, and satellite infrastructure.
The economic argument is based on a timing mismatch.
AWS must purchase land, secure electricity, construct data centers, and install chips, servers, and networking equipment before customers can use the capacity.
Management estimates that this investment can occur six to 24 months before customer billing begins. Data centers may remain productive for more than 30 years, while servers, chips, and networking equipment generally have useful lives of approximately five to six years.
That creates a predictable pattern:
- Cash outflow comes first.
- Infrastructure is constructed and commissioned.
- Customer workloads gradually occupy the available capacity.
- Revenue and utilization increase.
- Returns improve as infrastructure becomes more fully utilized.
Amazon argues that much of the AWS capacity funded in 2026 will be monetized during 2027 and 2028.
Management also says a substantial portion of planned AWS capex is already associated with completed, unannounced, or advanced customer agreements, including an OpenAI commitment valued at more than $100 billion.
The bull case is therefore not that $200 billion immediately produces $200 billion of additional revenue.
It is that Amazon is constructing long-lived infrastructure against visible demand and will monetize that infrastructure over several years.
The bear case is that the capacity arrives faster than enterprise AI consumption, causing utilization to disappoint while depreciation, electricity, and financing costs continue to rise.
How Much AWS Growth Would Make the Spending Credible?
There is no single growth rate that automatically validates the capex plan.
A better framework combines revenue growth, incremental operating income, utilization, and forward demand.
For Q2, the following ranges offer a practical scenario framework:
| AWS result | Possible interpretation |
|---|---|
| Above 28% growth | Strong evidence that AI workloads and core cloud migration remain robust |
| 25%–28% growth | Healthy expansion, but investors may demand more capex visibility |
| 22%–25% growth | Growth remains respectable, though the $200B spending plan becomes harder to defend |
| Below 22% growth | Material risk that spending is rising much faster than near-term monetization |
These are analytical thresholds rather than company guidance.
The market could still respond positively to slower revenue growth if bookings, remaining performance obligations, contracted capacity, or forward guidance improve materially.
Four Tests That Will Determine Whether Amazon’s AI Investment Is Working
1. AWS Must Grow Without Sacrificing Too Much Margin
AWS does not need to maintain a 37%–38% operating margin every quarter.
New data centers, accelerated-computing deployments, and depreciation can create temporary pressure.
However, a major margin decline combined with slowing revenue would be a warning.
Investors should distinguish between two very different explanations:
- Constructive margin pressure: Amazon is activating capacity tied to identifiable customer demand.
- Destructive margin pressure: Costs are rising while bookings, utilization, or revenue growth weaken.
A Q2 AWS margin above approximately 35%, accompanied by growth near the Q1 rate, would suggest Amazon is managing the expansion effectively.
A margin below the low-30% range could raise questions unless management provides unusually strong forward-demand evidence.
2. Custom Chips Must Improve the Economics of AI Compute
Trainium and Graviton are strategically important because they allow AWS to control more of its infrastructure stack.
They can potentially lower inference and training costs, reduce dependence on outside suppliers, and create differentiated cloud services.
Amazon reported that Trainium and Graviton were growing at triple-digit rates, while Trainium2 was fully subscribed and Trainium3 supply was expected to be largely committed by mid-2026.
The most useful Q2 signals would include:
- Higher Trainium adoption among customers beyond Anthropic and OpenAI.
- Evidence that Trainium reduces the cost of training or inference.
- Better availability of Trainium3 capacity.
- Increased Bedrock workloads running on Amazon-designed silicon.
- Stable AWS margins despite a larger mix of AI compute.
If custom silicon improves price-performance while preserving cloud margins, Amazon’s capex could create both revenue growth and a structural cost advantage.
3. Customer Commitments Must Convert Into Revenue
Large commitments are reassuring, but they are not equivalent to recognized revenue.
Investors need to understand:
- When contracted capacity will become operational.
- How quickly customers will consume their commitments.
- Whether contracts contain minimum-spend provisions.
- How much capacity is allocated to a small number of frontier-model companies.
- Whether enterprise demand is broadening beyond the largest AI laboratories.
Customer concentration may be acceptable during the early infrastructure buildout.
However, a durable return on $200 billion of spending ultimately requires a diversified customer base across financial services, healthcare, software, government, media, manufacturing, and consumer applications.
4. Free Cash Flow Must Have a Credible Path to Recovery
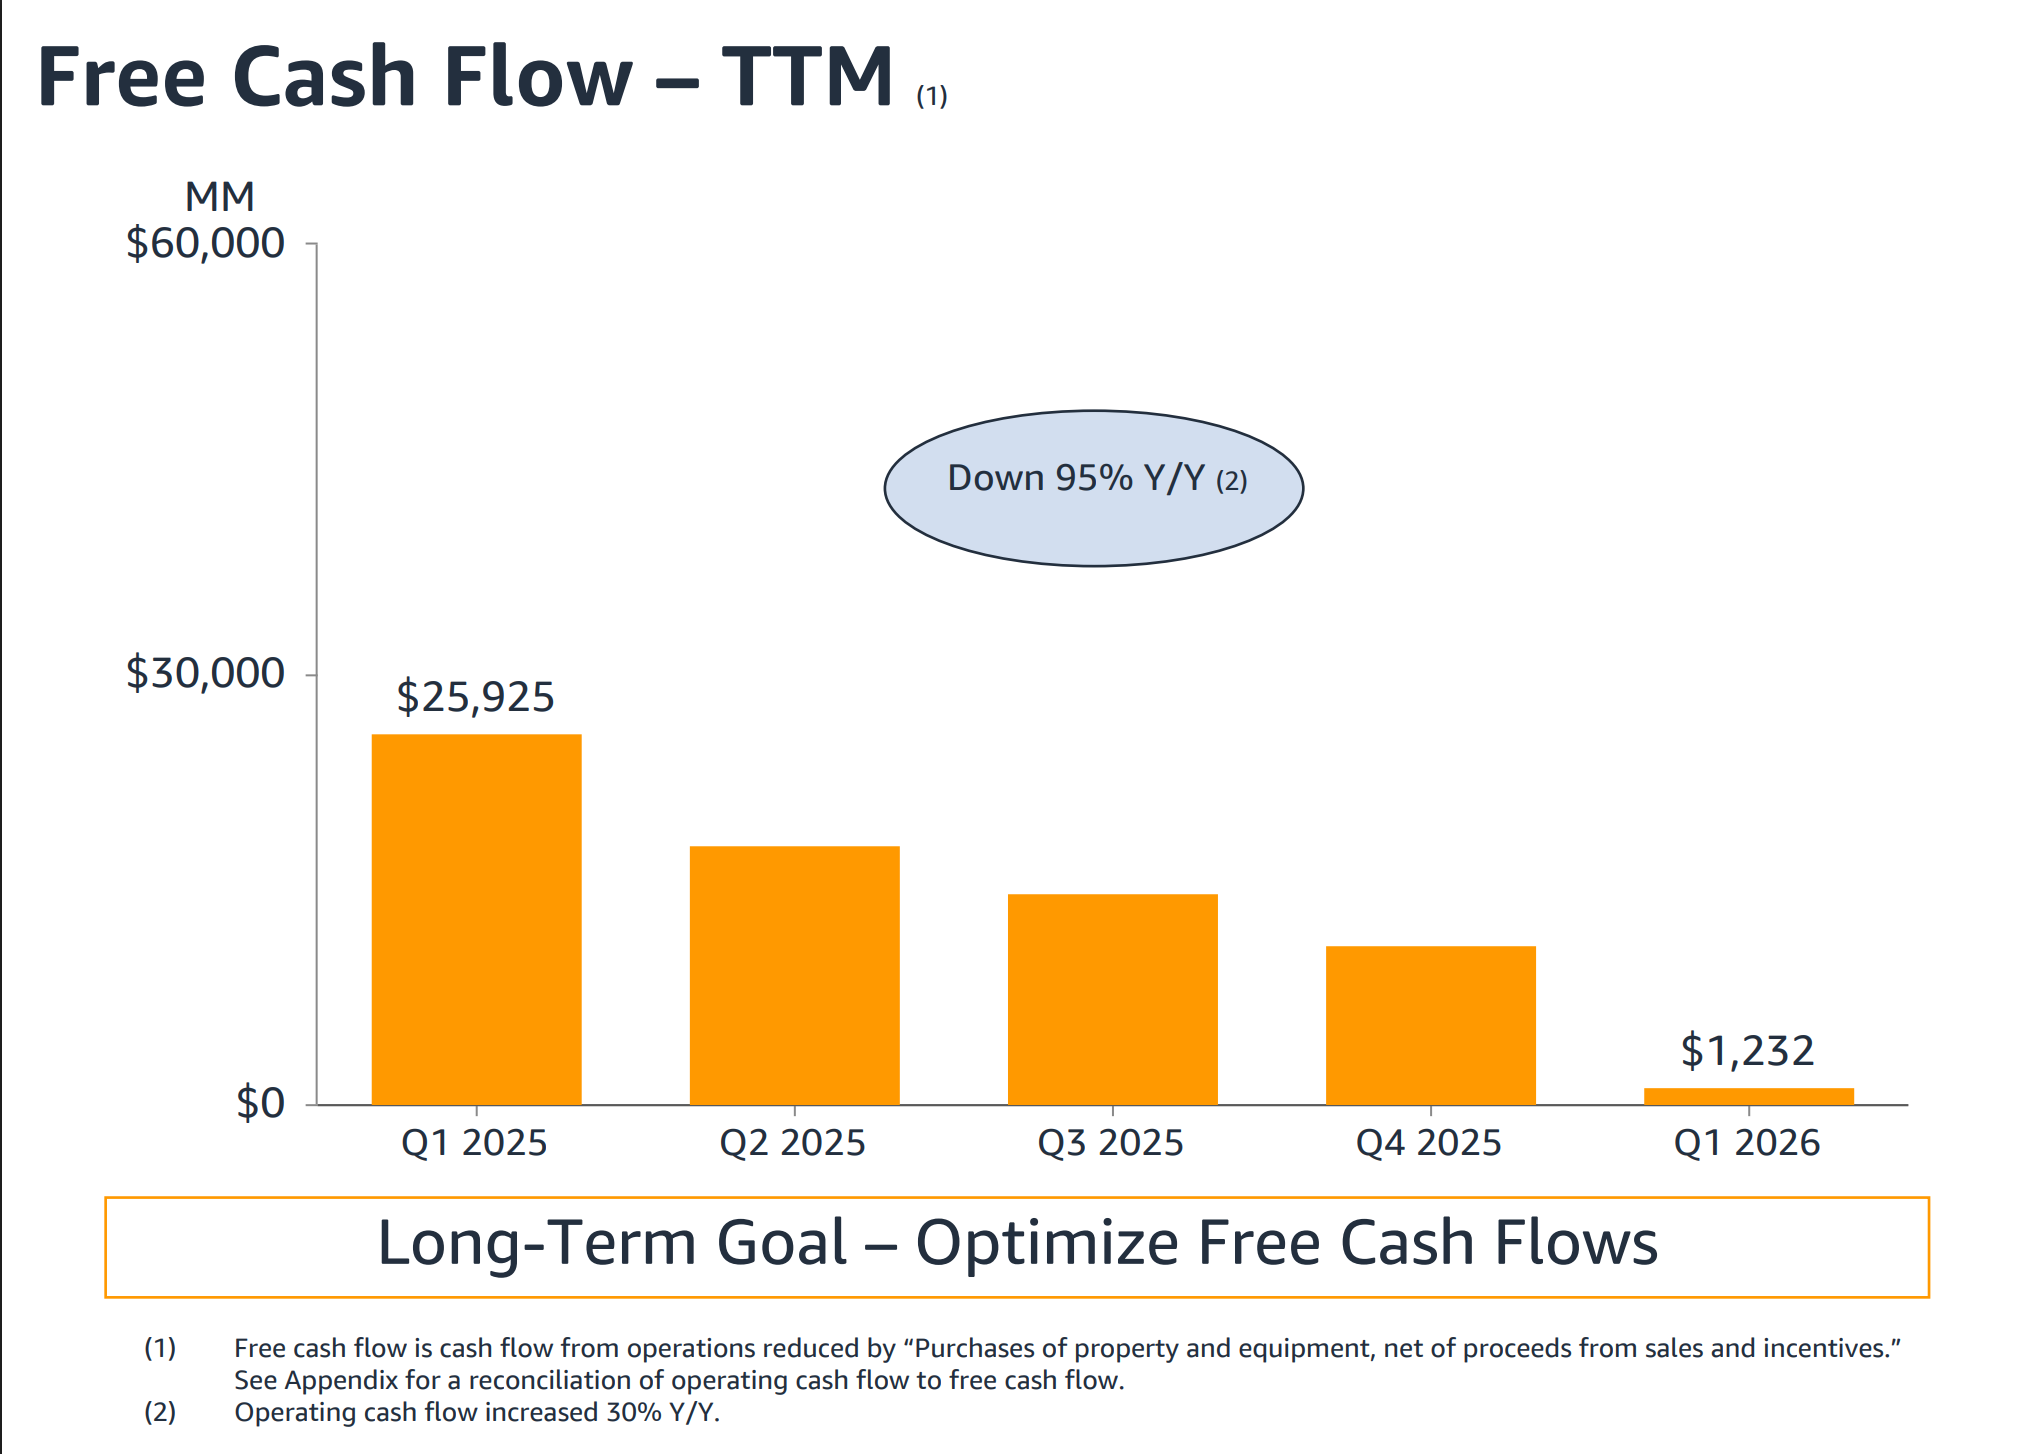
Amazon’s trailing-12-month operating cash flow rose 30% to $148.5 billion in Q1.
Yet trailing free cash flow fell to only $1.2 billion, primarily because property-and-equipment investment rose sharply.
Purchases of property and equipment reached approximately $151 billion over the trailing 12 months, including $44.2 billion in the first quarter alone.
The low free-cash-flow figure is not automatically bearish. It may represent a temporary investment phase.
But management must show how the business moves from cash consumption to cash generation.
For Amazon, the central valuation question is shifting from “How much cash does AWS generate today?” to “How much normalized free cash flow can the current infrastructure create after utilization rises?”
Amazon Q2 Earnings 2026 Investor Scorecard
Investors can use the following scorecard when the results are released.
| Metric | Bullish signal | Neutral signal | Bearish signal |
|---|---|---|---|
| AWS revenue growth | Above 28% | 25%–28% | Below 25% |
| AWS operating margin | Above 36% | 33%–36% | Below 33% |
| 2026 capex outlook | Near $200B with stronger commitments | Moderate increase with explanation | Large increase without demand visibility |
| Bedrock and AI usage | Continued rapid usage expansion | Healthy but moderating growth | Weak adoption commentary |
| Trainium demand | Broader adoption and committed supply | Demand led by a few major customers | Delays or weak utilization |
| Q3 revenue guidance | Above expectations | In line | Below expectations |
| Free-cash-flow outlook | Clear 2027–2028 recovery path | Limited new detail | Further deterioration without timeline |
| Retail margins | Stable or improving | Modest pressure | Significant deterioration |
| Advertising growth | Sustained double-digit expansion | Gradual moderation | Sharp slowdown |
The strongest result would combine high-20% AWS growth, resilient margins, and evidence that capex is supported by enforceable customer demand.
A revenue beat alone would not be enough if management materially increases spending without explaining expected utilization.
Bull, Base, and Bear Scenarios for AMZN
Bull Case: AWS AI Demand Absorbs New Capacity
In the bullish scenario, AWS growth remains at or above 28%, Bedrock usage continues expanding rapidly, and Trainium adoption broadens beyond Amazon’s largest strategic AI partners.
AWS margin stays in the mid-to-high 30% range despite higher depreciation.
Management maintains the $200 billion capex plan—or raises it only because additional customer contracts have been signed.
Under this scenario, weak near-term free cash flow is interpreted as a temporary consequence of building revenue-generating infrastructure rather than evidence of deteriorating economics.
Base Case: Strong Growth, but the Cash-Flow Debate Continues
In the base case, AWS grows approximately 25% to 28% and maintains a margin around 34% to 36%.
Amazon reiterates that most 2026 infrastructure will be monetized in 2027 and 2028, but provides limited quantitative information about contracted revenue or expected returns.
The retail and advertising businesses help support consolidated operating income, while free cash flow remains depressed.
This outcome would keep the long-term AI thesis intact but may leave AMZN sensitive to interest rates, competitor spending, and future capex revisions.
Bear Case: Spending Rises as AWS Growth Slows
The bearish scenario would involve AWS growth falling below the mid-20% range while operating margin declines sharply.
A capex increase above $200 billion would become particularly concerning if management cannot connect it to additional customer commitments.
Investors could conclude that Amazon is responding defensively to the cloud and AI spending race rather than allocating capital against sufficiently visible returns.
Recent SimianX research has highlighted this same tension across the AI ecosystem: infrastructure companies can report enormous demand while still facing concerns over cash flow, financing, and return on invested capital.
The issue is explored further in:
- AI Stocks Pull Back: OpenAI Doubts Hit Big-Tech Earnings
- CoreWeave Stock 2026: $100B AI Backlog vs Debt Risk
Retail and Advertising Could Provide an Important Profit Buffer
Although AWS will dominate the earnings discussion, Amazon’s non-cloud businesses remain important.
In Q1, North American sales increased 12% to $104.1 billion, while segment operating income rose to $8.3 billion from $5.8 billion.
International sales increased 19% to $39.8 billion, and the segment produced $1.4 billion of operating income.
Management also said advertising had exceeded a $70 billion trailing-12-month revenue run rate.
Improving retail efficiency can partially offset AI investment pressure through:
- Faster inventory turnover.
- More regionalized fulfillment.
- Higher delivery density.
- Increased automation.
- Better advertising monetization.
- A larger mix of third-party marketplace and service revenue.
Amazon’s Q2 guidance assumes Prime Day occurred during the quarter, meaning retail comparisons may be influenced by the timing of the event.
Investors should therefore examine unit growth and margins rather than relying only on consolidated sales.
Key Risks Ahead of Amazon Q2 Earnings
AI Infrastructure Overcapacity
If AI model training becomes more efficient or customers reduce spending, Amazon could be left with underutilized data-center capacity.
Depreciation Pressure
The cash cost of infrastructure occurs first, but depreciation continues over the useful life of the equipment.
Even after capex growth slows, depreciation can pressure reported operating income.
Power and Supply Constraints
Amazon needs access not only to chips but also to electricity, cooling systems, networking equipment, land, and construction capacity.
Delays in any layer can postpone revenue recognition.
Customer Concentration
Large commitments from OpenAI and Anthropic validate AWS infrastructure, but they may increase dependence on a limited number of rapidly evolving AI companies.
Competitive Spending
Amazon, Alphabet, Microsoft, Meta, and specialist cloud providers are all expanding AI capacity.
Aggressive industry-wide investment could eventually weaken pricing or create excess supply.
Free-Cash-Flow Valuation Risk
When free cash flow falls toward zero, investors must rely on estimates of future normalized cash generation.
Those estimates are sensitive to utilization, asset life, pricing, maintenance capex, and the pace of technology replacement.
A Step-by-Step Checklist for Reading the Earnings Report
- Compare total revenue with the $194B–$199B guidance range.
- Calculate AWS year-over-year growth and sequential growth.
- Divide AWS operating income by AWS revenue to estimate segment margin.
- Compare Q2 capex with the $44.2B spent on property and equipment in Q1.
- Read management’s comments on 2027 and 2028 capacity monetization.
- Look for new OpenAI, Anthropic, or enterprise customer commitments.
- Track Bedrock, Trainium, and AI revenue indicators.
- Separate operating profit from investment-related gains in reported net income.
- Evaluate Q3 guidance rather than focusing exclusively on Q2 results.
- Use SimianX AI to compare the fundamental report with price action, news sentiment, and broader AI-sector positioning.
FAQ About Amazon Q2 Earnings 2026
When Will Amazon Report Q2 Earnings in 2026?
Amazon is scheduled to report its second-quarter 2026 financial results on July 30, 2026, with its conference call beginning at 5:00 p.m. Eastern Time.
The company will publish the earnings release and supporting materials through its investor-relations website.
How Much Will Amazon Spend on AI in 2026?
Amazon expects total company capital expenditures of approximately $200 billion in 2026.
A substantial portion is connected to AWS and AI infrastructure, although the total also includes investments in other Amazon operations.
Can AWS Growth Justify Amazon’s $200B Capex Plan?
It can, but only if AWS maintains strong growth, preserves attractive margins, and converts contracted AI capacity into revenue.
Investors should also demand a credible path from near-term cash-flow pressure to stronger free cash flow in 2027 and beyond.
What Is the Most Important Amazon Q2 Earnings Metric?
AWS revenue growth is the clearest headline metric, but it should be evaluated alongside AWS operating margin, capex, customer commitments, and forward guidance.
A strong growth number with collapsing margins would be less encouraging than balanced growth and profitability.
Is Amazon Stock Only an AWS and AI Investment?
No. Amazon also owns major retail, advertising, subscription, logistics, healthcare, entertainment, robotics, and satellite businesses.
Nevertheless, AWS generates a large portion of operating income, making cloud growth central to the investment case.
Conclusion
The Amazon Q2 Earnings 2026 report will test whether Amazon can convert unprecedented AI infrastructure investment into measurable revenue, operating income, and long-term cash generation.
The starting position is strong. AWS grew 28% in Q1, delivered $14.2 billion of operating income, and reported rapidly rising demand for Bedrock, Trainium, and AI workloads.
Amazon also says that a substantial portion of its upcoming capacity is supported by customer commitments.
The challenge is equally clear.
Free cash flow has fallen sharply as infrastructure spending accelerates, and investors must wait for much of the 2026 capacity to begin generating revenue during 2027 and 2028.
A convincing quarter would contain more than an earnings beat. It would show that:
- AWS growth remains near the high-20% range.
- AWS margins can absorb rising infrastructure costs.
- Trainium and Bedrock are creating differentiated economics.
- Customer commitments are converting into usable capacity.
- Amazon has a credible path back to substantial free cash flow.
For investors following AMZN, AWS, and the broader AI capital-expenditure cycle, SimianX AI can help connect earnings fundamentals with market sentiment, technical behavior, and cross-sector AI signals.
The decisive question is no longer whether Amazon can spend $200 billion. It is whether the company can transform that spending into a larger, more profitable, and more defensible cloud platform.
Related Reading
- Microsoft Q4 Earnings 2026: Azure Growth vs AI Capex Risk
- Alphabet Q2 Earnings 2026: Can Gemini, Cloud Justify Capex?
- Meta Compute 2026: Can Excess AI Capacity Drive Revenue?
- Oracle Earnings 2026: OCI, Stargate Backlog & ORCL Stock
- CoreWeave Stock 2026: $100B AI Backlog vs Debt Risk
- AI Stocks Pull Back: OpenAI Doubts Hit Big-Tech Earnings