
The Midterm Sector Trade: One Sector Has Won 11 Elections in a Row
Everyone knows the headline midterm statistic. The S&P 500 has been positive in the twelve months after almost every midterm election, and that fact gets repeated every two years. It is true, and we have documented it in detail in our reference table of midterm election years since 1950.
It is also close to useless as an investment decision, because it tells you to own the whole market — which is what most people already do.
The more interesting question, and the one almost nobody has measured properly, is which part of the market you should have owned. This article answers it with a hundred years of data. Across the last 25 midterm elections, going back to 1926, technology has beaten the broad market in the twelve months afterwards 18 times. No other sector comes close, and technology's last failure was in 1978 — it has now won eleven midterm cycles in a row.
At the other end, energy and telecoms beat the market after fewer than a third of midterms.
How this was measured
Two independent datasets, deliberately.
The long sample uses the 12 value-weighted industry portfolios from the Kenneth R. French Data Library, the standard academic decomposition of the U.S. market, with monthly returns starting in July 1926. For each midterm year I compound the twelve months from November of the election year through the following October — the window that starts the month the votes are counted. The market benchmark is the French total market return, not a price index, so dividends are included on both sides.
The modern sample uses the nine original SPDR Select Sector ETFs, priced from split- and dividend-adjusted daily closes, measured from the election-day close to the same calendar date one year later. This covers the five midterms from 2006 to 2022. It exists as a cross-check: if the deep pattern is real, it should still show up in instruments you can actually buy.
Both samples are reported separately below. Where they disagree, I say so.
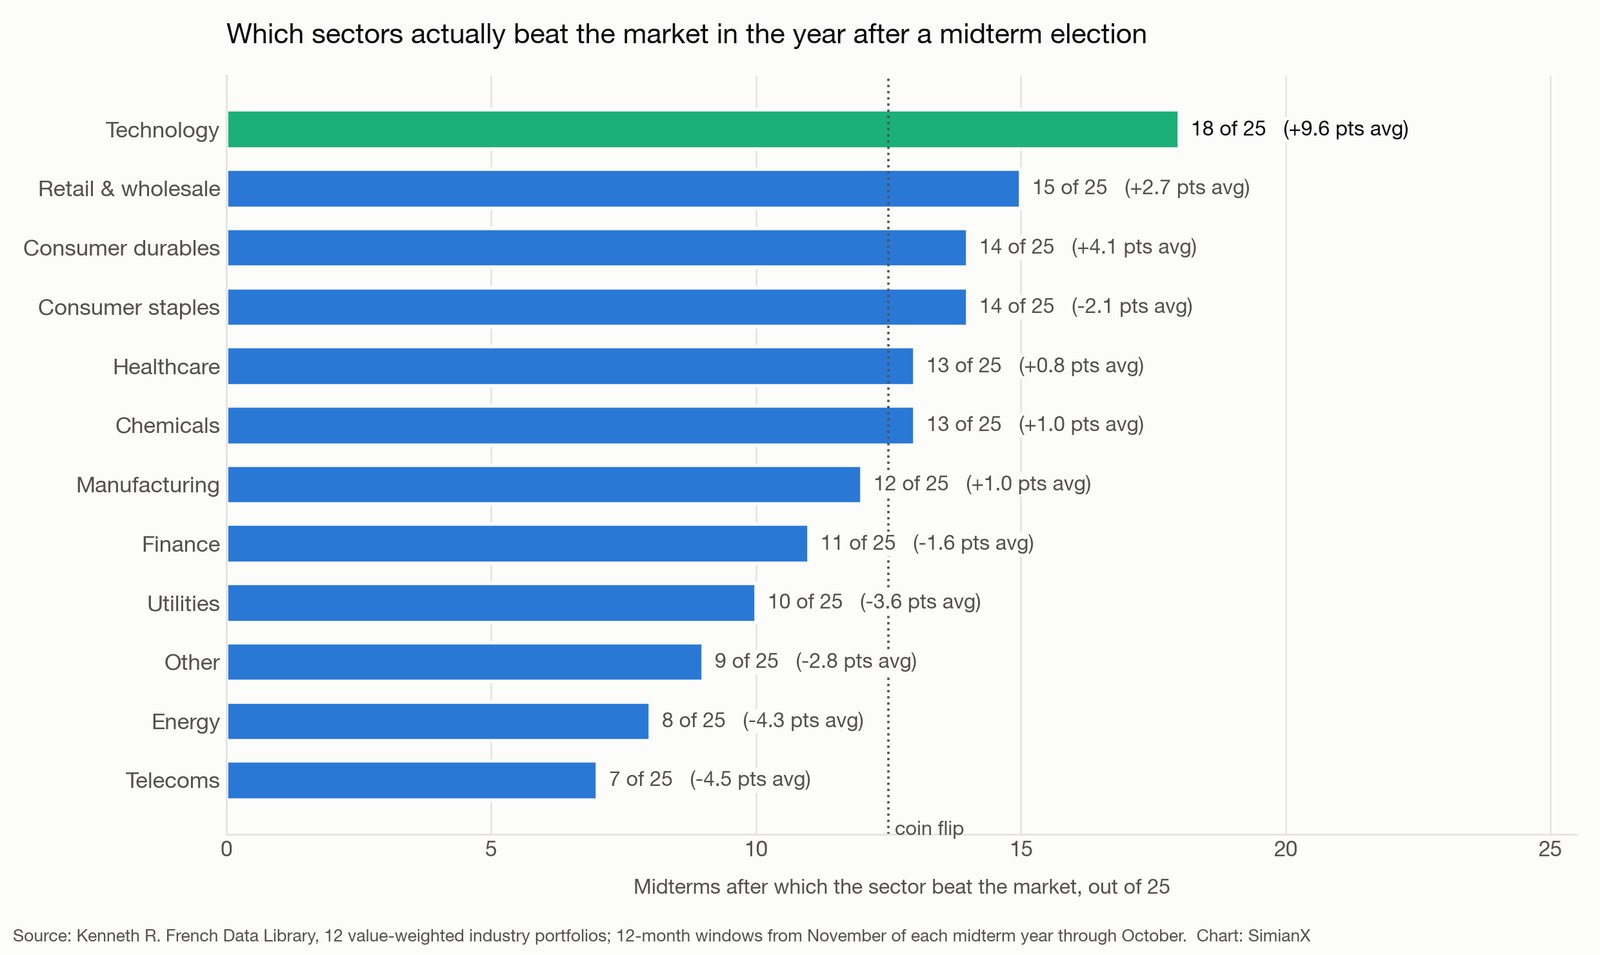
The scoreboard: 25 midterms, 1926 to 2022
Returns are total returns over the twelve months following each midterm election. "Beat market" counts the elections after which the sector outperformed the whole U.S. market over that window.
| Sector | Average 12-month return | Positive | Beat market | Average excess |
|---|---|---|---|---|
| Technology | +28.7% | 92% | 18 of 25 | +9.6 pts |
| Retail & wholesale | +21.9% | 88% | 15 of 25 | +2.7 pts |
| Consumer durables | +23.3% | 88% | 14 of 25 | +4.1 pts |
| Consumer staples | +17.1% | 88% | 14 of 25 | −2.1 pts |
| Healthcare | +19.9% | 88% | 13 of 25 | +0.8 pts |
| Chemicals | +20.2% | 92% | 13 of 25 | +1.0 pts |
| Manufacturing | +20.2% | 92% | 12 of 25 | +1.0 pts |
| Finance | +17.6% | 76% | 11 of 25 | −1.6 pts |
| Utilities | +15.6% | 76% | 10 of 25 | −3.6 pts |
| Other | +16.3% | 88% | 9 of 25 | −2.8 pts |
| Energy | +14.8% | 76% | 8 of 25 | −4.3 pts |
| Telecoms | +14.6% | 80% | 7 of 25 | −4.5 pts |
| Whole market | +19.2% | 96% | — | — |
Three things deserve attention.
The whole-market number confirms the familiar statistic: 24 of the 25 twelve-month windows were positive, the single exception being 1930, in the depths of the Depression. That is the fact everyone quotes.
Technology is the only sector with a genuinely durable edge. An 18-of-25 hit rate against the market is not decisive on its own — but the average margin of victory is +9.6 percentage points, and the seven losses are concentrated in the early part of the sample. Technology underperformed after the midterms of 1930, 1938, 1946, 1950, 1954, 1970 and 1978. Since then: eleven wins, no losses.
The consistent laggards are the sectors people most often buy for safety and for policy exposure. Utilities, energy and telecoms all lost to the market in roughly two-thirds of these windows, and all three did so with a negative average margin. Buying defensiveness into a post-election year has historically cost about three to four points a year against simply owning the index.
Why the index statistic hides the real opportunity
The average post-midterm market return is +19.2%. The median gap between the best and worst performing sector in the same window is 38.5 points, and the mean gap is 44.6 points.
In other words, the dispersion within the market after a midterm is roughly twice the size of the move of the market. Getting the index call right and the sector call wrong has historically been a much worse outcome than getting the index call wrong and the sector call right.
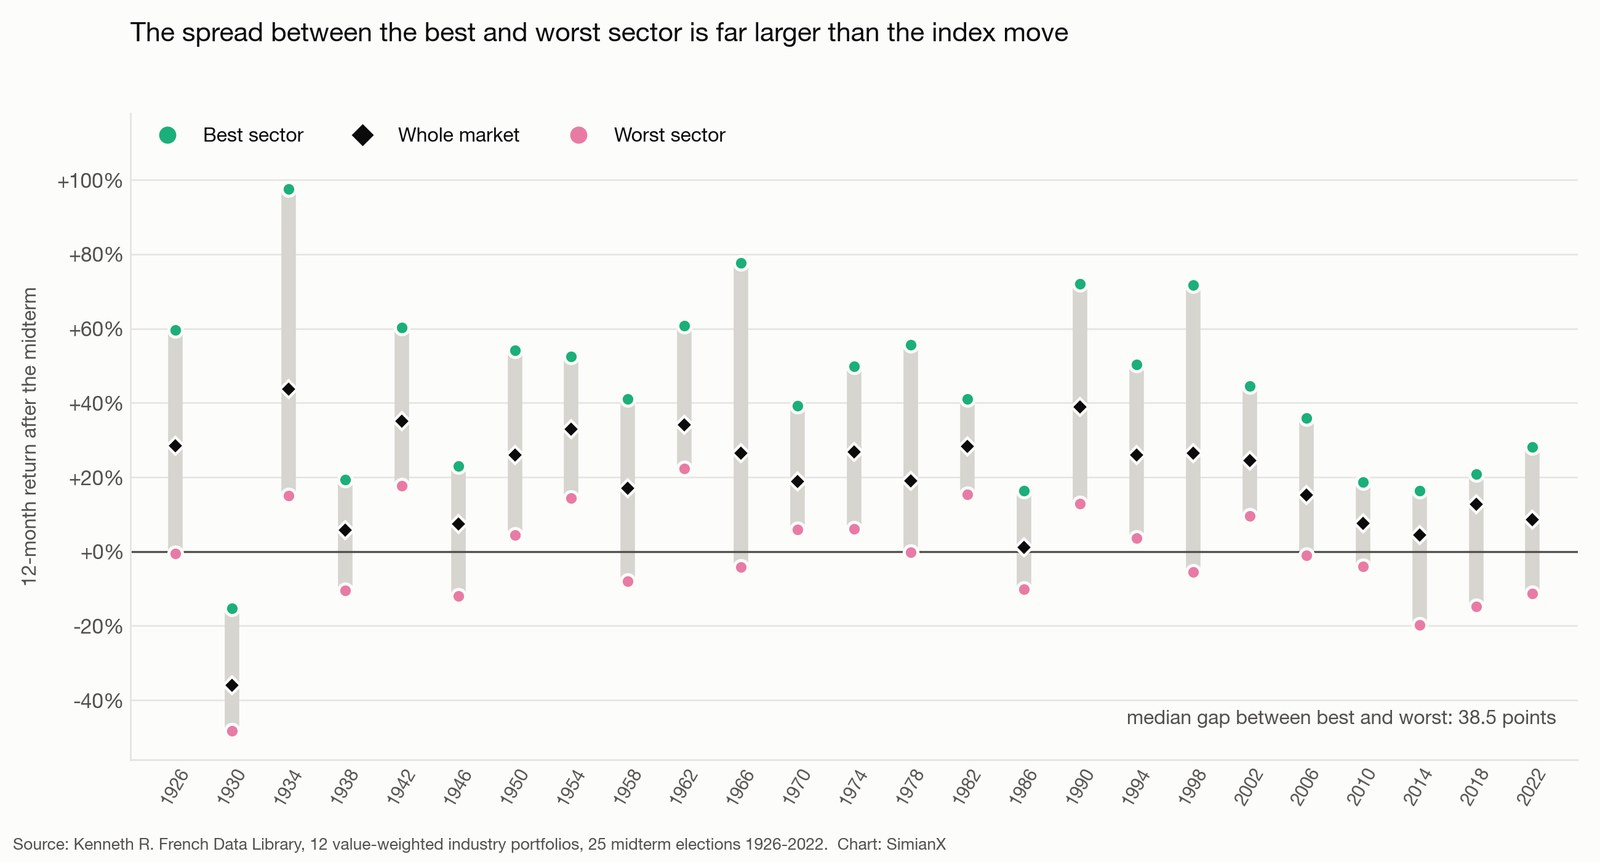
Here is the same information as a reference table — every midterm election, the market's twelve-month return, and the sectors at either end of it.
| Election | Market | Best sector | Worst sector | Spread |
|---|---|---|---|---|
| 1926 | +28.5% | Chemicals +59.6% | Energy −0.6% | 60 pts |
| 1930 | −36.1% | Retail −15.3% | Other −48.2% | 33 pts |
| 1934 | +43.8% | Durables +97.6% | Other +15.1% | 82 pts |
| 1938 | +5.7% | Telecoms +19.4% | Technology −10.5% | 30 pts |
| 1942 | +35.0% | Utilities +60.2% | Chemicals +17.7% | 43 pts |
| 1946 | +7.4% | Durables +22.9% | Healthcare −12.0% | 35 pts |
| 1950 | +25.9% | Energy +54.1% | Staples +4.4% | 50 pts |
| 1954 | +32.9% | Durables +52.4% | Telecoms +14.4% | 38 pts |
| 1958 | +17.0% | Healthcare +41.1% | Energy −8.0% | 49 pts |
| 1962 | +34.0% | Durables +60.7% | Utilities +22.3% | 38 pts |
| 1966 | +26.5% | Technology +77.6% | Utilities −4.3% | 82 pts |
| 1970 | +18.9% | Retail +39.3% | Energy +5.9% | 33 pts |
| 1974 | +26.8% | Retail +49.8% | Healthcare +6.1% | 44 pts |
| 1978 | +18.9% | Energy +55.7% | Telecoms −0.2% | 56 pts |
| 1982 | +28.3% | Durables +41.0% | Telecoms +15.3% | 26 pts |
| 1986 | +1.1% | Telecoms +16.3% | Finance −10.1% | 26 pts |
| 1990 | +38.8% | Finance +72.0% | Energy +12.8% | 59 pts |
| 1994 | +26.0% | Technology +50.3% | Durables +3.6% | 47 pts |
| 1998 | +26.5% | Technology +71.8% | Staples −5.4% | 77 pts |
| 2002 | +24.5% | Technology +44.5% | Telecoms +9.6% | 35 pts |
| 2006 | +15.1% | Energy +36.0% | Finance −1.1% | 37 pts |
| 2010 | +7.5% | Energy +18.7% | Finance −4.0% | 23 pts |
| 2014 | +4.4% | Retail +16.3% | Energy −19.7% | 36 pts |
| 2018 | +12.7% | Chemicals +20.8% | Energy −14.7% | 36 pts |
| 2022 | +8.5% | Technology +28.1% | Durables −11.3% | 39 pts |
Technology takes the top slot five times, tied with consumer durables. Energy also takes it four times — which is the point worth holding onto. Energy is capable of leading, spectacularly, when the oil price cooperates; it just does not do so reliably, and it finished last in four of the last five midterm windows.
The ETF era: does it still work with real tickers?
Academic industry portfolios are the right tool for a long sample, but nobody can buy them. The modern test uses instruments that trade.
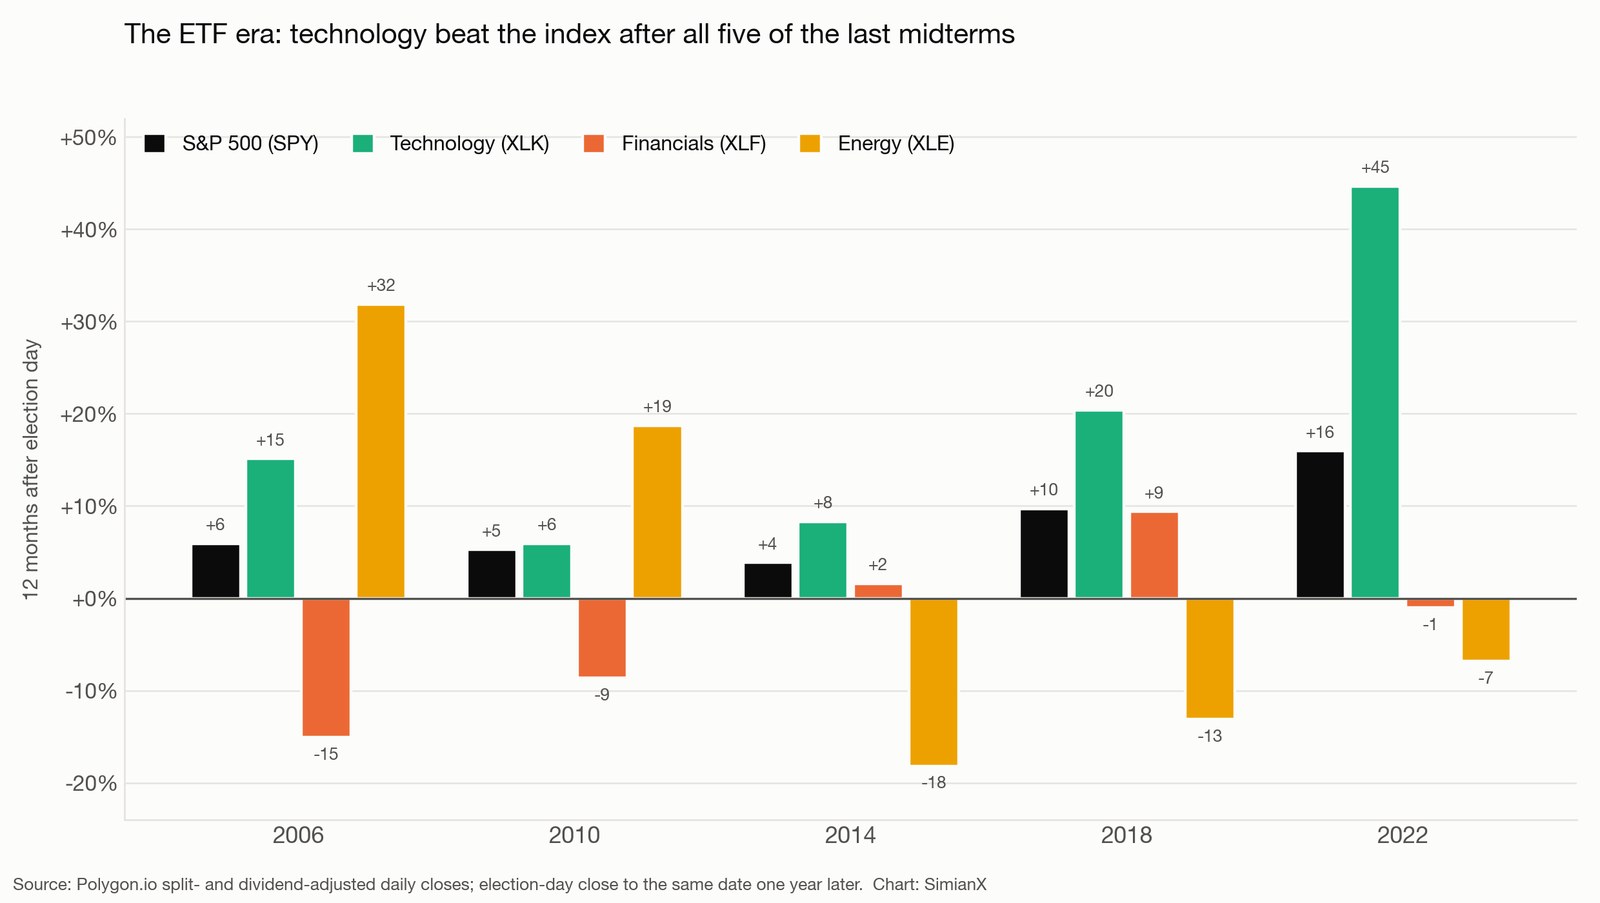
| Fund | 2006 | 2010 | 2014 | 2018 | 2022 | Average | Beat SPY |
|---|---|---|---|---|---|---|---|
| SPY — S&P 500 | +5.9% | +5.3% | +3.9% | +9.7% | +16.0% | +8.1% | — |
| XLK — Technology | +15.1% | +5.9% | +8.3% | +20.4% | +44.6% | +18.9% | 5 of 5 |
| XLY — Consumer discretionary | −7.0% | +9.2% | +20.5% | +8.7% | +20.2% | +10.3% | 3 of 5 |
| XLI — Industrials | +14.6% | +4.1% | −1.1% | +11.4% | +5.8% | +6.9% | 2 of 5 |
| XLU — Utilities | +18.5% | +10.8% | −6.0% | +13.0% | −8.7% | +5.5% | 3 of 5 |
| XLB — Materials | +26.0% | +0.1% | −5.9% | +7.0% | +0.5% | +5.5% | 1 of 5 |
| XLP — Consumer staples | +9.6% | +7.8% | +4.7% | +7.7% | −4.8% | +5.0% | 3 of 5 |
| XLV — Healthcare | +5.4% | +6.4% | +7.1% | +1.4% | −4.5% | +3.1% | 2 of 5 |
| XLE — Energy | +31.9% | +18.7% | −18.2% | −13.1% | −6.8% | +2.5% | 2 of 5 |
| XLF — Financials | −15.0% | −8.6% | +1.6% | +9.4% | −1.0% | −2.7% | 0 of 5 |
The tradeable version is, if anything, sharper than the academic one. Technology beat the index after all five of the last midterms, by an average of nearly eleven points a year. Financials lost to it all five times and produced a negative average return in windows where the index averaged +8.1%.
The energy row is instructive in a different way. It won big in 2006 and 2010, then lost in three consecutive windows. An investor who extrapolated the first two observations into a rule would have been wrong three times running. That is what a two-observation "pattern" is worth, and it is why the hundred-year sample matters more than the recent one.
Why the pattern might exist
Three mechanisms are plausible, and none of them is provable from return data alone.
The first is the policy vacuum. A midterm result that splits Congress, or splits Congress from the White House, effectively ends major legislation until the next presidential cycle. Sectors whose earnings depend on the tax code, on subsidies, on rate regulation or on appropriations — utilities, energy, telecoms, defence — lose the option value of favourable legislation. Sectors whose earnings depend on the product cycle simply carry on. That is consistent with which sectors sit at the bottom of the table, and it is the same mechanism we traced through the energy sector after past midterms and through defence budgets, both of which turned out to be far less election-sensitive than the headlines suggested.
The second is duration. The post-midterm year has historically coincided with the point in the cycle where policy uncertainty falls and, more often than not, monetary conditions stop tightening — the pattern behind the presidential cycle's strong third year. Long-duration equities, which is what technology is, gain the most when the discount rate stops rising. That connects the sector result to the rate cycle rather than to the ballot.
The third is uncomfortable and should be stated plainly: technology has outperformed over most rolling periods since 1926, not only after midterms. Some of the 18-of-25 record is simply the sector's long-run trend showing up in a window that happens to be labelled "post-midterm." The honest way to read the table is that the midterm window did not interrupt technology's trend, while it did interrupt the trends of the policy-sensitive sectors.
The limits of this analysis
Twenty-five observations is a real sample by the standards of election studies and a small one by the standards of statistics. A hit rate of 18 out of 25 would occur by chance roughly 4% of the time for a sector with no true edge — suggestive, not conclusive, and that calculation assumes independence between elections, which returns do not have.
The industry definitions are not the GICS sectors your brokerage uses. "Business equipment" in the French data covers computers, software and electronic equipment; it is a close cousin of today's technology sector but not identical, and the 1926 version of it is a very different set of companies from the 2026 version.
Every one of the five modern midterms produced divided government, so the ETF sample cannot separate "post-midterm" from "divided government." The longer sample contains both outcomes — 2002, for example, left Republicans in control of both chambers with a Republican president — but not in numbers large enough to test the difference reliably.
And a twelve-month window is a choice. It is the conventional one, and it is what makes this table comparable to the index-level midterm record, but a six-month or twenty-four-month window would produce a different table.
The 2026 setup
Americans vote on 3 November 2026. Here is where the sectors stand going into it, year to date through 3 September.
| Fund | 2026 year to date |
|---|---|
| XLE — Energy | +43.3% |
| XLK — Technology | +30.1% |
| XLB — Materials | +15.6% |
| XLI — Industrials | +13.0% |
| SPY — S&P 500 | +12.9% |
| XLV — Healthcare | +10.8% |
| XLP — Consumer staples | +8.9% |
| XLRE — Real estate | +8.9% |
| XLF — Financials | +6.1% |
| XLU — Utilities | +0.9% |
| XLY — Consumer discretionary | −3.8% |
| XLC — Communication services | −4.8% |
Two things about this setup differ from the historical average.
Technology enters the window already up 30% on the year and carrying the heaviest index weight in history, a concentration we examined in the Magnificent 7's share of the S&P 500. The pattern was built mostly on windows where technology started from a less demanding base. The sector is also now financing an enormous buildout with debt rather than cash flow, a change we documented in the 2026 AI capital-expenditure data — which makes it more rate-sensitive than in previous cycles, not less.
Energy is leading the market by thirty points, having been the worst post-midterm sector in four of the last five cycles. Either the historical relationship is about to be tested hard, or the sector has already priced the good news.
The other live variable is the rate path, which the September Fed decision and the midterm calendar have now entangled, with the long end of the curve at its highest yields since 2007. If the duration mechanism is the real driver of the sector pattern, then bond yields matter more to this trade than the seat count does.
Frequently asked questions
What is the best sector to own after a midterm election?
On a hundred years of data, technology: it beat the whole market after 18 of 25 midterms, by an average of 9.6 percentage points, and after all five of the last five when measured with the tradeable XLK sector fund. That is a historical record, not a forecast, and the sample is small enough that it should size a position rather than justify one.
Which sectors have done worst after midterms?
Telecoms (7 of 25), energy (8 of 25) and utilities (10 of 25) in the long sample. In the ETF era, financials are the standout laggard — XLF failed to beat the S&P 500 after any of the last five midterms and averaged a negative return over those windows.
Does it matter which party wins?
Far less than the sector you own. The dispersion between the best and worst sector after a midterm averages 44.6 points; the difference between election outcomes is much smaller than that and much harder to predict. Our twelve-stock map of the 2026 scenarios sets out what actually changes under each configuration of Congress, and in most cases the answer is: less than the campaign coverage implies.
Is the "stocks always rise after midterms" statistic real?
Yes, and it is stronger than most seasonal claims: 24 of 25 twelve-month windows since 1926 were positive, the only exception being 1930. But it is a statement about the index. It offers no guidance at all about the 44-point gap between the sectors inside that index, which is where the decisions actually get made.
Why use 1926 rather than a more recent start date?
Because the modern sample is too small to distinguish signal from luck. Five midterms is five observations; a sector can win all five by chance about 3% of the time. Extending to 1926 gives 25 observations and, more importantly, includes regimes very unlike the present — the Depression, the war years, the 1970s inflation — which is exactly what stress-tests a seasonal pattern.
Do these numbers include dividends?
Yes. The long sample uses total returns from the French data library, and the ETF sample uses dividend- and split-adjusted closes. Comparing a price index against total-return sector data is a common error that flatters the sectors, and it is avoided here.
How should this change a portfolio?
For most investors it should adjust a tilt rather than drive a trade. The defensible reading is that the year after a midterm has historically been a poor time to move into policy-sensitive defensiveness — utilities, telecoms, energy — and that the burden of proof sits with anyone underweighting technology into that window. Position sizing should reflect that this is 25 observations, not 2,500.
The bottom line
The famous midterm statistic is about the index and it is true, but it is not actionable. The actionable finding sits one level down: after 25 midterm elections since 1926, the gap between the best and worst sector has averaged 44.6 points, and one sector has taken the winning side of that gap far more often than chance allows.
Technology beat the market after 18 of 25 midterms, has not lost one since 1978, and beat the S&P 500 after all five of the last five as a tradeable fund. Energy, telecoms and utilities have been on the wrong side roughly two-thirds of the time.
Going into 3 November 2026, both ends of that historical relationship are stretched — technology is already up 30% on the year and energy is up 43%. The pattern has survived worse setups than this one. It has never been tested from this one.
Sources. Long sample: Kenneth R. French Data Library, 12 value-weighted industry portfolios and the market factor, monthly total returns from July 1926; twelve-month windows compounded from November of each midterm year through the following October. Modern sample: Polygon.io split- and dividend-adjusted daily closes for the SPDR Select Sector funds and SPY, measured from each election-day close to the same date one year later. Election dates from the official federal calendar. Charts produced by SimianX from the underlying return data. For definitions see sector rotation, total return and the Fama-French industry classifications.
Related reading
- Midterm Election Years and the Stock Market: 1950–2026 — the index-level record this article sits beneath
- 2026 Midterm Election Stocks: 12 Tickers, 3 Scenarios — what changes under each configuration of Congress
- The Presidential Cycle: S&P 500 Returns by Year, 1928-2025 — where the post-midterm year sits in the four-year pattern
- Will the 2026 Midterms Move Healthcare Stocks UNH, HUM, CVS? — the sector where policy exposure is most direct
- Government Shutdowns and the Stock Market: 1976–2026 — the other political event that markets reliably ignore