
 By Muke
dLocal Q3 2026: Payments Grew 77%, but Revenue per Dollar Kept Falling
dLocal reported third-quarter 2026 results after the U.S. market closed on November 12. Total payment volume (TPV) rose 77% and revenue rose 41%, yet revenue was almost flat against the second quarter and came in below the consensus published by Investing.com. Management also said full-year operating-profit growth was now tracking toward the lower end of its guidance range. DLO fell about 3% after hours and opened 3.4% lower on November 13, then recovered to close at $13.69, down just 0.07%.
The apparent contradiction disappears when investors separate payment volume from the revenue and profit generated by that volume.
A payments company can process substantially more money while earning less revenue per dollar processed. It can also improve operating efficiency while facing a less favorable growth mix.
That is the central issue in this dLocal Q3 2026 earnings analysis: the company demonstrated operating leverage, but investors received a less convincing signal about near-term monetization and earnings momentum. This page tracks dLocal earnings by quarter, so the same tables can be read against the next report.
Updated November 15, 2026. Company figures come from dLocal's November 12 Form 6-K (earnings release and interim financial statements) and earlier quarterly releases on SEC EDGAR. Guidance commentary comes from the earnings release and the November 12 earnings call. Share prices are official closes from Polygon.io, cross-checked with Nasdaq.com. Third-party estimates and our own calculations are labeled separately.
dLocal Q3 2026 Results at a Glance
The results contained both progress and disappointment.
| Q3 2026 measure | Reported result | Year-over-year change |
|---|---|---|
| Total payment volume | $18.345 billion | +77% |
| Revenue | $398.0 million | +41% |
| Gross profit | $132.0 million | +28% |
| Operating profit | $76.2 million | +37% |
| Net income | $68.0 million | +31% |
| Diluted EPS | $0.23 | Versus $0.17 |
| Company-defined adjusted free cash flow | $99.1 million | +163% |
| Net revenue retention | 140% | Versus 152% in Q1 2026 |
Dollar figures are rounded. Results are for the quarter ended September 30, 2026; financial reporting follows IFRS. Source: dLocal Q3 2026 earnings release (Form 6-K, Exhibit 99.1).
The table describes a growing, profitable business, not an earnings collapse. Operating profit reached 58% of gross profit, the highest ratio since the fourth quarter of 2023, and net income was a quarterly record.
However, markets compare results with expectations and future earnings prospects, not just the previous year.
The bearish interpretation has three components:
- Revenue fell short of the published analyst benchmark.
- Payment volume expanded faster than revenue and gross profit.
- Management's commentary became more cautious within unchanged annual guidance ranges.
Our interpretation is that this combination provides a plausible explanation for the negative early reaction. It does not prove that every seller acted for the same reason.
dLocal Earnings by Quarter: Nine Quarters of Results
The single-quarter headline hides the trend. The table below lines up nine quarters from dLocal's own releases. TPV is in billions of dollars; everything else is in millions of dollars except the ratios.
| Quarter | TPV ($B) | Revenue | Gross profit | Gross margin | Revenue ÷ TPV | Gross profit ÷ TPV | Operating profit | Net income | Diluted EPS |
|---|---|---|---|---|---|---|---|---|---|
| Q3 2024 | 6.5 | 185.8 | 78.2 | 42.1% | 2.85% | 1.20% | 41.1 | 26.8 | $0.09 |
| Q4 2024 | 7.7 | 204.5 | 83.7 | 40.9% | 2.65% | 1.09% | 42.3 | 29.7 | $0.10 |
| Q1 2025 | 8.1 | 216.8 | 84.9 | 39.2% | 2.67% | 1.05% | 45.8 | 46.7 | $0.15 |
| Q2 2025 | 9.2 | 256.5 | 98.9 | 38.6% | 2.78% | 1.07% | 55.8 | 42.8 | $0.14 |
| Q3 2025 | 10.4 | 282.5 | 103.2 | 36.5% | 2.72% | 0.99% | 55.6 | 51.8 | $0.17 |
| Q4 2025 | 13.1 | 337.9 | 115.8 | 34.3% | 2.58% | 0.88% | 62.7 | 55.6 | $0.18 |
| Q1 2026 | 14.1 | 335.9 | 118.7 | 35.3% | 2.39% | 0.84% | 52.8 | 41.9 | $0.14 |
| Q2 2026 | 17.7 | 399.7 | 127.2 | 31.8% | 2.26% | 0.72% | 64.2 | 54.8 | $0.18 |
| Q3 2026 | 18.3 | 398.0 | 132.0 | 33.2% | 2.17% | 0.72% | 76.2 | 68.0 | $0.23 |
Sources: dLocal quarterly earnings releases filed as Form 6-K exhibits on SEC EDGAR. Ratios are our calculations from reported TPV, revenue and gross profit. Q1 2026 operating profit includes a one-off $4.4 million prior-period tax charge; excluding it, operating profit was $57.2 million.
Three patterns stand out:
- TPV nearly tripled in two years, from $6.5 billion to $18.3 billion a quarter.
- Revenue per dollar processed fell in six of the last eight quarters, from 2.85% to 2.17%.
- Gross profit per dollar processed held at 0.72% in Q3 2026, the first quarter without a decline after four straight drops. That is the most constructive single number in the report.
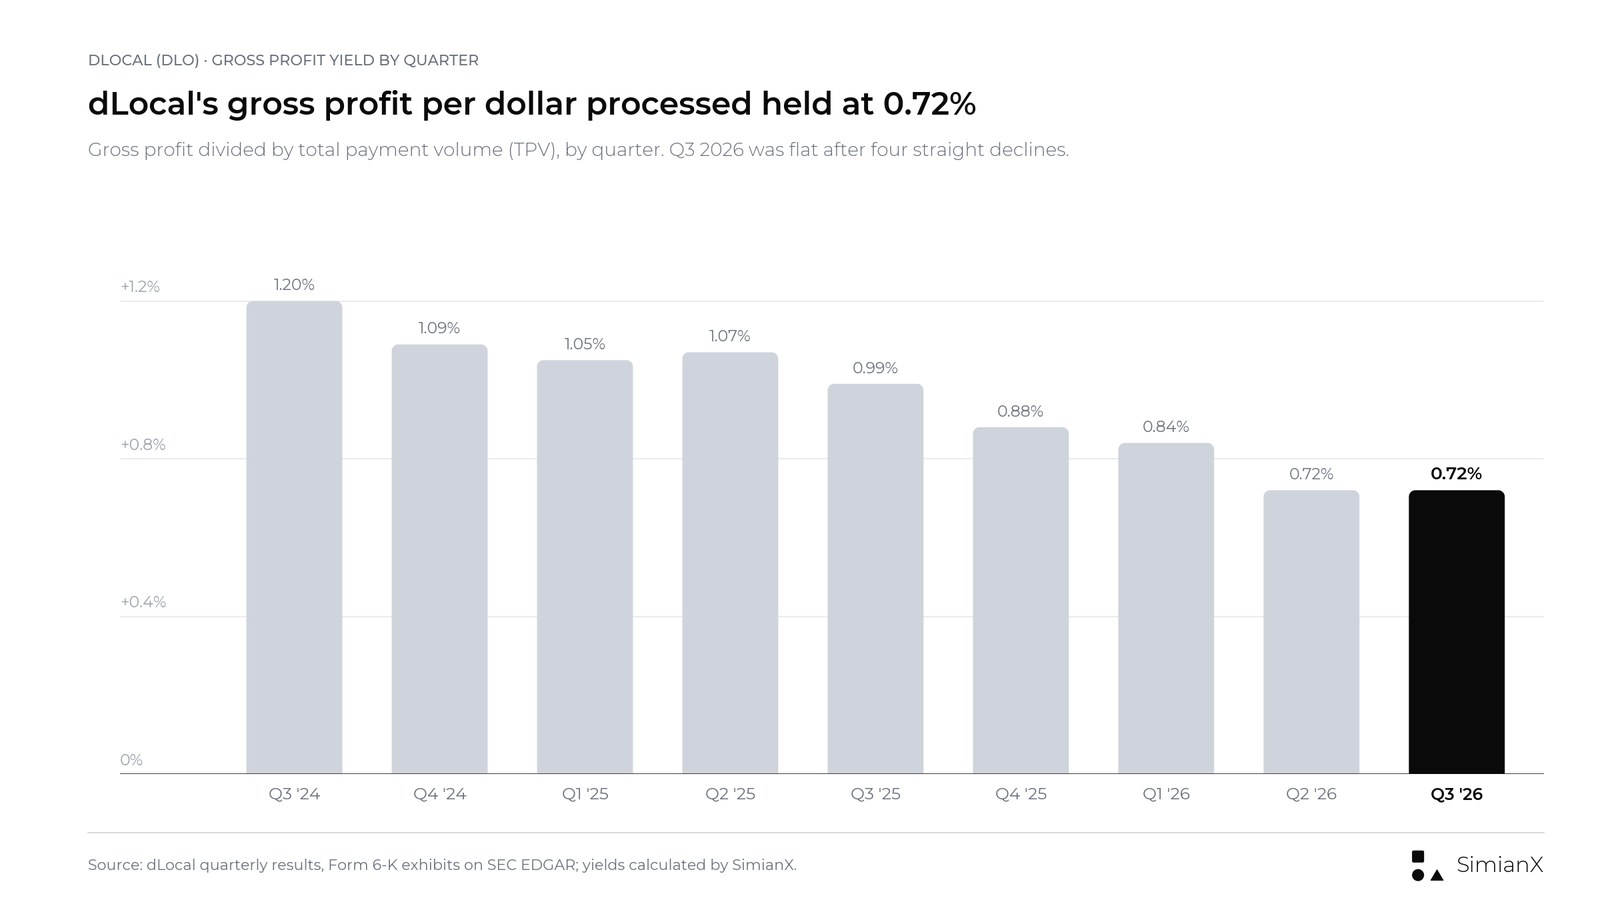
Gross profit yield fell from 1.20% to 0.72% over two years, then stopped falling in Q3 2026.
How DLO Stock Reacted: After-Hours Drop, Flat Close
The timing matters. dLocal released results after the November 12 close and held its call at 6:00 p.m. ET.
| Trading reference | Price | Change versus Nov 12 close |
|---|---|---|
| November 12 regular-session close (before results) | $13.70 | −1.86% versus Nov 11 |
| November 12 after hours, about 7:45 p.m. ET | About $13.30 | −2.9% |
| November 13 open | $13.24 | −3.4% |
| November 13 intraday low | $12.89 | −5.9% |
| November 13 close | $13.69 | −0.07% |
Sources: official daily bars from Polygon.io, cross-checked with Nasdaq.com DLO historical quotes; after-hours level from Polygon.io minute bars.
The November 12 regular-session decline happened before the after-market earnings announcement and should not be attributed to the released results.
The after-hours move and the November 13 open were the initial negative reaction. The full session told a different story: buyers absorbed the drop, and DLO closed one cent below its pre-earnings price on volume of about 4.37 million shares, roughly 2.2 times the previous day's.
The broader market was weaker that day. The SPY S&P 500 ETF fell 0.36% and the QQQ Nasdaq-100 ETF fell 1.20%, so DLO finished slightly ahead of both.
The surrounding market history was already volatile: DLO closed at $13.95 on November 6 and $14.39 on November 9, before slipping to $13.96 on November 11. At $13.69, the stock was 3.2% below its 2025 year-end close of $14.14 and 15.2% below its 52-week intraday high of $16.15, set on September 3, 2026.
The fairer description is therefore not "dLocal stock fell after earnings" but "dLocal stock fell after hours, then recovered to a flat close." The revenue and guidance concerns were real enough to move the opening price, but not enough to hold it down.
DLO Earnings-Day Reactions, 2024 to 2026
dLocal has a history of violent post-earnings moves, which makes a flat close unusual. The table measures each first session after a results release, close to close.
| Report | Reaction session | Prior close | Reaction close | Change |
|---|---|---|---|---|
| Q1 2024 | May 15, 2024 | $13.58 | $10.00 | −26.4% |
| Q2 2024 | Aug 15, 2024 | $7.76 | $8.03 | +3.5% |
| Q3 2024 | Nov 14, 2024 | $9.04 | $10.20 | +12.8% |
| Q4 2024 | Feb 28, 2025 | $13.75 | $9.555 | −30.5% |
| Q1 2025 | May 15, 2025 | $10.19 | $11.24 | +10.3% |
| Q2 2025 | Aug 14, 2025 | $11.69 | $15.35 | +31.3% |
| Q3 2025 | Nov 13, 2025 | $14.86 | $13.85 | −6.8% |
| Q4 2025 | Mar 19, 2026 | $11.45 | $12.53 | +9.4% |
| Q1 2026 | May 15, 2026 | $12.66 | $11.01 | −13.0% |
| Q2 2026 | Aug 14, 2026 | $14.76 | $14.17 | −4.0% |
| Q3 2026 | Nov 13, 2026 | $13.70 | $13.69 | −0.07% |
Source: Polygon.io daily closes, cross-checked with Nasdaq.com. Release dates from dLocal's Form 6-K filings; dLocal releases results after the U.S. close, so each reaction is measured on the next session.
Across the 11 reports, DLO rose five times and fell six times. The average absolute move was 13.5%. November 13, 2026 was the smallest move in the set, and the second earnings day in a row on which the stock reversed its early move: Q2 2026 opened up 3.5% and closed down 4.0%, and Q3 2026 opened down 3.4% and closed flat.
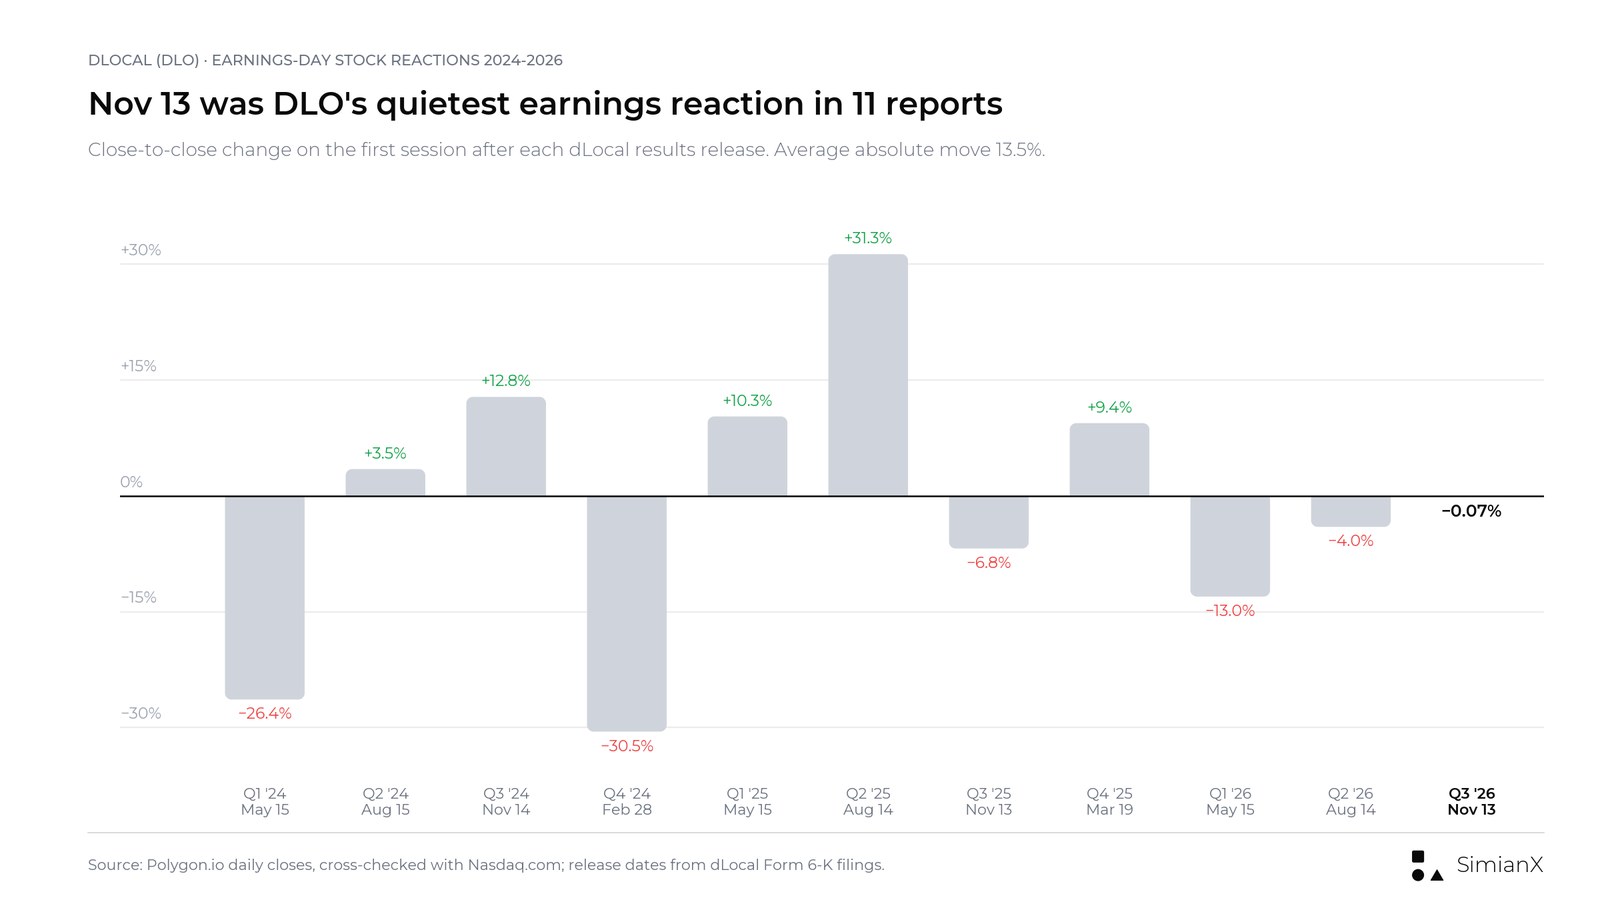
The Q3 2026 reaction was the quietest of the last 11 reports.
The Revenue Miss Matters More Than the Growth Headline Suggests
Investing.com's earnings table listed revenue of approximately $398.05 million against a $406.72 million forecast, and EPS of $0.23 against a $0.22 estimate. Nasdaq.com's Zacks-based earnings-surprise table shows the same $0.22 EPS consensus, a 4.55% beat.
| Metric | Published estimate | Actual | Difference |
|---|---|---|---|
| Revenue | $406.72 million | $398.05 million | −$8.67 million |
| EPS | $0.22 | $0.23 | +$0.01 |
Estimate source: Investing.com as cited at publication; EPS consensus also confirmed on Nasdaq.com. Other data providers publish different revenue estimates and timestamps. The revenue shortfall is our calculation.
The revenue miss was approximately 2.1%:
($398.05 million ÷ $406.72 million − 1) × 100 ≈ −2.1%.
That is not a catastrophic shortfall. Its importance depends on what investors believed about growth durability and monetization before the report.
The EPS beat also deserves proportionate treatment. A favorable bottom-line result does not necessarily answer whether the revenue trajectory is improving.
For a growth-oriented payments business, investors may accept near-term spending if it creates a stronger future revenue base. Conversely, better expense control may not fully offset disappointment about that future base.
The relevant comparison is therefore not simply "growth versus no growth." It is delivered growth versus the growth and economics already expected.
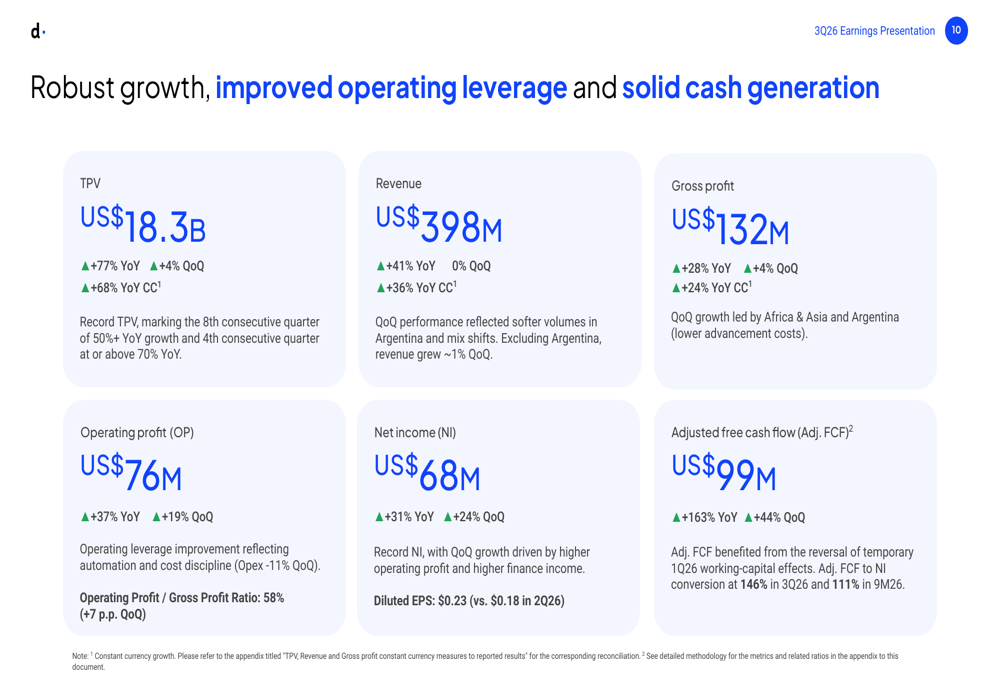
dLocal's own Q3 2026 summary slide: TPV $18.3 billion, revenue $398 million, gross profit $132 million, operating profit $76 million, net income $68 million and adjusted free cash flow $99 million.
How dLocal Makes Money, and Why TPV Is Not Revenue
dLocal lets global merchants accept payments and send payouts in emerging markets through one API. Total payment volume measures the value of payments processed. It is not the amount dLocal earns.
A useful analytical framework is:
Revenue = TPV × aggregate revenue yield.
The yield is calculated as revenue divided by TPV. It is a blended accounting ratio, not necessarily a contractual merchant fee.
It can change because of:
- Payment methods.
- Product and transaction mix.
- Country mix.
- Cross-border versus domestic flows.
- Merchant scale and commercial terms.
- Foreign-exchange-related economics.
The same distinction applies to gross profit:
Gross profit = TPV × gross profit yield.
Gross profit yield incorporates the relationship between revenue and the costs of delivering payment services. It is therefore a useful complement to revenue yield.
Neither ratio should be interpreted in isolation. A lower yield can be acceptable if the additional business produces attractive incremental profit, strong retention and limited additional operating expense.
The concern arises when volume growth remains impressive but its economic contribution becomes less predictable.
The Take-Rate Bridge: More Volume, Less Revenue per Dollar
Using dLocal's reported figures, our calculations show a material year-over-year change in aggregate yields.
| Calculated measure | Q3 2025 | Q2 2026 | Q3 2026 |
|---|---|---|---|
| Revenue divided by TPV | 2.72% | 2.26% | 2.17% |
| Gross profit divided by TPV | 0.99% | 0.72% | 0.72% |
Calculations use reported TPV, revenue and gross profit. These are aggregate yields, not quoted merchant prices.
The decline explains why the growth rates differ so sharply.
A larger payment base generated more revenue and profit in absolute dollars, but less of each per dollar processed. The same squeeze between volume and transaction margin has shaped PayPal's earnings by quarter, even though the two businesses serve very different markets.
Importantly, this is not enough to conclude that dLocal cut every customer's price. Changes in the composition of transactions can produce the same aggregate effect.
Management identified a higher share of local-to-local and pay-out volumes, along with softer volumes in Argentina after the seasonal Hot Sale peak in the second quarter, as influences on quarterly revenue. Excluding Argentina, revenue grew about 1% sequentially.
On gross profit, the release listed lower advancement costs in Argentina, volume growth in Africa and Asia, a one-off cost recovery in Nigeria and foreign-exchange hedge gains as positives. The offsets were a shift in Brazil's payment-method mix toward Pix and Boleto, higher processing costs in Mexico including catch-ups from prior periods, and more local-to-local flows in other Latin American markets.
The investment question is whether those lower-yield flows deepen commercially valuable relationships or simply require more processing activity to sustain a given rate of profit growth.
A constructive answer would combine rising merchant activity with attractive contribution and scalable operating costs.
A less favorable answer would involve persistent yield compression that outpaces the company's ability to grow volume efficiently.
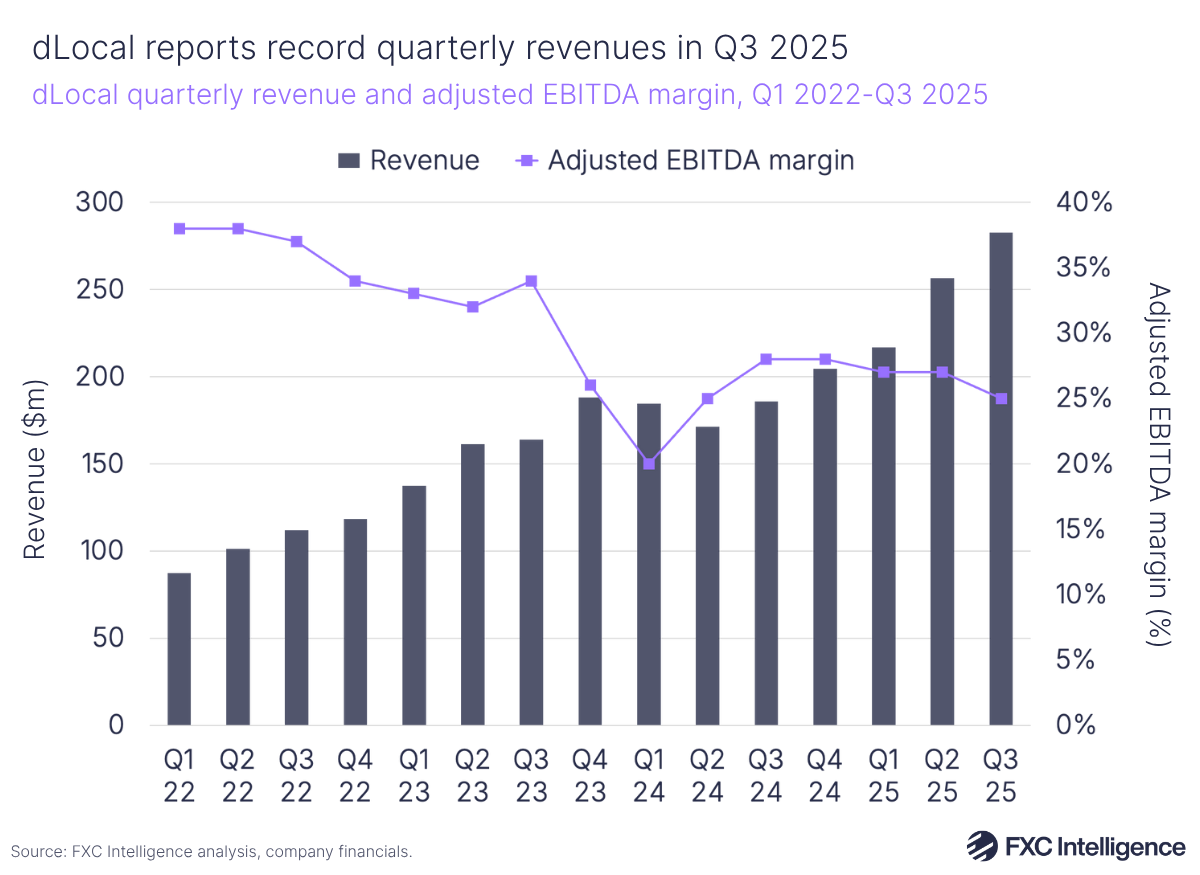
A third-party chart (FXC Intelligence) of dLocal's quarterly revenue and adjusted EBITDA margin through Q3 2025, before the company moved its guidance to operating profit in 2026.
The Sequential Comparison Was Less Impressive Than the Annual One
Year-over-year growth and quarter-over-quarter momentum answer different questions.
The Q2 release reported revenue of $399.7 million, gross profit of $127.2 million and operating profit of $64.2 million.
Compared with those figures, Q3 revenue was slightly lower, while gross profit and operating profit increased.
Calculated from the financial statements, revenue declined approximately 0.4% sequentially. TPV, by contrast, still grew 4% from the second quarter.
That does not establish that underlying demand contracted. Seasonality and transaction mix can influence the comparison.
It does establish that the company's annual growth headline was not accompanied by sequential revenue acceleration.
For investors, that distinction changes the follow-up questions:
- Was the comparison mainly seasonal?
- Did lower-yield products account for more activity?
- Are merchant relationships expanding economically as well as operationally?
- Does the next quarter provide evidence of renewed revenue momentum?
A convincing answer requires more than one aggregate growth rate.
Gross Margin Weakened Annually but Improved Sequentially
The margin story is more balanced than a simple "compression" headline suggests.
Using the underlying income-statement figures, calculated gross margin was approximately:
| Period | Gross profit divided by revenue |
|---|---|
| Q3 2025 | 36.5% |
| Q2 2026 | 31.8% |
| Q3 2026 | 33.2% |
Sources: dLocal's Q2 release and Q3 interim financial statements; percentages are our calculations.
The company earned less gross profit per revenue dollar than a year earlier, but more than in the preceding quarter.
Both observations matter.
The annual comparison raises questions about the economics of the business mix. The sequential improvement provides evidence against an uninterrupted deterioration.
It would therefore be inaccurate to describe every margin measure as worsening.
Investors should instead examine whether the sequential improvement can persist when payment-method mix, processing costs and geographic conditions change. Part of the Q3 help, the Nigeria cost recovery, was described by the company as one-off.
A useful discipline is to separate three measures:
- Gross margin: gross profit divided by revenue.
- Gross profit yield: gross profit divided by TPV.
- Operating conversion: operating profit divided by gross profit.
These ratios measure different parts of the economic chain.
The Strongest Bullish Evidence Was Operating Leverage
The operating-profit improvement deserves attention.
Using the Q2 and Q3 income statements, the sequential bridge is approximately:
| Bridge from Q2 to Q3 2026 | Contribution |
|---|---|
| Additional gross profit | +$4.9 million |
| Lower operating expenses ($63.0 million to $55.9 million) | +$7.1 million |
| Additional operating profit | +$12.0 million |
Our calculation: operating expenses equal gross profit minus operating profit. Small differences reflect rounding.
Approximately 60% of the sequential operating-profit improvement came from lower expenses rather than additional gross profit.
This is a meaningful distinction, not a criticism of expense discipline.
For a scalable platform, converting a larger share of gross profit into operating profit can be an important source of shareholder value. The company attributed the 11% sequential drop in operating expenses to lower third-party spend, lower headcount and automation.
However, expense improvements can have different degrees of durability. Automation and structurally better processes differ from spending that moves between quarters.
On the earnings call, CFO Guillermo López Pérez separated structural savings from timing: marketing spend had been concentrated in the first half and one-off expenses were lower than usual. He said he would not treat the quarter's result as a margin target and would be careful about extrapolating from a single quarter.
The strongest bullish interpretation is that dLocal's infrastructure can support growth without equivalent increases in overhead.
The more cautious interpretation is that some of the quarterly improvement may not repeat.
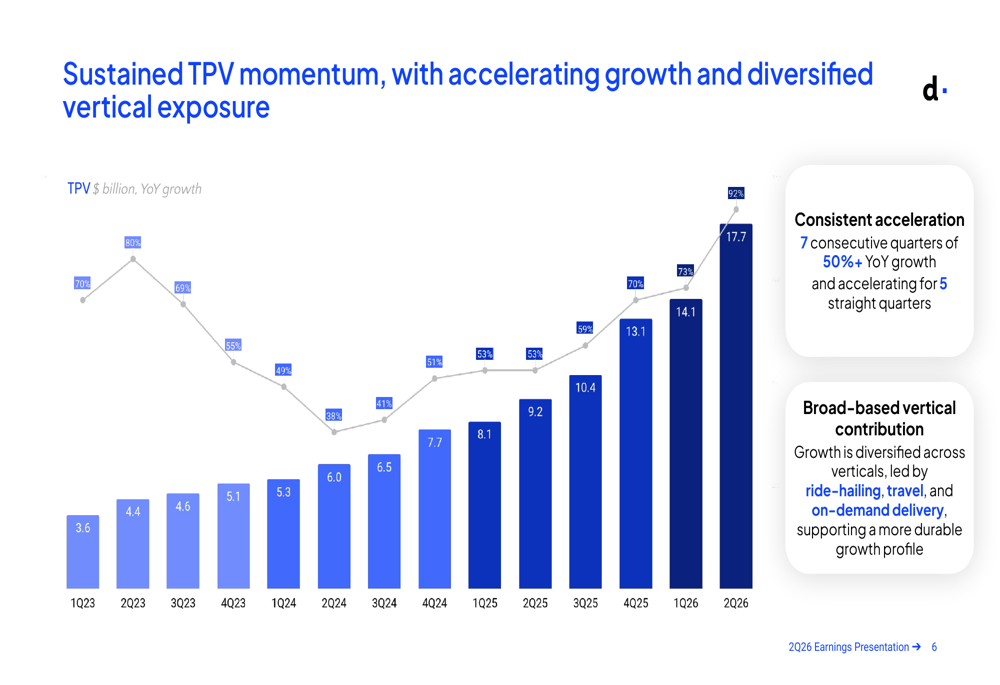
dLocal's Q2 2026 presentation slide: TPV by quarter through Q2 2026, when year-over-year growth peaked at 92%.
Unchanged Guidance Still Contained a More Cautious Message
Maintaining a guidance range does not mean maintaining the same expectation within that range.
The 2026 outlook has moved twice this year:
| 2026 measure | Initial guidance (Mar 18) | Updated guidance (Aug 13) | Position stated Nov 12 |
|---|---|---|---|
| TPV growth | 50%–60% | 60%–70% | Toward the upper end |
| Gross profit growth | 22.5%–27.5% | 25%–30% | Around the midpoint |
| Operating profit growth | 27.5%–32.5% | 27.5%–32.5% (held) | Toward the lower end |
Sources: dLocal's Q4 2025, Q2 2026 and Q3 2026 earnings releases and the November 12 earnings call. In the Q3 release's own table, operating profit excluding the Q1 prior-year tax adjustment sits at the midpoint; the guidance itself uses reported figures.
That pattern reinforces the central tension: strong volume growth does not translate proportionately into profit expectations.
The company named the reasons: previously unanticipated foreign-exchange headwinds in Brazil, Mexico and Argentina, and softer performance in smaller, high-take-rate markets in Africa and Asia. On the call, CEO Pedro Arnt estimated the FX headwinds at about six percentage points of swing in Q4 year-over-year gross-profit growth. This was a quarterly sensitivity, not a six-point reduction to full-year guidance. He also reminded listeners that fourth-quarter results depend on the peak shopping season and could move in either direction.
What the stated positions imply for the fourth quarter (our calculation from 2025 bases and nine-month 2026 results):
| Q4 2026 implied by guidance position | Implied Q4 value | Versus Q4 2025 |
|---|---|---|
| TPV at 65%–70% full-year growth | $17.3–$19.3 billion | +32% to +47% |
| Gross profit at the 27.5% midpoint | About $135.7 million | About +17% |
| Operating profit at the 27.5% lower end | About $87.3 million | About +39% |
2025 bases: TPV $40.8 billion, gross profit $402.8 million, operating profit $219.9 million. Nine-month 2026: TPV $50.1 billion, gross profit $377.8 million, operating profit $193.1 million.
For valuation, the likely position within a range can matter as much as the formal range itself.
Investors may lower their internal forecasts without the company issuing a headline guidance cut.
The correct interpretation is therefore unchanged ranges with a more cautious profit trajectory, not an outright withdrawal of the outlook.
Strong Cash Generation Requires a Definition Check
Cash flow is a positive part of the report, but the terminology matters.
dLocal defines adjusted free cash flow by starting with operating cash flow, adjusting for merchant working-capital movements and subtracting capital expenditure. It is a non-IFRS measure, not simply operating cash flow minus capex. For a plain-language background on the standard measure, see Investopedia's free cash flow explainer.
For Q3, the reconciliation was:
| Cash-flow component | Amount |
|---|---|
| Operating cash flow | $179.234 million |
| Merchant working-capital adjustment | −$71.116 million |
| Capital expenditure | −$9.068 million |
| Company-defined adjusted free cash flow | $99.050 million |
Source: company reconciliation in the Q3 2026 earnings release.
The arithmetic reconciles:
$179.234 million − $71.116 million − $9.068 million = $99.050 million.
Over nine months, adjusted free cash flow was $182.3 million, or 111% of net income, after the reversal of temporary working-capital effects that had held Q1 2026 down to $14.7 million.
The adjustment is important because payment settlement activity can affect cash movements.
Investors should also separate cash generation from financing. On August 12, dLocal signed a $150 million senior unsecured credit facility that matures on August 14, 2029, carries interest at Term SOFR plus 2.00% and is repayable in 11 quarterly installments of $13.6 million. Corporate cash rose $167.8 million in the quarter to $536.9 million, and the company explained that increase by the loan.
Borrowing proceeds improve liquidity but are not operating cash flow. The cash-flow statement also shows $34.0 million of share repurchases in Q3; under its $300 million program authorized in March 2026, dLocal had bought back about 9.1 million Class A shares for $120.1 million by the end of September.
The analytical objective is not to reject the adjusted measure. It is to understand what it removes, compare it with IFRS cash flow and avoid treating every increase in cash as internally generated earnings.
Why Merchant Expansion Does Not Automatically Protect Margins
dLocal's disclosures demonstrate how existing merchants drive its expansion.
The Q1 2026 report recorded net revenue retention of 152%. In the Q3 release, the CEO put net revenue retention at 140%, and on the call he cited TPV retention of 173%. Both figures say existing merchants are sending far more volume, but the gap between them is the yield story again: existing customers grew their payment volume faster than the revenue dLocal earns from them.
That is strategically relevant: winning more activity from an established merchant can reduce the need to rebuild the commercial relationship from scratch.
However, retention and monetization answer different questions.
A merchant can send more activity through a platform while the incremental activity has a different geographic or product mix.
A rising relationship value in absolute dollars can coexist with lower blended yields.
Investors should consequently examine merchant expansion alongside gross profit generation, not use retention as a substitute for it.
The durable competitive advantage would be the ability to win more business while maintaining attractive incremental returns and reliable payment performance.
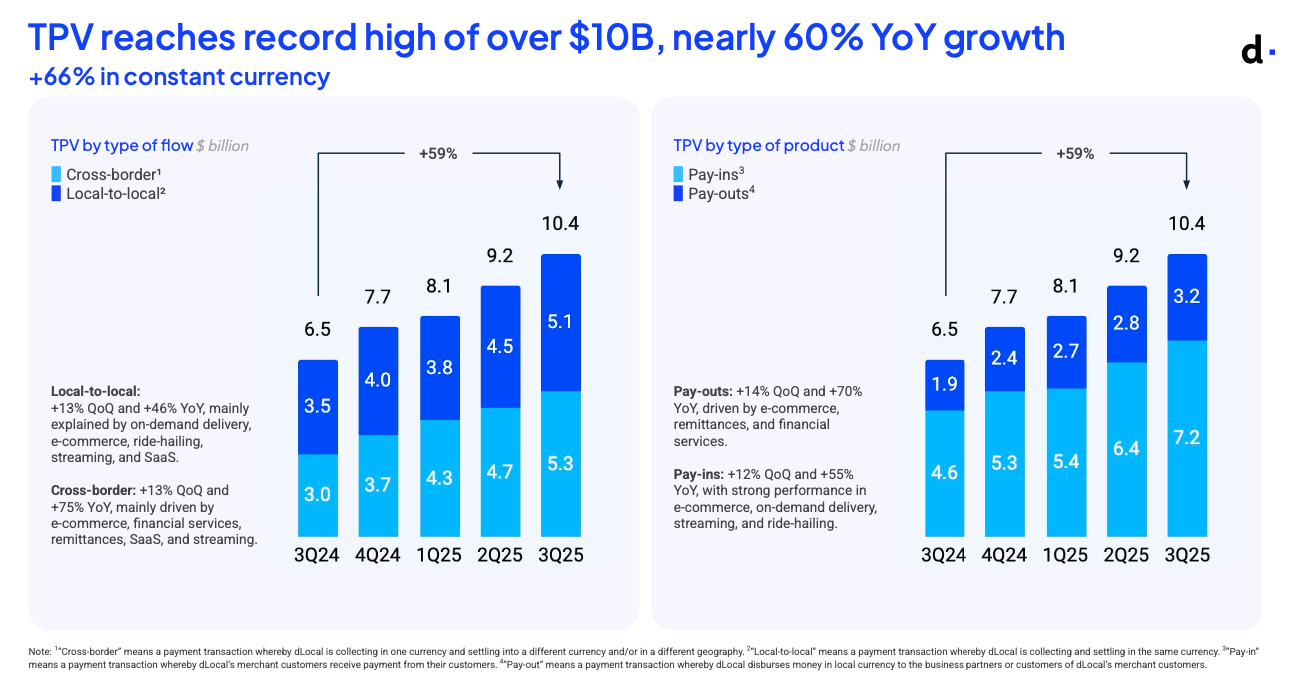
dLocal's Q3 2025 TPV split by flow (cross-border versus local-to-local) and by product (pay-ins versus pay-outs), the mix that drives the blended yield.
What Would Change the Investment Interpretation?
The bearish case would weaken if subsequent results showed:
- Revenue becoming more responsive to payment-volume growth.
- Stabilizing yields after accounting for mix, building on the flat 0.72% gross-profit yield of Q3.
- Gross-profit growth supported by repeatable operating drivers.
- Efficiency gains persisting without underinvestment.
- Cash conversion remaining healthy after timing effects normalize.
The bullish case would weaken if:
- Additional volume produced progressively less economic contribution.
- Profit growth depended increasingly on temporary spending restraint.
- Forecasts continued shifting toward weaker outcomes.
- Cash improvement relied heavily on financing or settlement timing.
Neither case should be decided by one headline percentage.
A useful operating sequence is:
Payment volume → revenue → gross profit → operating profit → sustainable cash generation.
Each step tests whether growth is creating value rather than merely increasing activity.
Frequently Asked Questions
When did dLocal report Q3 2026 earnings?
dLocal released third-quarter 2026 results after the U.S. market closed on November 12, 2026, and held its earnings call at 6:00 p.m. ET the same evening.
Why did dLocal stock fall after earnings?
DLO fell about 3% after hours and opened 3.4% lower on November 13. Revenue missed the benchmark published by Investing.com, revenue was flat against the second quarter, and management's profit outlook became more cautious within unchanged ranges. By the close, however, the stock had recovered to $13.69, down only 0.07%.
Did dLocal beat earnings expectations?
Diluted EPS of $0.23 beat the $0.22 consensus shown by Investing.com and Nasdaq.com. That bottom-line beat coexisted with a revenue miss of about 2.1%, so the report was mixed rather than uniformly stronger than expected.
Is dLocal's take rate declining?
Calculated revenue divided by TPV fell from 2.72% to 2.17% year over year. Gross profit divided by TPV fell from 0.99% to 0.72% but was flat against the second quarter. These blended yields should not be read as evidence that every merchant's contractual price declined.
Did every margin measure deteriorate?
No. Gross margin improved sequentially, from 31.8% to 33.2%, even though it remained below the prior-year level. Operating profit rose to 58% of gross profit as operating expenses fell 11%.
Did dLocal cut its 2026 guidance?
No. dLocal kept the ranges it set in August but indicated operating-profit growth toward the lower end of 27.5%–32.5%, gross profit around the midpoint and TPV toward the upper end. That is a more cautious outlook without a formal reduction to the range.
Is adjusted free cash flow the same as ordinary free cash flow?
No. dLocal additionally adjusts for merchant working-capital movements. Investors should read the reconciliation rather than assume the metric equals operating cash flow minus capital expenditure.
When is dLocal's next earnings date?
dLocal has not announced a date for its fourth-quarter 2026 results. It reported Q4 2025 on March 18, 2026, so the next report would be expected around mid-to-late March 2027.
Verdict: The Market Wanted Better Monetization, Not Just More Payments
The results did not show a broken business. They showed why rapid growth alone is insufficient to settle a valuation debate.
The bearish evidence concerns expectations, payment yields and the near-term outlook. The bullish evidence concerns profitability, expense discipline, cash generation and a gross-profit yield that finally stopped falling.
Those observations can all be true simultaneously, which is roughly what the November 13 tape said: a lower open, then a flat close.
The next test is whether dLocal can combine strong merchant activity with a more predictable relationship between volume and economic output.
Until then, the most useful question is not, "How fast are payments growing?"
It is:
How much durable profit and cash does each additional wave of payments create?
Notes on Method
- Revenue precision: The financial statements report $398.049 million. The company's headline rounds this to $398.0 million; some market-data pages display $398.05 million.
- Calculated revenue yield: Revenue ÷ TPV × 100. Q3 2026: $398.049 million ÷ $18,345 million ≈ 2.17%. Q3 2025: $282.483 million ÷ $10,390 million ≈ 2.72%.
- Calculated gross-profit yield: Gross profit ÷ TPV × 100. Q3 2026: $132.013 million ÷ $18,345 million ≈ 0.72%. Q3 2025: $103.189 million ÷ $10,390 million ≈ 0.99%.
- Sequential bridge: Additional gross profit was approximately $4.863 million. Lower operating expenses contributed approximately $7.1 million. Together, these explain approximately $12.0 million of additional operating profit.
- Earnings-day reactions: Close of the last session before each after-market release compared with the close of the next session. No peer adjustment is applied.
- Causality: Explanations of the stock reaction are analytical interpretations consistent with the disclosures, not proof of individual investors' motives.
This article provides research and analytical interpretation, not personalized investment advice or a buy-or-sell recommendation.
Related Reading
- PayPal Stock After Q3 2026: Earnings by Quarter, 13% Crash
- Stablecoins 2026: Visa, Stripe & the USDT vs USDC Race
- Coinbase Stock 2026: Revenue by Quarter and COIN vs Bitcoin
- Robinhood Stock 2026: Revenue by Quarter, Crypto Just 8%
- Stratasys Earnings by Quarter: Q3 2026 Results and SSYS
- Airbnb Earnings by Quarter: Q3 2026 Results and ABNB Stock
- Tetra Tech Earnings by Quarter: Q4 FY2026 Results and TTEK
References
- dLocal: Q3 2026 earnings release, November 12, 2026 (Form 6-K, Exhibit 99.1)
- dLocal: Unaudited interim financial statements for September 30, 2026 (Form 6-K, Exhibit 99.2)
- dLocal: November 12, 2026 Form 6-K cover and exhibit index
- dLocal: Q2 2026 earnings release, August 13, 2026
- dLocal: Q1 2026 earnings release, May 14, 2026
- dLocal: Q1 2026 earnings report with net revenue retention
- dLocal: Q4 2025 earnings release and 2026 guidance, March 18, 2026
- dLocal: Q3 2025 earnings release, November 12, 2025
- SEC EDGAR: dLocal Form 6-K filings
- Stock Analysis: dLocal Q3 2026 earnings-call transcript
- Investing.com: dLocal earnings history and estimates
- Investing.com: Report on dLocal's revenue miss and after-hours decline, November 12, 2026
- Nasdaq.com: DLO historical quotes
- Nasdaq.com: DLO earnings surprise history
- Polygon.io: U.S. stock market data
- dLocal: Company website
- Banco Central do Brasil: Pix
- Federal Reserve Bank of New York: Secured Overnight Financing Rate (SOFR)
- IFRS Foundation: IAS 34 Interim Financial Reporting
- Investopedia: Free cash flow