
 By Muke
Stratasys Q3 2026: Growth Returned, but the Full-Year Outlook Came Down
Yes, Stratasys returned to growth in the third quarter of 2026. Revenue rose 4.1% to $142.6 million, the first quarter of meaningful year-over-year growth since at least 2023. But the same release cut the 2026 revenue outlook to $556 million to $561 million from $565 million to $575 million, and a day earlier the company and Nano Dimension had called off the planned Markforged acquisition. SSYS closed down 11.2% on the day.
This page is a by-quarter reference for Stratasys (Nasdaq: SSYS): nine quarters of results, the systems-versus-consumables mix, the 2026 guidance path, cash flow and every earnings-day stock reaction since late 2024. Every reported figure comes from the company's SEC filings; where a number is our own calculation, we say so.
Updated November 12, 2026, after the 4:00 p.m. ET close. Stratasys released Q3 2026 results before the U.S. market opened on November 12 and held its call at 8:30 a.m. ET. Share prices for November 12 are official closing prices.
Stratasys Q3 2026 Results at a Glance
| Measure | Q3 2026 | Q3 2025 | Change |
|---|---|---|---|
| Revenue | $142.6M | $137.0M | +4.1% |
| Systems revenue | $35.9M | $32.0M | +12.1% |
| Consumables revenue | $61.2M | $62.0M | −1.3% |
| Services revenue | $45.5M | $42.9M | +6.1% |
| GAAP gross margin | 43.7% | 41.0% | +2.7 pts |
| Non-GAAP gross margin | 47.8% | 45.3% | +2.5 pts |
| GAAP net loss | −$10.2M (−$0.12/share) | −$55.6M (−$0.65/share) | Loss narrowed |
| Non-GAAP net income | $3.5M ($0.04/share) | $1.5M ($0.02/share) | +$2.0M |
| Adjusted EBITDA | $8.0M | $5.0M | +$3.0M |
| Operating cash flow | $3.5M | $6.9M | −$3.4M |
| Cash, equivalents and short-term deposits | $210.7M | $255.0M | No debt |
Sources: Stratasys Q3 2026 results release and Q3 2026 financial statements, both filed on Form 6-K. Segment dollar figures are summed from the company's regional revenue table.
Three things stand out:
- Growth came from printers, not materials. Before the report, the bull case leaned on record consumables. In Q3 the order flipped: systems rose 12.1% while consumables slipped 1.3%.
- The guidance cut is all in the fourth quarter. With nine-month revenue now known, the new range implies Q4 revenue of about $143 million to $148 million, against roughly $152 million to $162 million under the old range.
- The GAAP comparison flatters. Q3 2025 carried a $33.9 million non-cash impairment of the Ultimaker investment. Without it, last year's loss would have been about $21.7 million, so the underlying improvement is closer to $11.5 million than $45 million.
Revenue by Quarter: Nine Quarters of Stratasys Earnings
| Quarter | Revenue | YoY | GAAP net loss | GAAP EPS | Non-GAAP EPS | Adj. EBITDA | Operating cash flow |
|---|---|---|---|---|---|---|---|
| Q3 2024 | $140.0M | −13.7% | −$26.6M | −$0.37 | $0.01 | $5.1M | −$4.5M |
| Q4 2024 | $150.4M | −3.8% | −$41.9M | −$0.59 | $0.12 | $14.5M | $7.4M |
| Q1 2025 | $136.0M | −5.6% | −$13.1M | −$0.18 | $0.04 | $8.2M | $4.5M |
| Q2 2025 | $138.1M | +0.0% | −$16.7M | −$0.20 | $0.03 | $6.1M | −$1.1M |
| Q3 2025 | $137.0M | −2.2% | −$55.6M | −$0.65 | $0.02 | $5.0M | $6.9M |
| Q4 2025 | $140.0M | −6.9% | −$18.9M | −$0.22 | $0.07 | $9.2M | $4.8M |
| Q1 2026 | $132.7M | −2.5% | −$23.8M | −$0.28 | −$0.01 | $2.0M | $2.4M |
| Q2 2026 | $137.6M | −0.3% | −$16.9M | −$0.19 | $0.03 | $5.3M | −$18.7M |
| Q3 2026 | $142.6M | +4.1% | −$10.2M | −$0.12 | $0.04 | $8.0M | $3.5M |
Sources: Stratasys results releases for Q3 2024, Q4 2025 (which also gives the Q4 2024 comparison), Q1 2025, Q2 2025, Q3 2025, Q1 2026, Q2 2026 and Q3 2026. Year-over-year growth is our calculation from reported revenue in thousands; Q2 2025 was +0.03%.
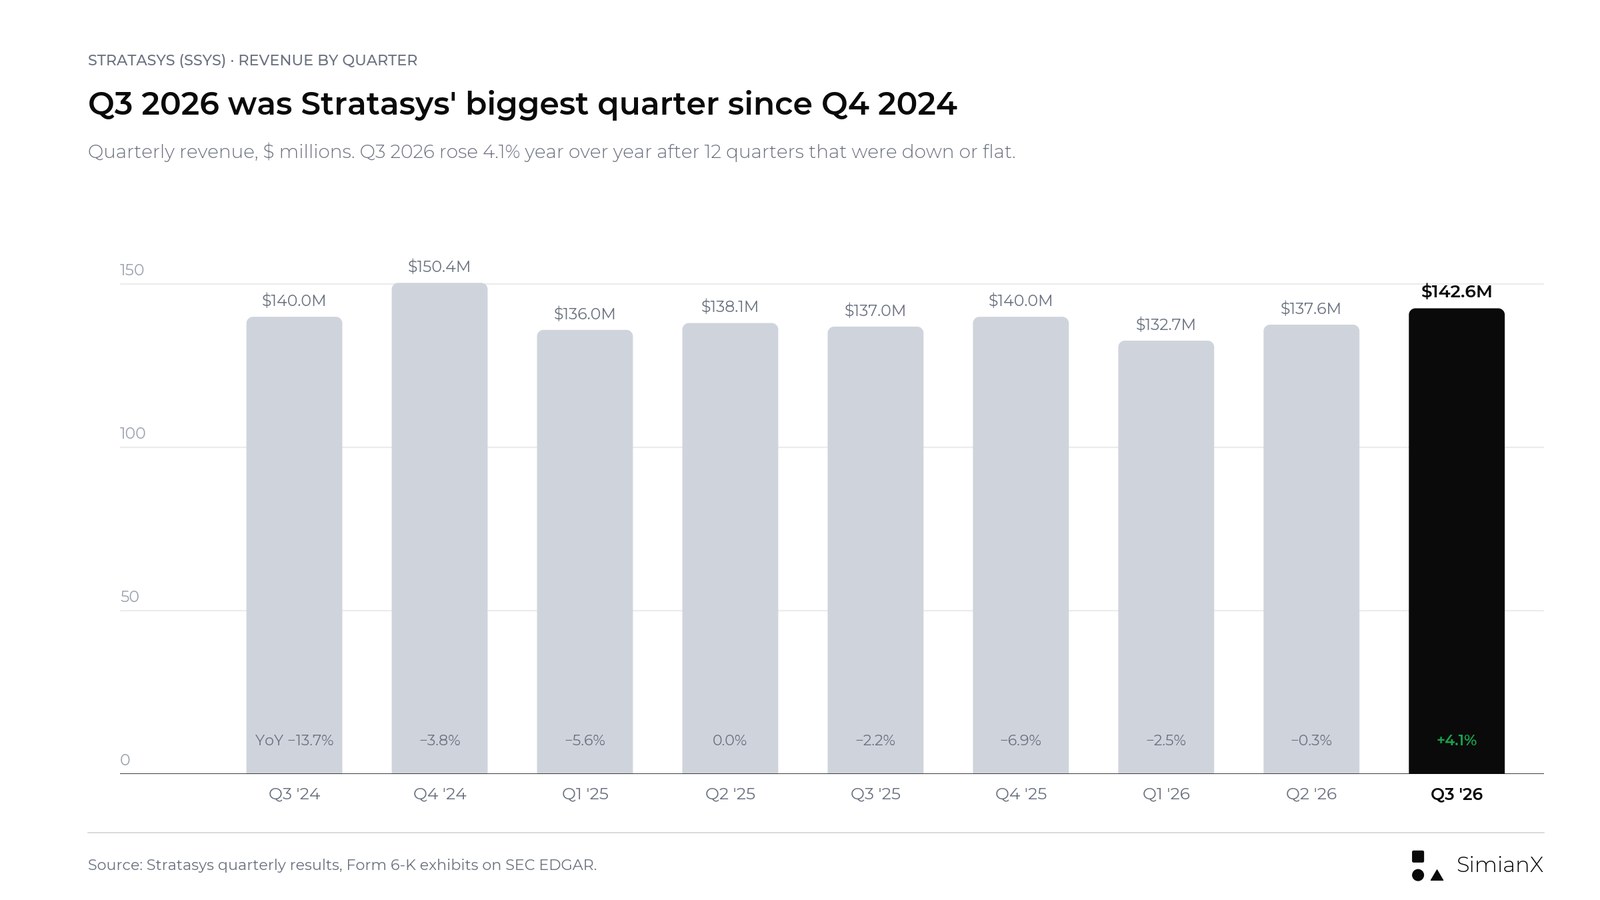
Q3 2026 was the company's highest revenue quarter since Q4 2024. It also broke a long run: from Q3 2023 through Q2 2026, every quarter was down or flat on the year before (Q3 2023 was −0.04%, Q2 2025 was +0.03%). Reported revenue for the first nine months of 2026 was $412.9 million, up just 0.4% from $411.1 million a year earlier.
Two caveats keep this from being a clean turnaround signal. First, the comparison base is low: Q3 2025 revenue of $137.0 million was itself down from $140.0 million in 2024 and $162.1 million in 2023. Second, one strong systems quarter can reflect the timing of a few large orders, which management itself flagged when it lowered the outlook.
Systems vs. Consumables: The Mix Flipped in Q3
Before this report, the most useful operating detail was the gap between new-printer demand and materials sold into the installed base. In Q2 2026, systems revenue fell 13.7% because of longer sales cycles, while consumables hit a record $66.3 million, helped by higher customer utilization and recent acquisitions (Q2 2026 operating review). Using the company's rounded figures, Q2 revenue moved roughly like this: systems −$4.2 million, consumables +$2.1 million, services +$1.6 million, total −$0.5 million.
Q3 reversed that pattern.
| Quarter | Systems | Consumables | Services | Total |
|---|---|---|---|---|
| Q1 2025 | $31.2M | $62.6M | $42.3M | $136.0M |
| Q2 2025 | $30.6M | $64.2M | $43.3M | $138.1M |
| Q3 2025 | $32.0M | $62.0M | $42.9M | $137.0M |
| Q4 2025 | $37.8M | $59.8M | $42.4M | $140.0M |
| Q1 2026 | $28.8M | $60.0M | $43.9M | $132.7M |
| Q2 2026 | $26.4M | $66.3M | $44.9M | $137.6M |
| Q3 2026 | $35.9M | $61.2M | $45.5M | $142.6M |
Sources: revenue disaggregation notes in the 6-K financial statements for Q2 2026 and Q3 2026, plus the 2025 Form 20-F. Q1 and Q4 figures are our calculation (six- or twelve-month totals minus the other quarters).
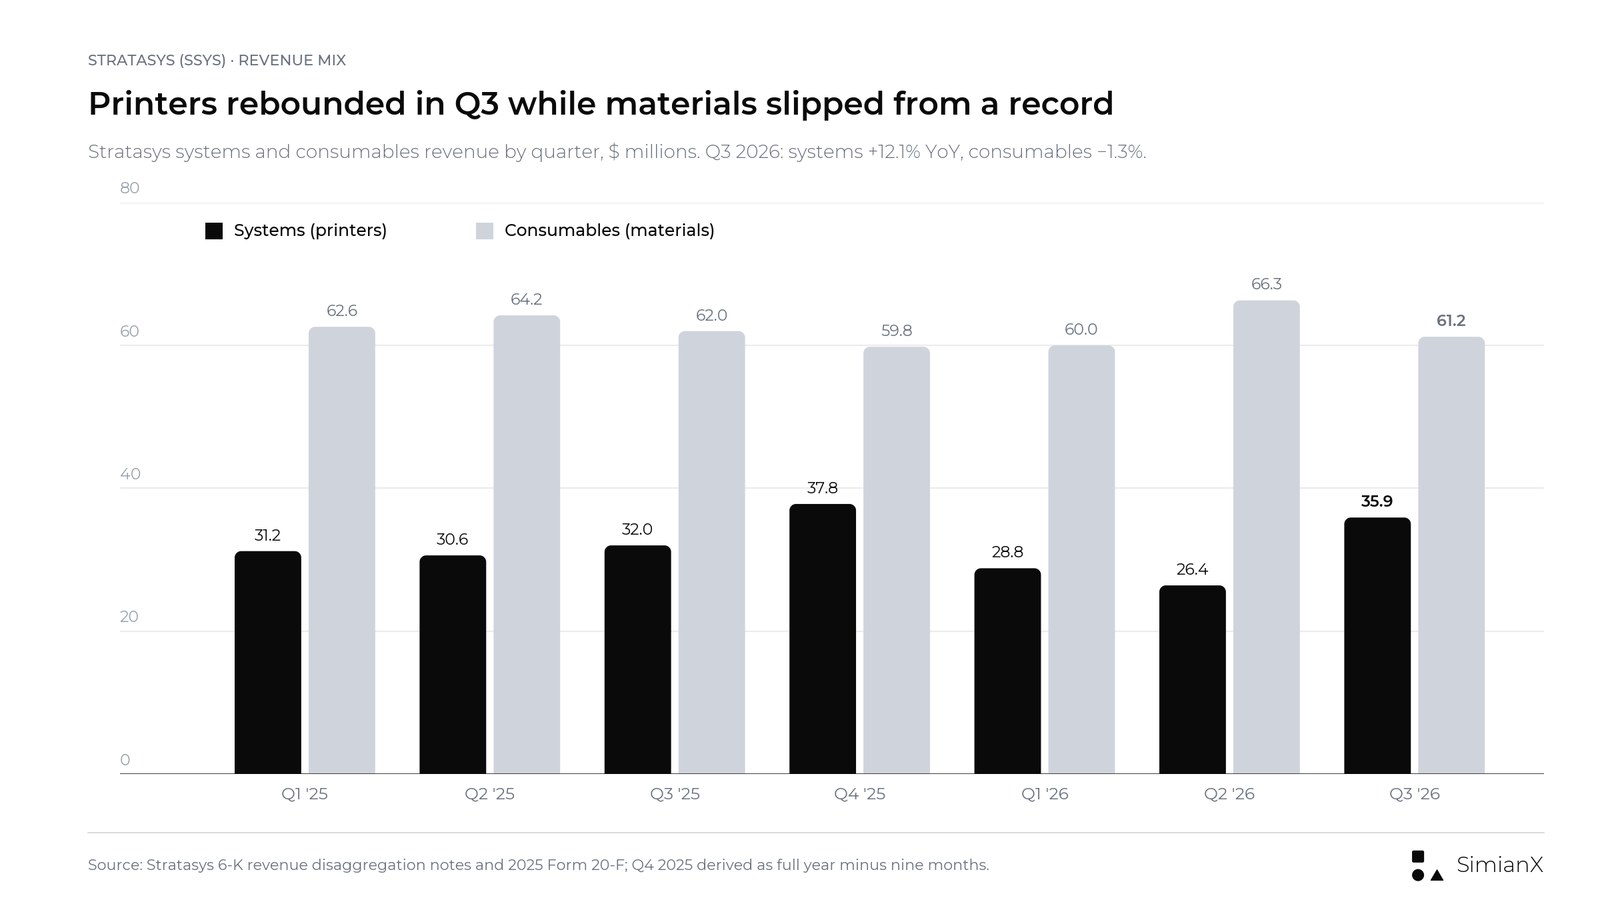
What changed in Q3, according to the Q3 2026 operating review:
- Systems rose $3.9 million (+12.1%) year over year and about 36% from Q2, our calculation. Nearly all of the gain was in the Americas, where systems revenue jumped to $25.8 million from $18.1 million. EMEA systems fell to $5.7 million from $9.6 million, which the company tied to longer sales cycles.
- Consumables fell $0.8 million (−1.3%) year over year and about 8% from the Q2 record. The company called the decline "slightly lower" and did not give a separate reason; nine-month consumables were down 0.7%, with acquisitions partly offsetting weaker demand.
- Services rose $2.6 million (+6.1%), mainly from Stratasys Direct Manufacturing, plus a 4.3% rise in customer-support revenue.
By region, the Americas grew 12.6% to $94.1 million, while EMEA fell 12.6% to $31.9 million and Asia Pacific slipped 1.5% to $16.6 million. U.S. revenue alone was $90.6 million, up from $80.2 million.
The takeaway cuts both ways. Printer demand finally showed up, which is what the growth case needed. But materials are the recurring part of the model, and a quarter in which they shrink while printers grow is not yet evidence that utilization is broadening.
Aerospace, Defense and Automotive: Where the Growth Came From
Management put most of the quarter's growth on one vertical. Aerospace and defense, the company's largest business, grew more than 35% year over year and about 25% from Q2, after 17% growth in Q2. The Q3 2026 slides cite two significant defense orders, follow-on orders for flight-grade parts, and demand tied to drones, space, munitions and eVTOL programs. Stratasys Direct, the parts-on-demand service, grew 9%, driven by aerospace and defense, and the slides say its backlog is higher than ever.
Automotive also grew. The slides say GM runs dozens of Stratasys industrial printers across multiple plants and reports about $10 million in annual savings from localized additive production, and that Chinese automaker FAW Group is expanding to 25 Stratasys printers in 2026. In Q2, the company had said FAW would buy twelve F900 systems by year-end, two of them shipped in that quarter (Q2 2026 slides). The new F870 FDM system names Toyota and Rivian among its first adopters. Dental gained a regulatory approval for TrueDent dentures in India.
Orders and adoption stories are not revenue, so it helps to keep the stages apart:
| Commercial stage | What it shows | What it does not prove |
|---|---|---|
| Customer engagement | Interest in a solution | A committed purchase |
| Agreement or order | A firmer commitment | Revenue in a given quarter |
| Shipment and acceptance | Revenue being recognized | Good lifetime economics |
| Repeat materials purchases | Continued use on the floor | Guaranteed future growth |
| Cash collection | The customer has paid | Lasting profitability |
An analytical framework, not a company accounting policy.
The defense orders explain the Q3 systems jump. They also explain the guidance cut: the same slides warn that "high requirement programs result in larger orders with extended sales cycle and more time variability."
2026 Guidance: What Changed on November 12
Stratasys kept its revenue range through three reports, then cut it in the fourth.
| 2026 outlook item | Mar 5 (initial) | May 7 | Aug 13 | Nov 12 (updated) |
|---|---|---|---|---|
| Revenue | $565M–$575M | $565M–$575M | $565M–$575M | $556M–$561M |
| Non-GAAP gross margin | 46.7%–47.1% | same | same | 46.6%–46.7% |
| Non-GAAP operating expenses | $260M–$262M | same | same | $256M–$257M |
| Non-GAAP operating margin | 0.7%–1.5% | same | same | 0.6%–0.9% |
| GAAP net loss | $83M–$67M | same | same | $77M–$64M |
| Non-GAAP net income | $8M–$12.5M ($0.09–$0.14) | same | same | $9M–$11M ($0.10–$0.12) |
| Adjusted EBITDA | $25M–$30M | same | same | $24M–$26M |
| Capital expenditures | $20M–$25M | same | same | $15M–$20M |
| Operating cash flow | Positive for the year | Positive for the year | Positive in H2 only | Positive in H2 |
Sources: outlooks in the Q4 2025, Q1 2026, Q2 2026 and Q3 2026 releases.
The company said the new figures "reflect longer sales cycles and greater variability in timing associated with larger, production-focused orders." At the midpoint, revenue guidance fell by $11.5 million, or 2.0%. Full-year 2026 revenue would now be up 0.9% to 1.8% from $551.1 million in 2025.
Because nine-month revenue is known, the cut can be placed precisely. It all lands on the fourth quarter:
| Implied Q4 2026 (our calculation) | Old range | New range |
|---|---|---|
| Full-year revenue outlook | $565M–$575M | $556M–$561M |
| Less nine-month revenue | $412.9M | $412.9M |
| Implied Q4 revenue | $152.1M–$162.1M | $143.1M–$148.1M |
| Growth vs. Q4 2025 ($140.0M) | +8.6% to +15.8% | +2.2% to +5.8% |
| Implied Q4 adjusted EBITDA (vs. $9.2M in Q4 2025) | n/a | $8.6M–$10.6M |
Our calculation from company guidance and reported nine-month figures; Stratasys does not give quarterly guidance.
Before the report, the old range meant Q4 had to grow faster than any quarter in the table above. The new range asks for growth of 2% to 6%, close to what Q3 just delivered. The lower bar is more believable, but it also means 2026 ends as a flat year rather than a recovery year.
Margins and Profit: Read the GAAP Line Carefully
Non-GAAP gross margin improved to 47.8% from 45.3%. The company credits better margins on the mix of systems sold and a tariff credit, partly offset by lower consumables revenue. The operating review says Stratasys has been refunded part of the tariffs it paid in earlier periods; it does not give the amount. Stratasys is one of many importers recovering tariff payments; our IEEPA tariff refund tracker covers how those refunds have been flowing through earnings.
Operating expenses fell to $73.3 million from $78.8 million. The company attributes that to a gain from a legal settlement, $2.2 million lower investment revaluation charges and $3.1 million of cost cuts, partly offset by $2.2 million of unfavorable currency effects.
| Profit measure | Q3 2026 | Q3 2025 | What it tells you |
|---|---|---|---|
| GAAP operating loss | −$11.0M | −$22.7M | Includes amortization, stock pay and one-offs |
| Non-GAAP operating income | $2.7M (1.9% margin) | $0.1M | Management's adjusted view |
| GAAP net loss | −$10.2M | −$55.6M | Q3 2025 included a $33.9M Ultimaker impairment |
| Non-GAAP net income | $3.5M | $1.5M | Excludes $13.7M of adjustments in Q3 2026 |
| Adjusted EBITDA | $8.0M (5.6% margin) | $5.0M (3.6% margin) | Not the same as cash |
The headline GAAP improvement of $45.4 million is mostly last year's impairment dropping out of the comparison. Two of this quarter's helpers, the tariff refund and the legal settlement, are not things to count on every quarter either.
Cash Flow: Back to Positive, Still Negative for the Year
Operating cash flow was $3.5 million in Q3, after an $18.7 million outflow in Q2 that the company blamed on non-routine items, including legal expenses to protect its intellectual property. That keeps the August promise of positive operating cash flow in the second half on track, but only just.
| Cash measure | Nine months 2026 | Nine months 2025 |
|---|---|---|
| Operating cash flow | −$12.8M | $10.3M |
| Purchases of property and equipment | $11.0M | $15.5M |
| Free cash flow (our calculation: operating cash flow minus property and equipment) | −$23.7M | −$5.1M |
| Cash, equivalents and short-term deposits at period end | $210.7M | $255.0M |
Source: Q3 2026 financial statements. Our free cash flow figure leaves out other investing outflows such as intangibles ($1.7 million) and investments in other companies ($5.3 million).
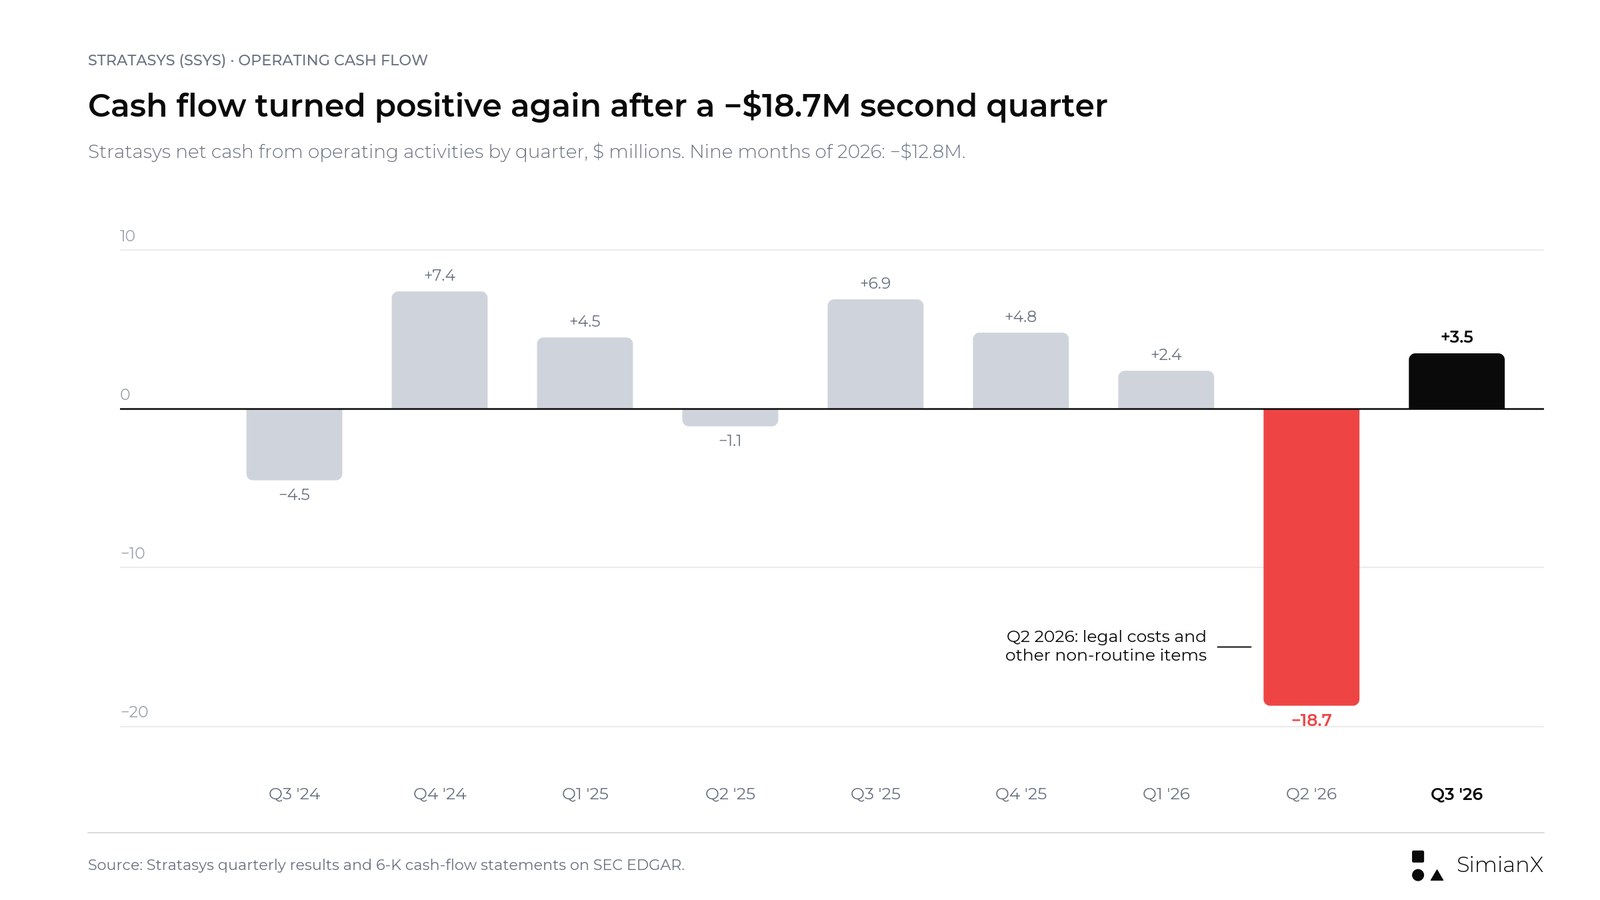
In Q3 alone, capital spending was about $3.4 million, so free cash flow was roughly break-even, at about $0.1 million. For the first nine months, $13.1 million went into working capital, mostly a $17.9 million rise in receivables. Receivables stood at $169.1 million at September 30, up from $151.3 million a year earlier. The first-half outflow is not recovered: positive H2 cash flow and positive full-year cash flow are different promises, and the company dropped the full-year one in August.
The balance sheet still has room. Stratasys has no debt. Cash and deposits fell to $210.7 million from $244.5 million at the end of 2025, reflecting the operating outflow, capital spending, investments in other companies and payments tied to past acquisitions, not buybacks or deals.
The Markforged Deal Is Off
Going into the report, the Markforged acquisition looked like a pending growth lever. It is no longer pending.
Stratasys agreed in late May 2026 to buy Markforged, a maker of continuous carbon fiber and other fused filament fabrication printers owned by Nano Dimension, for $42.5 million in cash (Stratasys announcement, May 27, 2026). The deal excluded Markforged's metal binder jetting business, which Nano Dimension was keeping.
On November 11, 2026, the two companies mutually terminated the deal. In its 8-K filing, Nano Dimension said both sides "determined that obtaining the needed regulatory approvals to close would take materially longer, and be more expensive, than initially anticipated." Stratasys disclosed the termination in a note to its Q3 financial statements and did not mention it in the results release.
What that changes:
- No acquired revenue in 2026. The updated outlook is a legacy-only number, so there is no Markforged contribution to separate from organic growth.
- The $42.5 million stays on the balance sheet. That keeps cash at about $210.7 million with no debt.
- The aerospace and defense pitch loses a piece. Stratasys had said Markforged's carbon fiber technology would support mission-critical aerospace and defense parts. That strategic gap now has to be filled another way.
SSYS Stock: Earnings-Day Reactions and Price Context
SSYS opened at $6.69 on November 12 and closed at $5.81, down 11.2% from the November 11 close of $6.54. During the session it touched $5.80, the lowest price since at least 2003. The stock had closed at $11.62 on January 15, 2026, so the November 12 close was 50% below that level and about 33% below the 2025 year-end close of $8.68.
| Results date | Quarter | Prior close | Day close | Change |
|---|---|---|---|---|
| Nov 13, 2024 | Q3 2024 | $8.39 | $10.11 | +20.5% |
| Mar 5, 2025 | Q4 2024 | $10.61 | $10.35 | −2.5% |
| May 8, 2025 | Q1 2025 | $9.72 | $11.13 | +14.5% |
| Aug 13, 2025 | Q2 2025 | $11.37 | $10.01 | −12.0% |
| Nov 13, 2025 | Q3 2025 | $9.54 | $9.33 | −2.2% |
| Mar 5, 2026 | Q4 2025 | $9.80 | $9.10 | −7.1% |
| May 7, 2026 | Q1 2026 | $9.25 | $8.20 | −11.4% |
| Aug 13, 2026 | Q2 2026 | $8.84 | $8.97 | +1.5% |
| Nov 12, 2026 | Q3 2026 | $6.54 | $5.81 | −11.2% |
Source: Polygon.io daily closes, cross-checked against Nasdaq historical quotes. All nine releases came out before the market opened, so the change is measured from the prior close.
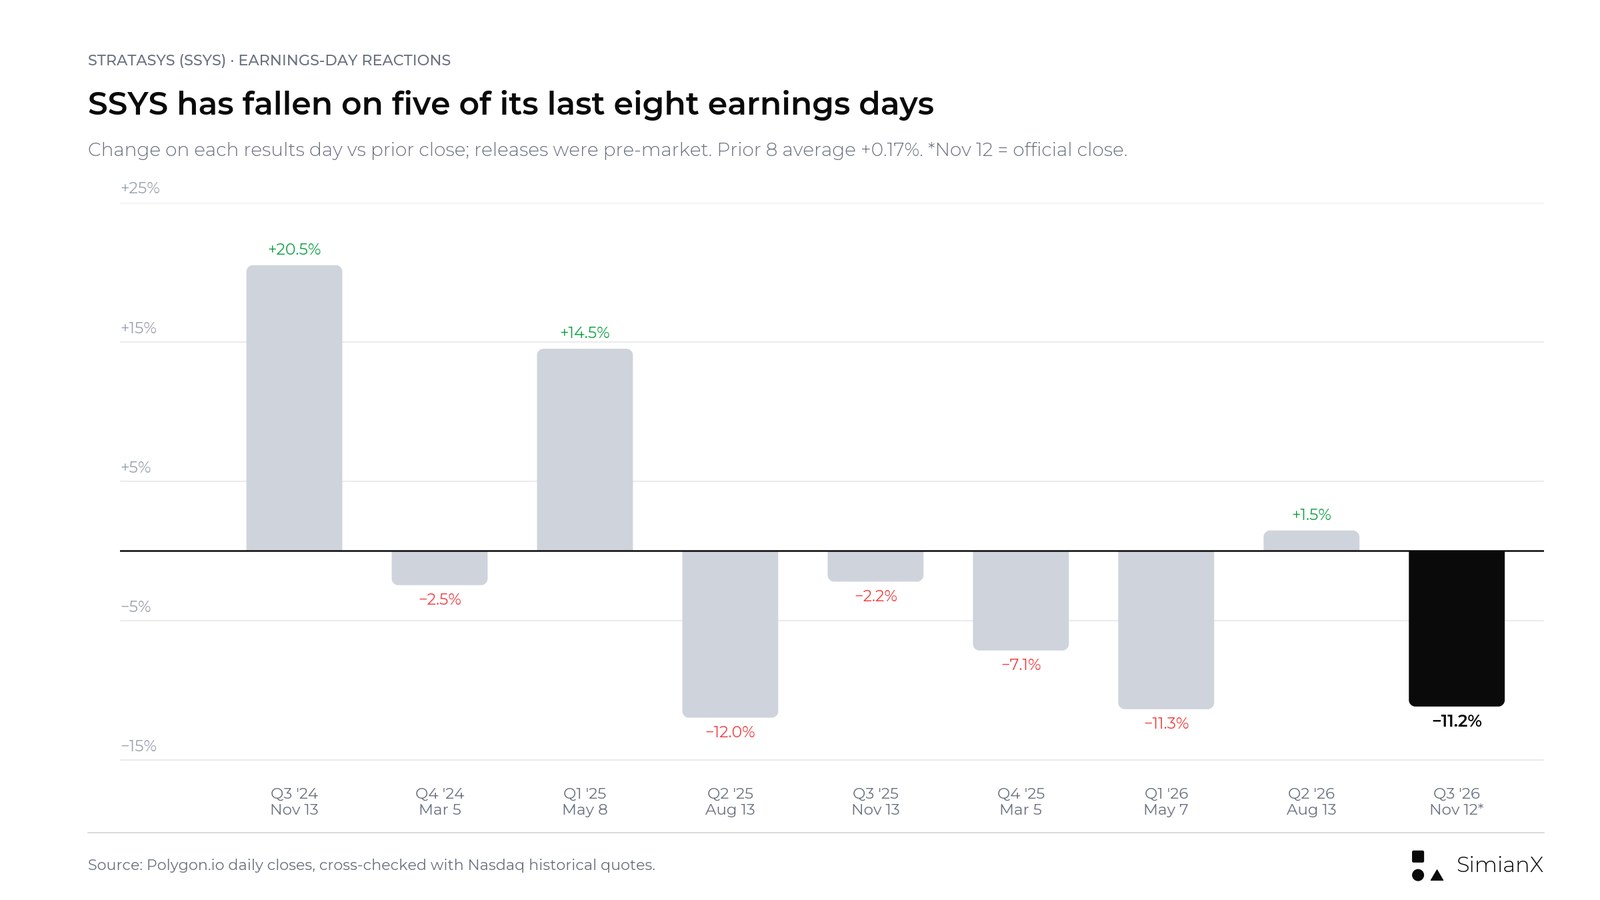
Over the previous eight reports, the stock rose three times and fell five times. The average move was +0.17% and the median was −2.3%, but the average size of the move, up or down, was about 9%. The two big gains came in 2024 and early 2025; every reaction since August 2025 has been a fall except August 2026.
For scale (our calculation, at $5.81): 88.1 million shares outstanding give a market value of about $512 million. Taking off $210.7 million of cash and deposits, with no debt, leaves an enterprise value of about $301 million, roughly 0.5 times the midpoint of 2026 revenue guidance. The market is pricing Stratasys as a company with little profit, not as a growth story. Whether that is too low depends on whether Q3's printer demand repeats.
We do not quote a sell-side consensus for the quarter. Data providers use different earnings-per-share definitions from the company's non-GAAP measure, and the pre-report revenue and EPS estimates we found could not be verified from a primary source.
Bull, Base and Bear Cases After Q3
These are qualitative frameworks, not forecasts.
| Scenario | What would have to happen | How to read it |
|---|---|---|
| Bull | Defense and automotive orders keep converting, consumables return to growth, Q4 lands at the top of the implied $143M–$148M range and H2 cash flow stays positive | A real, if slow, operating recovery |
| Base | Q4 comes in near the middle of the range, consumables stay flat, cash flow near break-even | Stabilization at about $555M–$560M of annual revenue |
| Bear | Large orders slip again, consumables keep falling, Q4 misses the lowered range and H2 cash flow turns negative | The Q3 growth was order timing, not a turn |
Questions for the Next Few Quarters
- Do systems hold up without a defense spike? Q3 systems rose 36% from Q2. A repeat in Q4 would say more than one quarter can.
- Why did consumables fall? The company did not explain the drop from the Q2 record. Materials are the recurring revenue the model depends on.
- How much did the tariff refund add? It helped both product and service margins in Q3 and may not recur.
- Can receivables come down? A $17.9 million build in nine months is a large share of the cash shortfall.
- What replaces Markforged? The company still wants carbon fiber and mission-critical parts in its aerospace and defense portfolio.
- Will 2027 guidance assume growth? The next outlook, expected with Q4 results, will show whether management sees Q3 as a turn or a timing bump.
Frequently Asked Questions
When did Stratasys report Q3 2026 earnings?
Stratasys released Q3 2026 results before the market opened on Thursday, November 12, 2026, and held its conference call at 8:30 a.m. ET the same day.
Did Stratasys return to revenue growth?
Yes, for this quarter. Q3 2026 revenue was $142.6 million, up 4.1% from $137.0 million. It was the first quarter of meaningful year-over-year growth since at least 2023. Nine-month revenue was up only 0.4%.
Why did Stratasys lower its 2026 guidance?
The company cut full-year revenue guidance to $556 million to $561 million from $565 million to $575 million. It said the change reflects longer sales cycles and greater variability in the timing of larger, production-focused orders.
What happened to the Markforged acquisition?
Stratasys and Nano Dimension mutually terminated the $42.5 million deal on November 11, 2026. Nano Dimension said regulatory approvals would have taken materially longer and cost more than expected.
Is Stratasys profitable?
On an adjusted basis, barely. Q3 2026 non-GAAP net income was $3.5 million and adjusted EBITDA was $8.0 million. On a GAAP basis, the company lost $10.2 million in the quarter and $50.9 million over nine months.
Why did SSYS stock fall after earnings?
The stock closed down 11.2% at $5.81 on November 12. The release paired 4.1% growth with a lower full-year outlook, a decline in consumables and an implied Q4 well below what the old range required. The Markforged termination was disclosed in filings the same day.
When is the next Stratasys earnings date?
Stratasys has not announced it. Its last two fourth-quarter reports came out on March 5, in 2025 and 2026.
Verdict: Growth Is Back for a Quarter, the Recovery Is Not Proven
Can SSYS return to growth? In Q3 2026, it did. But it did so with a product mix that leans on printer orders rather than recurring materials, and in the same release it lowered the full-year outlook.
The most useful line on this page is the implied fourth quarter. Under the old range, Q4 needed 9% to 16% growth; under the new one, it needs 2% to 6%. That is a more realistic bar, but it also means 2026 revenue will end within about 2% of 2025.
The next report will show whether Q3 was the start of a trend. That means growth in both systems and consumables, receivables coming down and second-half cash flow that stays positive. Without the Markforged deal, the company has to get there on its own business.
For how the same by-quarter approach has played out at other companies this season, see our reference pages on Caterpillar's Q3 backlog and stock reaction and Tetra Tech's earnings by quarter.
This article is research and analysis, not investment advice or a recommendation to buy or sell any security.
Related Reading
- Airbnb Earnings by Quarter: Q3 2026 Results and ABNB Stock
- ConocoPhillips Earnings by Quarter: Q3 2026 Results and EPS
- McDonald’s Earnings by Quarter: Q3 2026 Results and Comps
- Why Is Caterpillar Stock Down? Q3 2026 Earnings and Backlog
- Tetra Tech Earnings by Quarter: Q4 FY2026 Preview and TTEK
- D-Wave Q3 2026 Earnings: $4.5M Revenue Beat, $0.13 Loss Miss
- Constellation Energy Q3 2026 Earnings: $5.06 EPS Beats $3.90
- IEEPA Tariff Refunds: 78 Stocks That Got Paid and How Much
References
- Stratasys: Q3 2026 results release (Form 6-K, Exhibit 99.1)
- Stratasys: Q3 2026 investor presentation (Form 6-K, Exhibit 99.2)
- Stratasys: Q3 2026 operating and financial review (Form 6-K)
- Stratasys: Q3 2026 condensed consolidated financial statements (Form 6-K)
- Stratasys: Q2 2026 results release
- Stratasys: Q2 2026 investor presentation
- Stratasys: Q2 2026 operating and financial review
- Stratasys: Q2 2026 financial statements
- Stratasys: Q1 2026 results release
- Stratasys: Q4 and full-year 2025 results release
- Stratasys: Q3 2025 results release
- Stratasys: Q2 2025 results release
- Stratasys: Q1 2025 results release
- Stratasys: Q3 2024 results release
- Stratasys: Form 20-F for 2025
- Nano Dimension: Form 8-K on the terminated Markforged sale, November 2026
- Stratasys: Agreement to acquire Markforged, May 27, 2026
- Stratasys: Q3 2026 conference call notice
- Stratasys: New F870 printer for serial production, Formnext 2026
- Nasdaq: SSYS historical quotes
- SEC EDGAR: Stratasys filings