
 By Muke
Tetra Tech Q4 FY2026 Earnings Results: Quarterly Table, Backlog, Cash Flow, FY2027 Guidance and TTEK Stock Reaction
Tetra Tech reported fiscal fourth-quarter 2026 results at the U.S. market close on Wednesday, November 11, and beat its own guidance. Net revenue of $1.15 billion landed above the midpoint of the $1.12 billion to $1.17 billion range, and adjusted EPS of $0.49 (GAAP EPS $0.51) topped both the $0.45 to $0.48 guidance and the $0.47 analyst consensus. Backlog rose 13% from a year earlier to $4.67 billion. The first fiscal 2027 outlook calls for EPS of $1.65 to $1.80, a midpoint of $1.725 against the $1.74 consensus. TTEK, which had fallen 7.5% to $37.61 in the session before the release, closed at $39.43 on November 12, up 4.8% while the S&P 500 ETF (SPY) slipped 0.4%.
This page is a Tetra Tech earnings reference. It was first built before the release and has now been updated with the results. It puts nine quarters of company-reported results in one table, follows the order book and cash flow, checks the Q4 results against guidance, compares the new fiscal 2027 outlook with the consensus, and lists how TTEK stock moved after each of its last 13 quarterly reports. The question is the one the original draft asked: can a stronger order book turn into sustainable growth after the loss of most U.S. international-development work? A two-cent beat against a single EPS estimate does not answer it on its own.
Updated November 13, 2026 (U.S. Pacific time) with Tetra Tech’s fiscal Q4 2026 results (Form 8-K, Exhibit 99.1, released November 11 at 4:00 p.m. Eastern), the November 12 conference call and the official November 12 closing prices. First published November 10, before the release. Sources: Tetra Tech’s Form 8-K earnings releases, Forms 10-Q and 10-K on SEC EDGAR, company press releases, dated estimates from Zacks (via Nasdaq.com) and Kiplinger, and daily closing prices from Polygon.io, checked against Nasdaq.com. Reported figures, guidance, estimates and our own calculations are labeled throughout.
Tetra Tech Q4 FY2026 Results vs Guidance and Consensus
| Item | Guidance or estimate | Reported | Result |
|---|---|---|---|
| Q4 net revenue | $1.12 billion–$1.17 billion (company) | $1,152.9 million | Above the $1,145 million midpoint; −0.9% year over year |
| Q4 GAAP revenue | — | $1,337.4 million | +0.5% year over year |
| Q4 EPS | $0.45–$0.48 (company); $0.47 consensus | GAAP $0.51; adjusted $0.49 | Above the top of guidance; adjusted EPS +9% year over year |
| Q4 operating income | — | $188.4 million | $181.3 million a year earlier |
| Q4 adjusted EBITDA | — | $194.5 million | Margin up 90 basis points year over year (company) |
| Backlog, September 27, 2026 | — | $4.67 billion | +13% year over year; +4% from June |
| FY2026 net revenue | $4.315 billion–$4.365 billion | $4,348.3 million | Inside the range; −5.8% vs FY2025 |
| FY2026 EPS | $1.56–$1.59 (adjusted) | GAAP $1.69; adjusted $1.60 | Above the top of the adjusted range |
| FY2026 operating cash flow | — | $523.0 million | +14% year over year |
Source: Tetra Tech’s Q4 and fiscal 2026 earnings release (Form 8-K, Exhibit 99.1), November 11, 2026; guidance from the July 29, 2026 release; consensus from Zacks via Nasdaq.com, November 10. Year-over-year changes, the guidance midpoint and the sequential backlog change are our calculations from reported figures, except where marked “company”.
The quarter was a clear beat on profit and a solid result on revenue. Net revenue was 0.9% lower than in Q4 FY2025, but that quarter still contained $97.8 million of USAID/Department of State revenue; excluding episodic disaster response, the company says Q4 net revenue grew 5%. On the November 12 call, CEO Roger Argus said U.S. federal work was 26% of quarterly revenue and grew 9%, and that U.S. commercial revenue grew 6%. By segment, Government Services Group (GSG) net revenue fell 5.2% year over year to $512.6 million, while Commercial/International Services Group (CIG) net revenue rose 2.8% to $640.3 million (our calculations from the release).
GAAP EPS ($0.51) was above adjusted EPS ($0.49). The release’s adjusted EBITDA reconciliation removes a $7.0 million contingent-consideration fair-value gain in Q4; the release does not show a separate EPS bridge.
Fiscal 2027 Guidance vs the $1.74 Consensus
| Outlook item | Company guidance, November 11, 2026 | Comparison (our calculation) |
|---|---|---|
| Q1 FY2027 net revenue | $1.04 billion–$1.08 billion | +0.3% to +4.1% vs Q1 FY2026 ($1,037.2 million) |
| Q1 FY2027 EPS | $0.36–$0.38 | Q1 FY2026: $0.35 adjusted, $0.40 GAAP |
| FY2027 net revenue | $4.425 billion–$4.625 billion | +1.8% to +6.4% vs FY2026 ($4,348.3 million); midpoint +4.1% |
| FY2027 EPS | $1.65–$1.80 | Midpoint $1.725 vs $1.74 consensus; +3.1% to +12.5% vs FY2026 adjusted EPS of $1.60 |
Sources: Tetra Tech’s Q4 and fiscal 2026 earnings release; FY2027 consensus from Zacks via Nasdaq.com, November 10, 2026, before the release.
The range brackets the consensus, but its midpoint sits 1.5 cents below it. The guidance does not include contributions from future acquisitions. On the call, management assumed interest expense of $30 million to $35 million and an effective tax rate of 27.5%, and said it expects about 5% growth in U.S. federal work and about 10% growth in U.S. commercial work in fiscal 2027. The release does not say whether the fiscal 2027 EPS range is GAAP or adjusted, so comparisons with an adjusted consensus need that caveat.
Tetra Tech Q4 FY2026 Earnings: What to Know
| Item | Figure | Source and date |
|---|---|---|
| Report date | Wednesday, November 11, 2026, released at 4:00 p.m. Eastern (U.S. market close) | Tetra Tech announcement, October 21, 2026; release time via Nasdaq.com |
| Conference call | Held Thursday, November 12, 2026, 8:00 a.m. Pacific Time (11:00 a.m. Eastern) | Tetra Tech earnings-call page |
| Company Q4 guidance | Net revenue $1.12 billion–$1.17 billion; EPS $0.45–$0.48 | Q3 2026 release, July 29, 2026 |
| Consensus EPS before the release | $0.47 (2 analysts) | Zacks via Nasdaq.com, November 10; Kiplinger’s calendar also listed $0.47 |
| Year-ago quarter (Q4 FY2025) | Revenue $1,330.1 million; net revenue $1,163.3 million; EPS $0.48, adjusted EPS $0.45 | Q4 2025 release, November 12, 2025 |
| Full-year FY2026 guidance | Net revenue $4.315 billion–$4.365 billion; adjusted EPS $1.56–$1.59 | Q3 2026 release |
| FY2027 consensus EPS before the release | $1.74 (range $1.72–$1.75, 2 analysts) | Zacks via Nasdaq.com, November 10 |
| Backlog at June 28, 2026 | $4.49 billion, up 5% sequentially | Q3 2026 release |
| Backlog at September 27, 2026 | $4.67 billion, up 13% year over year | Q4 2026 release |
| TTEK close after the report | $39.43 (November 12, 2026), after $37.61 on November 11 and $40.65 on November 10; +17.6% year to date vs +11.0% for SPY | Polygon.io; Nasdaq.com official closes |
| TTEK 52-week closing range | $26.18 (May 15, 2026) to $42.61 (February 10, 2026) | Polygon.io |
Analyst estimates are third-party snapshots, not company guidance. The original draft dated the Kiplinger estimate to November 6 and gave a China Standard Time conversion; we have replaced both with the dated sources above. Tetra Tech’s fiscal year ends in late September (on September 28 in 2025), so “Q4 FY2026” is the quarter ended in late September 2026, not a calendar fourth quarter.
Before the release, the consensus of $0.47 sat inside management’s range, one cent below the top. With only two analysts in the Zacks count, the estimate was thin, and the company’s own range was the more useful yardstick. Over the four reports before this one Tetra Tech beat the Zacks consensus every time, by 2 to 5 cents a share: $0.45 vs $0.40 (Q4 FY2025), $0.35 vs $0.31 (Q1 FY2026), $0.34 vs $0.31 (Q2) and $0.42 vs $0.40 (Q3). Q4 FY2026 made it five in a row, at $0.49 vs $0.47. As the reaction table further down shows, those beats did not reliably move the stock in the same direction.
Wednesday, November 11, was Veterans Day. U.S. stock exchanges were open; the bond market was closed.
The report is best judged as a transition into fiscal 2027, not only as a comparison with one quarterly estimate.
Tetra Tech Earnings by Quarter, Q4 FY2024 to Q4 FY2026
| Fiscal quarter (period end) | Revenue ($M) | Net revenue ($M) | EPS (GAAP) | Adjusted EPS | Remaining performance obligations ($B) |
|---|---|---|---|---|---|
| Q4 FY2024 (Sep 29, 2024) | 1,374.5 | 1,144.5 | $0.35 | $0.38 | 5.33 |
| Q1 FY2025 (Dec 29, 2024) | 1,420.6 | 1,197.3 | $0.00 | $0.35 | 5.39 |
| Q2 FY2025 (Mar 30, 2025) | 1,322.1 | 1,103.7 | $0.02 | $0.33 | 4.26 |
| Q3 FY2025 (Jun 29, 2025) | 1,369.8 | 1,153.0 | $0.43 | $0.43 | 4.24 |
| Q4 FY2025 (Sep 28, 2025) | 1,330.1 | 1,163.3 | $0.48 | $0.45 | 4.10 |
| Q1 FY2026 (Dec 28, 2025) | 1,210.7 | 1,037.2 | $0.40 | $0.35 | 3.92 |
| Q2 FY2026 (Mar 29, 2026) | 1,220.2 | 1,049.7 | $0.36 | $0.34 | 4.22 |
| Q3 FY2026 (Jun 28, 2026) | 1,308.6 | 1,108.6 | $0.42 | $0.42 | 4.44 |
| Q4 FY2026 (Sep 27, 2026) | 1,337.4 | 1,152.9 | $0.51 | $0.49 | — |
Source: revenue, GAAP EPS and remaining performance obligations from Tetra Tech’s XBRL filings (Forms 10-Q and 10-K); net revenue and adjusted EPS from the Form 8-K earnings releases. Q3 FY2026 had no reported adjustments, so adjusted EPS equals GAAP EPS. The large gaps between GAAP and adjusted EPS in Q1 and Q2 FY2025 reflect a $115.0 million legal-contingency charge and a $92.4 million goodwill impairment tied to the USAID cancellations. Remaining performance obligations are a filing measure close to, but not identical with, the backlog figure in the releases. Q4 FY2026 figures come from the November 11, 2026 release; its remaining performance obligations will appear in the Form 10-K.
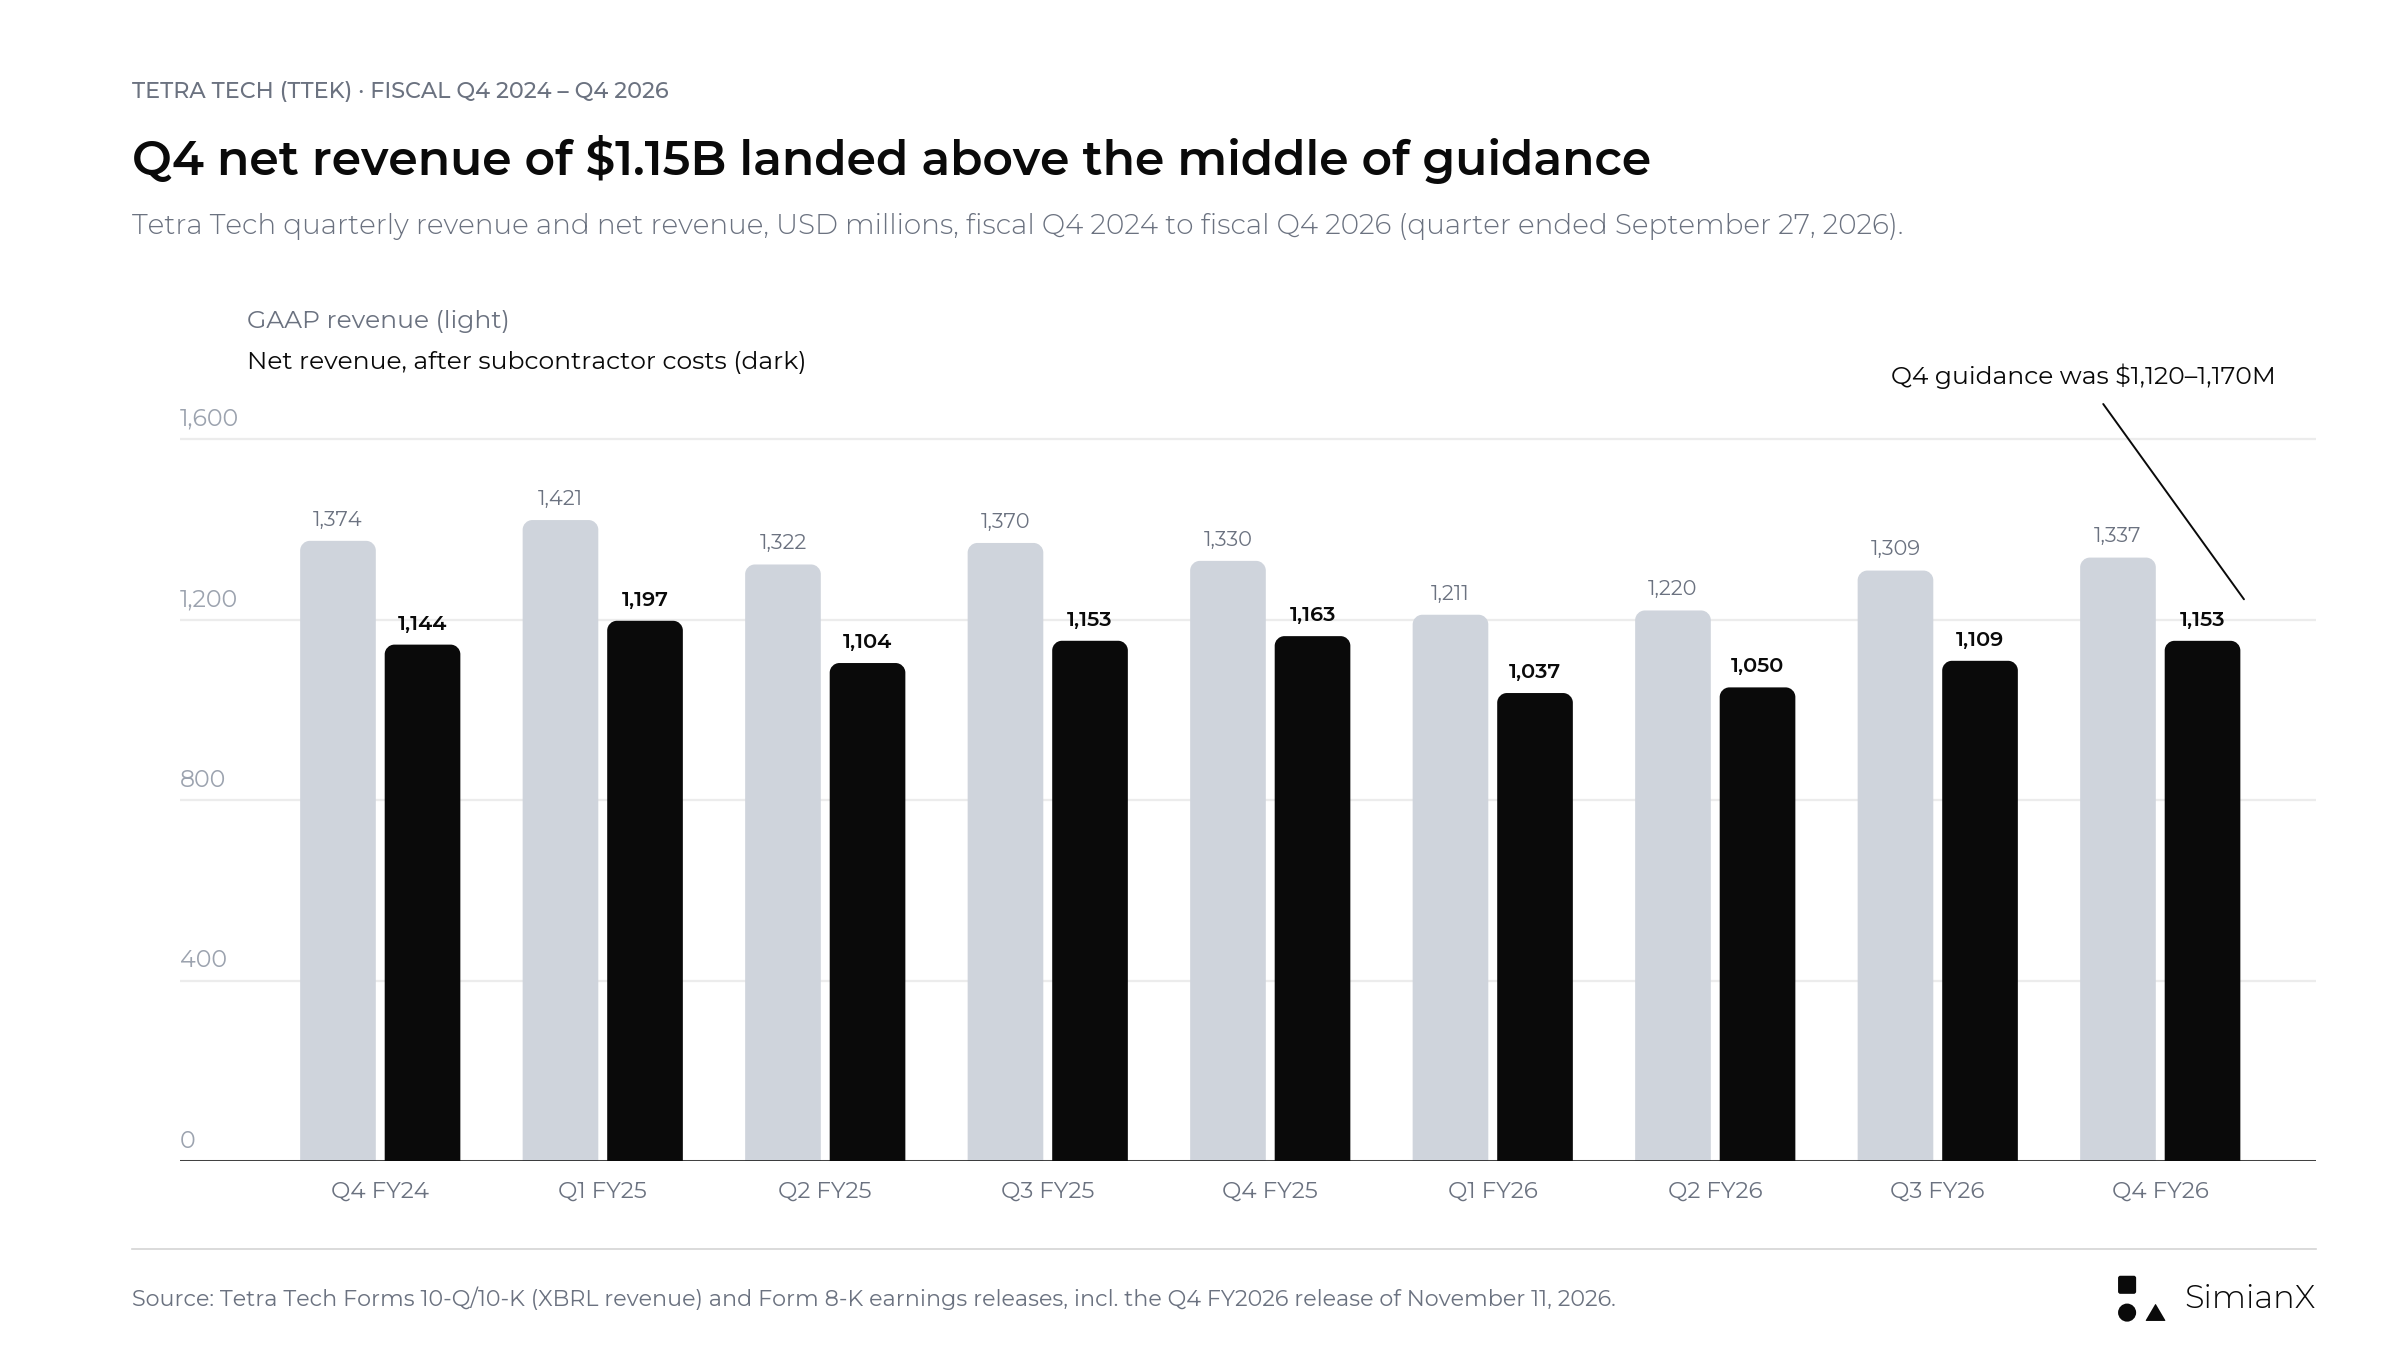
Net revenue fell to about $1.04 billion a quarter after the USAID terminations, reached $1.11 billion in Q3 FY2026 and $1.15 billion in Q4, above the midpoint of the $1.12–$1.17 billion guidance.
Two things stand out. First, GAAP EPS was distorted in the first half of fiscal 2025 by one-time charges, so the cleaner comparison is adjusted EPS, which moved in a narrow $0.33 to $0.45 band before reaching $0.49 in Q4 FY2026. Second, the diluted share count did part of the work: it fell from 271.9 million in Q1 FY2025 to 256.7 million in Q4 FY2026, a 5.6% reduction.
Start With the Right Revenue Definition
Tetra Tech reports both revenue and revenue net of subcontractor costs, which it calls net revenue. The latter is a non-GAAP measure and should not be confused with net income.
That distinction matters when comparing guidance with third-party earnings previews: the company guides to net revenue, while many data services quote GAAP revenue.
| Measure | What it represents | Main analytical use |
|---|---|---|
| GAAP revenue | Revenue before deducting subcontractor costs | Understanding the full reported activity base |
| Net revenue | Revenue less subcontractor costs | Assessing the activity retained within the company’s service model |
| Operating income | Profit after operating expenses | Evaluating execution and operating profitability |
| Operating cash flow | Cash generated by operating activities | Testing earnings conversion |
| Free cash flow | Operating cash flow less capital expenditure in this article | Assessing cash available before acquisitions and financing decisions |
The first two measures can grow at different rates when subcontracting intensity changes. In Q3 FY2026, for example, revenue was $1,308.6 million and net revenue $1,108.6 million; subcontractor costs took about 15% of revenue.
A headline that compares a net-revenue forecast with prior-year GAAP revenue can therefore create a misleading impression of growth or contraction.
The same denominator discipline applies to margins. Operating income divided by GAAP revenue is not the same calculation as operating income divided by net revenue. Q3 FY2026 operating income of $158 million is 12.1% of revenue but 14.3% of net revenue (our calculation).
What the Q4 Guidance Implied, and What Tetra Tech Delivered
The fourth-quarter range was not a separate forecast; it was the remainder of the full-year guidance. Through nine months Tetra Tech reported $3,195.4 million of net revenue and $1.11 of adjusted EPS ($0.35 + $0.34 + $0.42).
| Check (our calculation) | Result |
|---|---|
| Nine-month net revenue + Q4 net-revenue guidance | $4,315 million–$4,365 million, exactly the full-year range |
| Nine-month adjusted EPS + Q4 EPS guidance | $1.56–$1.59, exactly the full-year adjusted EPS range |
| Q4 net-revenue guidance vs Q4 FY2025 ($1,163.3 million) | −3.7% to +0.6% year over year; midpoint −1.6% |
| Q4 EPS guidance vs Q4 FY2025 adjusted EPS ($0.45) | Flat to +6.7% |
| Full-year net-revenue midpoint vs FY2025 ($4,617.3 million) | −6.0% |
| Reported Q4 net revenue ($1,152.9 million) vs Q4 FY2025 | −0.9% |
| Reported FY2026: net revenue $4,348.3 million; adjusted EPS $1.60 | Net revenue inside the range (−5.8% vs FY2025); adjusted EPS one cent above the top |
The year-ago quarter still contained $97.8 million of USAID/Department of State revenue (GAAP basis), according to the Q4 FY2025 release. A flat reported comparison would therefore imply growth in the rest of the business. The release confirmed that pattern: Q4 net revenue was down 0.9% as reported but up 5% excluding episodic disaster response, according to the company.
Why Is Tetra Tech Revenue Declining?
The clearest explanation is the contraction in international-development work and the uneven comparison with episodic disaster-response activity.
In January 2025 an executive order paused U.S. foreign development assistance. In February 2025 the State Department announced the cancellation of 83% of USAID programs, and Tetra Tech was notified that virtually all of its USAID contracts were terminated for convenience. It recorded a $92.4 million goodwill impairment in its Global Development Services unit. Federal funding risk is not new for contractors; our history of government shutdowns and the stock market shows how often Washington’s budget fights reach the market.
Tetra Tech’s nine-month filing reported approximately $190 million of USAID/Department of State revenue, compared with approximately $550 million in the prior-year period. Total reported revenue declined from $4,112.490 million to $3,739.374 million, a 9.1% decline. U.S. federal government revenue fell 32.5%.
| Nine-month revenue bridge | Amount |
|---|---|
| Total reported revenue decline — calculated | $373.116 million |
| USAID/DOS revenue decline — calculated from rounded disclosures | Approximately $360 million |
| USAID/DOS decline as a share of the total decline — calculated | Approximately 96.5% |
| Revenue from a recent acquisition with no prior-year comparison | Approximately $85 million |
The arithmetic shows that the international-development reduction was approximately equal to almost the entire consolidated revenue decline.
This is a scale comparison, not a complete reconciliation. The prior-year period also included disaster-response work for the Palisades and Eaton fires in Southern California, and the current period includes about $85 million from an acquisition. Those two items move in opposite directions.
The segment split in Q3 FY2026 makes the same point. Revenue in the Government Services Group (GSG) fell $111.0 million, or 15.6%, while the Commercial/International Services Group (CIG) grew revenue by $51.8 million, or 7.7%, and net revenue by 9.3%. The full fiscal year shows the same split: GSG net revenue fell 19.2% to $1,877.5 million, while CIG net revenue rose 7.8% to $2,470.8 million. Consolidated revenue fell 6.7% to $5,076.7 million (our calculations from the Q4 release).
The bullish interpretation is that the consolidated decline overstates weakness in the continuing opportunity set. The cautious interpretation is that excluding a lost business does not restore its revenue, contribution or cash generation. Replacement work must still be won and executed.
Investors should therefore ask two questions separately:
- How healthy is demand outside the disrupted activities?
- How quickly can that demand replace the economic contribution that disappeared?
A recovery thesis needs satisfactory answers to both.
Underlying Growth Is Not Automatically Organic Growth
Tetra Tech reported 8% net-revenue growth in Q3 FY2026 after excluding USAID/DOS and episodic disaster response. It reported 8% growth on similar exclusion-adjusted bases in Q1 and Q2. For the full fiscal year, the company reported 7% net-revenue growth excluding USAID/DOS and episodic disaster response, and for Q4 it reported 5% growth excluding episodic disaster response.
That is useful context, but the wording matters. An exclusion-adjusted growth measure is not automatically an organic, constant-currency growth measure. Removing selected activities answers a different question from removing acquisition and currency effects, and the 10-Q discloses about $85 million of nine-month revenue from a recent acquisition.
| Growth description | What it attempts to isolate | What investors must still check |
|---|---|---|
| Reported growth | Change in the full reported business | Mix changes and unusual comparison periods |
| Growth excluding disrupted activities | Performance outside specified categories | Acquisitions, currency and remaining mix changes |
| Organic growth | Growth excluding defined acquisition effects | The company’s precise methodology |
| Constant-currency growth | Growth excluding currency translation effects | Acquisition effects and project mix |
A stronger disclosure would show the contribution from continuing operations, acquisitions and currency separately. Investors should also examine whether growth is supported by new project activity or simply by easier comparisons.
Backlog Conversion Is More Important Than Backlog Size
A larger order book is valuable only if it converts into profitable work and collectible cash.
Tetra Tech’s backlog was $4.49 billion at June 28, 2026, up 5% from the prior quarter. The CEO said significant Q3 orders, including commercial orders for data-center and sediment-restoration projects, lifted backlog by more than $200 million. On the filing measure, remaining performance obligations bottomed at $3.92 billion in December 2025 and rose to $4.44 billion by June 2026. At fiscal year-end on September 27, 2026, backlog reached $4.67 billion, up 13% year over year and 4% above June; the CEO said key client programs drove it up by more than $530 million. On the call he described it as funded backlog and said Q4 was the third straight quarter with a book-to-bill ratio above 1.1x. The year-end remaining performance obligations will be reported in the Form 10-K.
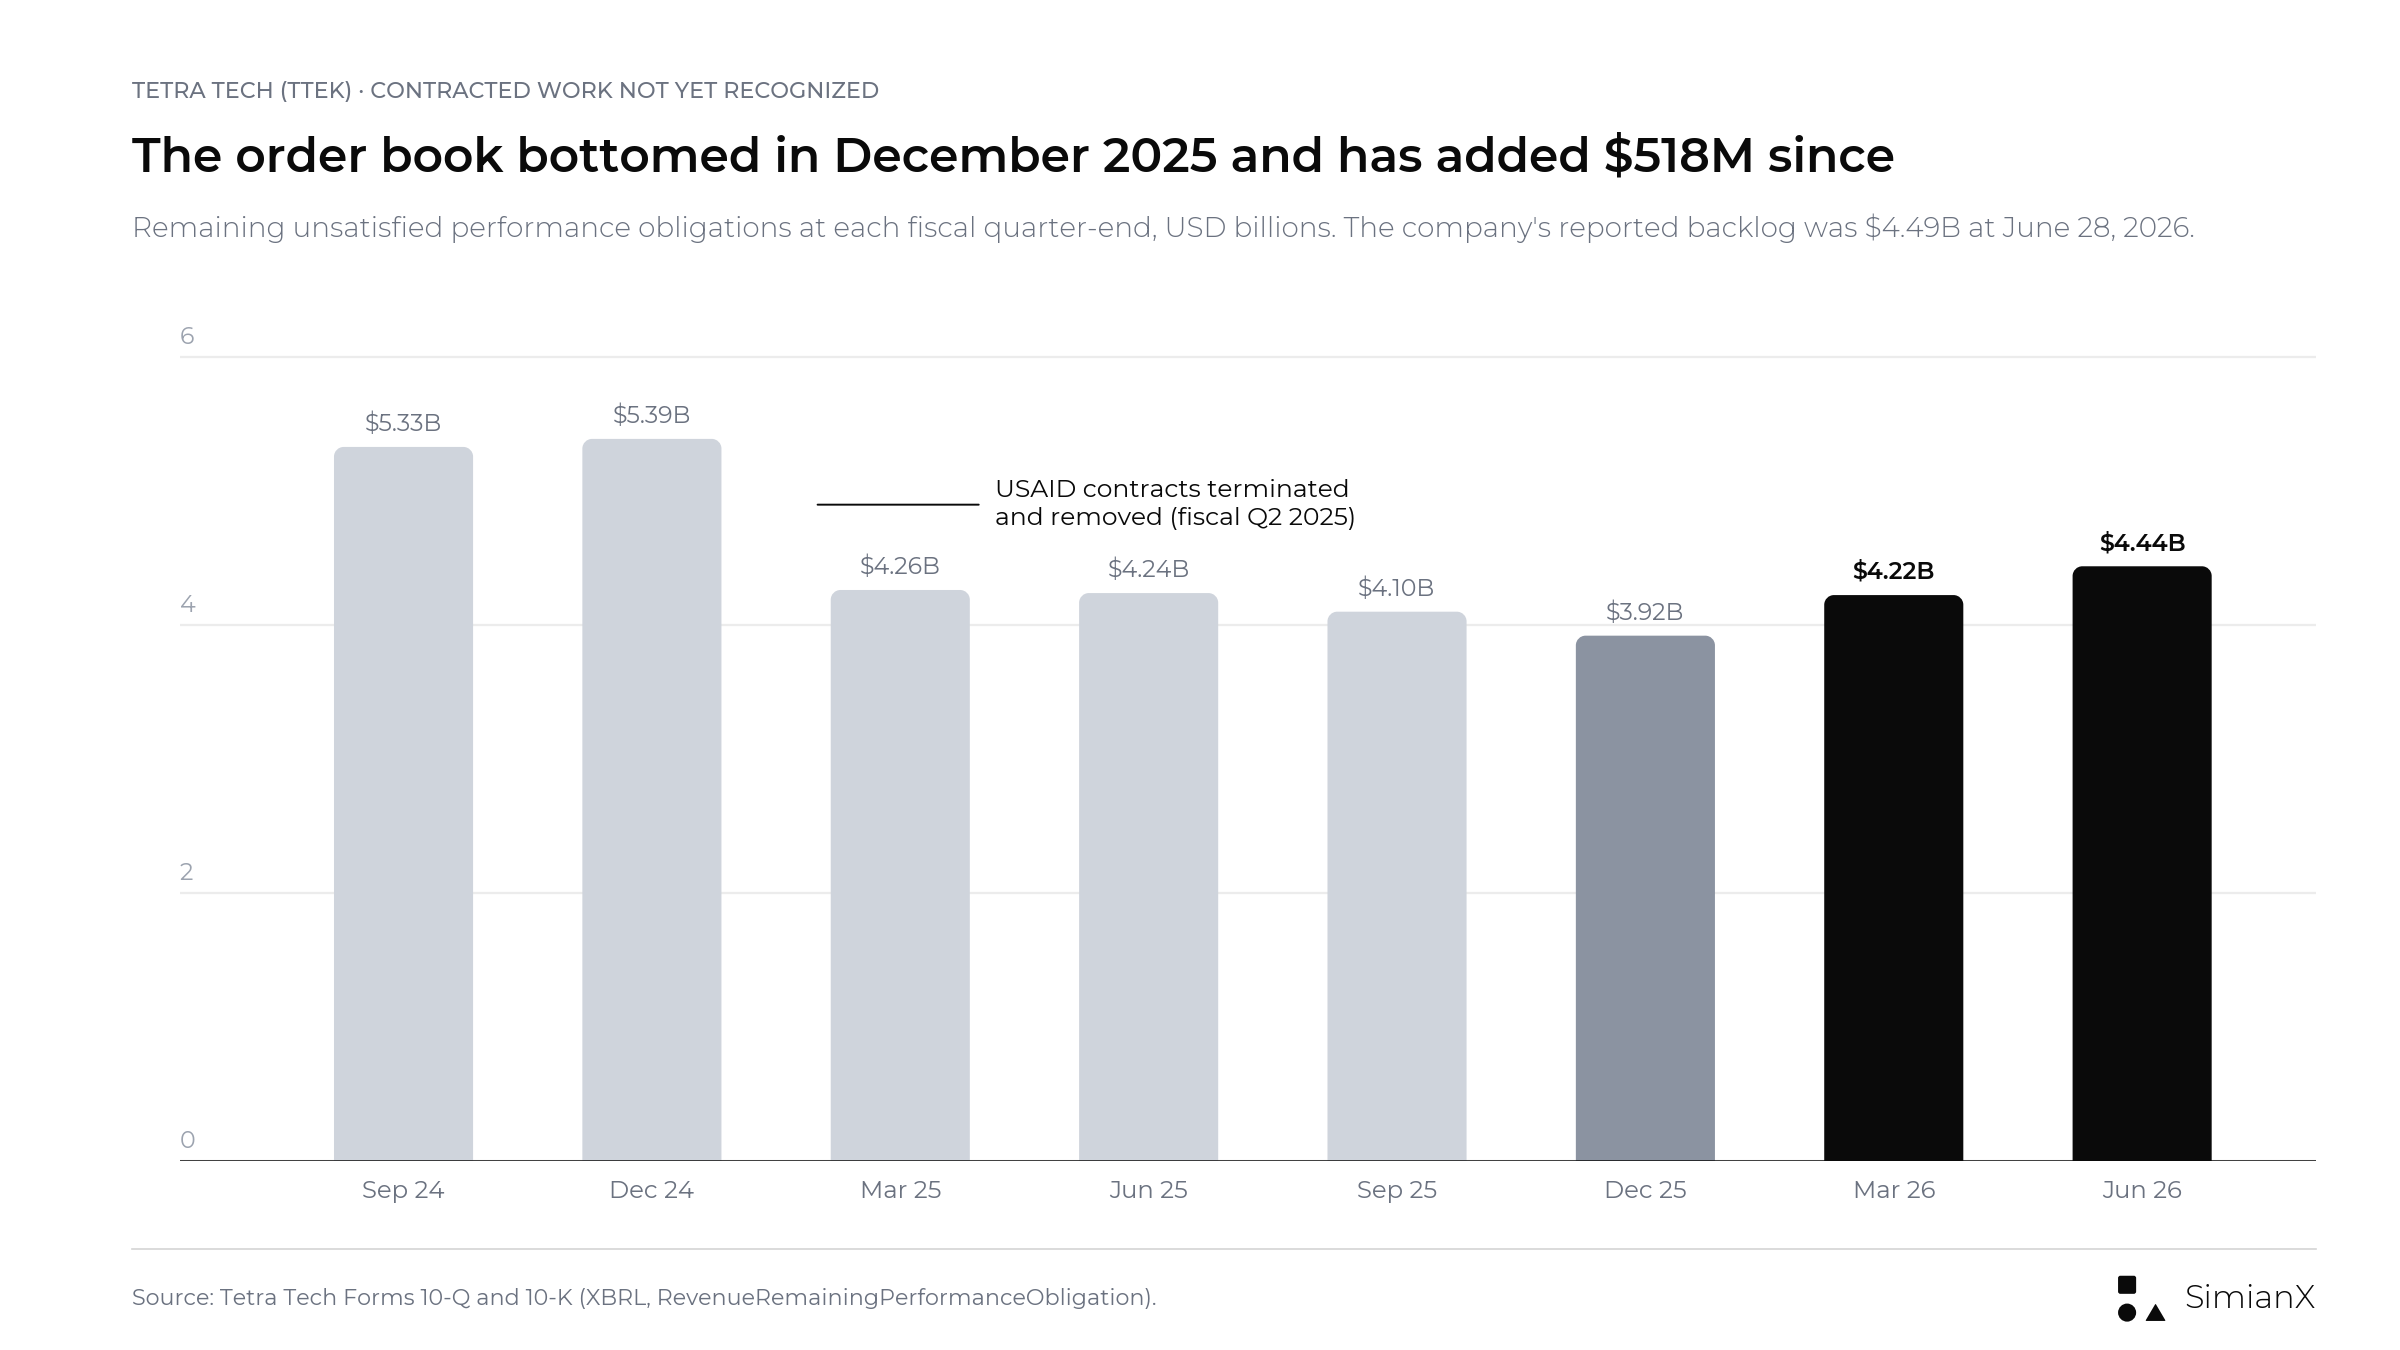
The order book has recovered about $518 million from its low, but it remains below the $5.3–$5.4 billion level held before the USAID terminations.
The filing also explains that backlog does not consider the potential impact of termination-for-convenience provisions. That is not an abstract risk at Tetra Tech: it is exactly how the USAID contracts ended. Backlog is therefore not equivalent to an unconditional cash receivable. The same caution applies to other backlog stories; Caterpillar’s Q3 2026 results are a recent example of a record order book that did not stop the stock from falling.
| Backlog question | Why it matters |
|---|---|
| Is work funded and authorized to proceed? | Determines whether an award can move into execution |
| When should revenue begin? | Separates near-term activity from longer-dated opportunities |
| What is the expected delivery period? | Explains how quickly the order book can be recognized |
| What labor and technical capacity is required? | Tests whether growth can be delivered efficiently |
| What contribution should the work generate? | Distinguishes attractive growth from low-return volume |
| How quickly will customers pay? | Connects project execution with cash generation |
A useful warning sign would be rising backlog accompanied by repeated project-start delays, weaker utilization or slower collections. A more constructive pattern would combine new awards, timely mobilization, stable delivery economics and healthy cash conversion.
Read Contract Announcements Without Overstating Their Value
Tetra Tech’s recent announcements support the breadth of its opportunity set. They also illustrate why contract headlines require careful interpretation.
| Announcement | Disclosed amount or project scale | What the disclosure actually means |
|---|---|---|
| Dayton PFAS treatment design, July 21 | Projected facility construction cost of $350 million | The construction budget is not Tetra Tech’s disclosed fee |
| FAA airspace redesign, July 23 | $27 million task order over four years | A defined service award, not immediate quarterly revenue |
| NOAA coastal geospatial services, August 18 | $49 million multiple-award contract over five years | Award structure and subsequent work allocation matter |
| EPA land revitalization, August 25 | $16.8 million contract over four years | Multiyear technical-service activity |
Sources: Tetra Tech press releases of the dates shown.
The Dayton distinction is especially important. The company announced its selection to design what it calls the largest dedicated PFAS water-treatment facility in the United States; the projected construction cost should not be presented as revenue awarded to Tetra Tech.
Multiple-award arrangements also require care. A headline contract amount is a ceiling shared by several firms; it should not be assigned in full to one participant or recognized immediately.
The Q3 release also listed a hyperscale AI data-center contract for power-system digital automation and cybersecurity. Its value was not disclosed.
The Q4 release added larger awards, led by a $1.4 billion multiple-award blanket purchase agreement for NASA enterprise logistics services, a $145 million multiple-award U.S. Navy engineering contract and a $141 million single-award EPA water-infrastructure assessment contract. The multiple-award caution above applies to the NASA and Navy figures.
Water, Environmental Services and Infrastructure Provide Different Growth Paths
The recent awards suggest several possible sources of replacement demand. The Dayton project concerns PFAS treatment design. The EPA award covers land revitalization. The FAA work concerns airspace modernization, while the NOAA contract involves coastal geospatial services.
Their diversity can reduce dependence on any one project category, but it also makes the business harder to assess through a single macro narrative.
- Water treatment: How quickly do projects progress from planning into detailed engineering?
- Environmental services: Are technical assignments recurring, project-specific or dependent on new funding?
- Infrastructure modernization: Are customers authorizing work at a predictable pace?
- Digital services: Does technology improve delivery economics or create additional service revenue?
Investors should also resist treating every data-center-related assignment as equivalent to owning AI computing infrastructure. In its Q2 FY2026 release, Tetra Tech said its consulting on water supplies and environmental impacts is increasingly critical to gaining community support for new data centers. That is an engineering-services opportunity, not evidence that TTEK has the same economics or revenue exposure as a data-center operator.
Cash Flow Is Strong, but Its Sources Matter
Using operating cash flow less capital expenditure, the Form 10-Q for the first nine months produced the following calculation.
| First nine months of fiscal 2026 | Amount |
|---|---|
| Operating cash flow — reported | $466.553 million |
| Capital expenditure — reported | $13.955 million |
| Free cash flow — our calculation | $452.598 million |
| Operating cash flow, first nine months of fiscal 2025 — reported | $356.838 million |
Source: Tetra Tech’s Form 10-Q for the quarter ended June 28, 2026.
Calculated nine-month free cash flow was approximately $452.6 million before acquisitions and financing activities. The CFO called the $467 million of nine-month operating cash flow the strongest on record.
The filing attributes the $109.7 million year-over-year increase in operating cash flow mainly to collections from disaster-response work completed in Q4 FY2025 and from terminated USAID programs. The prior-year period also included a $57 million legal-contingency payment.
| Fiscal 2026, full year | Amount |
|---|---|
| Operating cash flow — reported | $523.0 million |
| Capital expenditure — reported | $20.5 million |
| Free cash flow — our calculation | $502.5 million |
| Q4 operating cash flow — our calculation (full year less nine months) | $56.5 million |
| Operating cash flow, fiscal 2025 — reported | $457.7 million |
| Business acquisitions, net of cash acquired — reported | $191.9 million |
Source: Tetra Tech’s Q4 and fiscal 2026 earnings release (cash-flow statement).
Full-year operating cash flow rose 14%, but the fourth quarter contributed only about $56.5 million, compared with $100.8 million a year earlier. Cash ended the year at $235.1 million and long-term debt at $892.0 million, up from $763.4 million a year earlier.
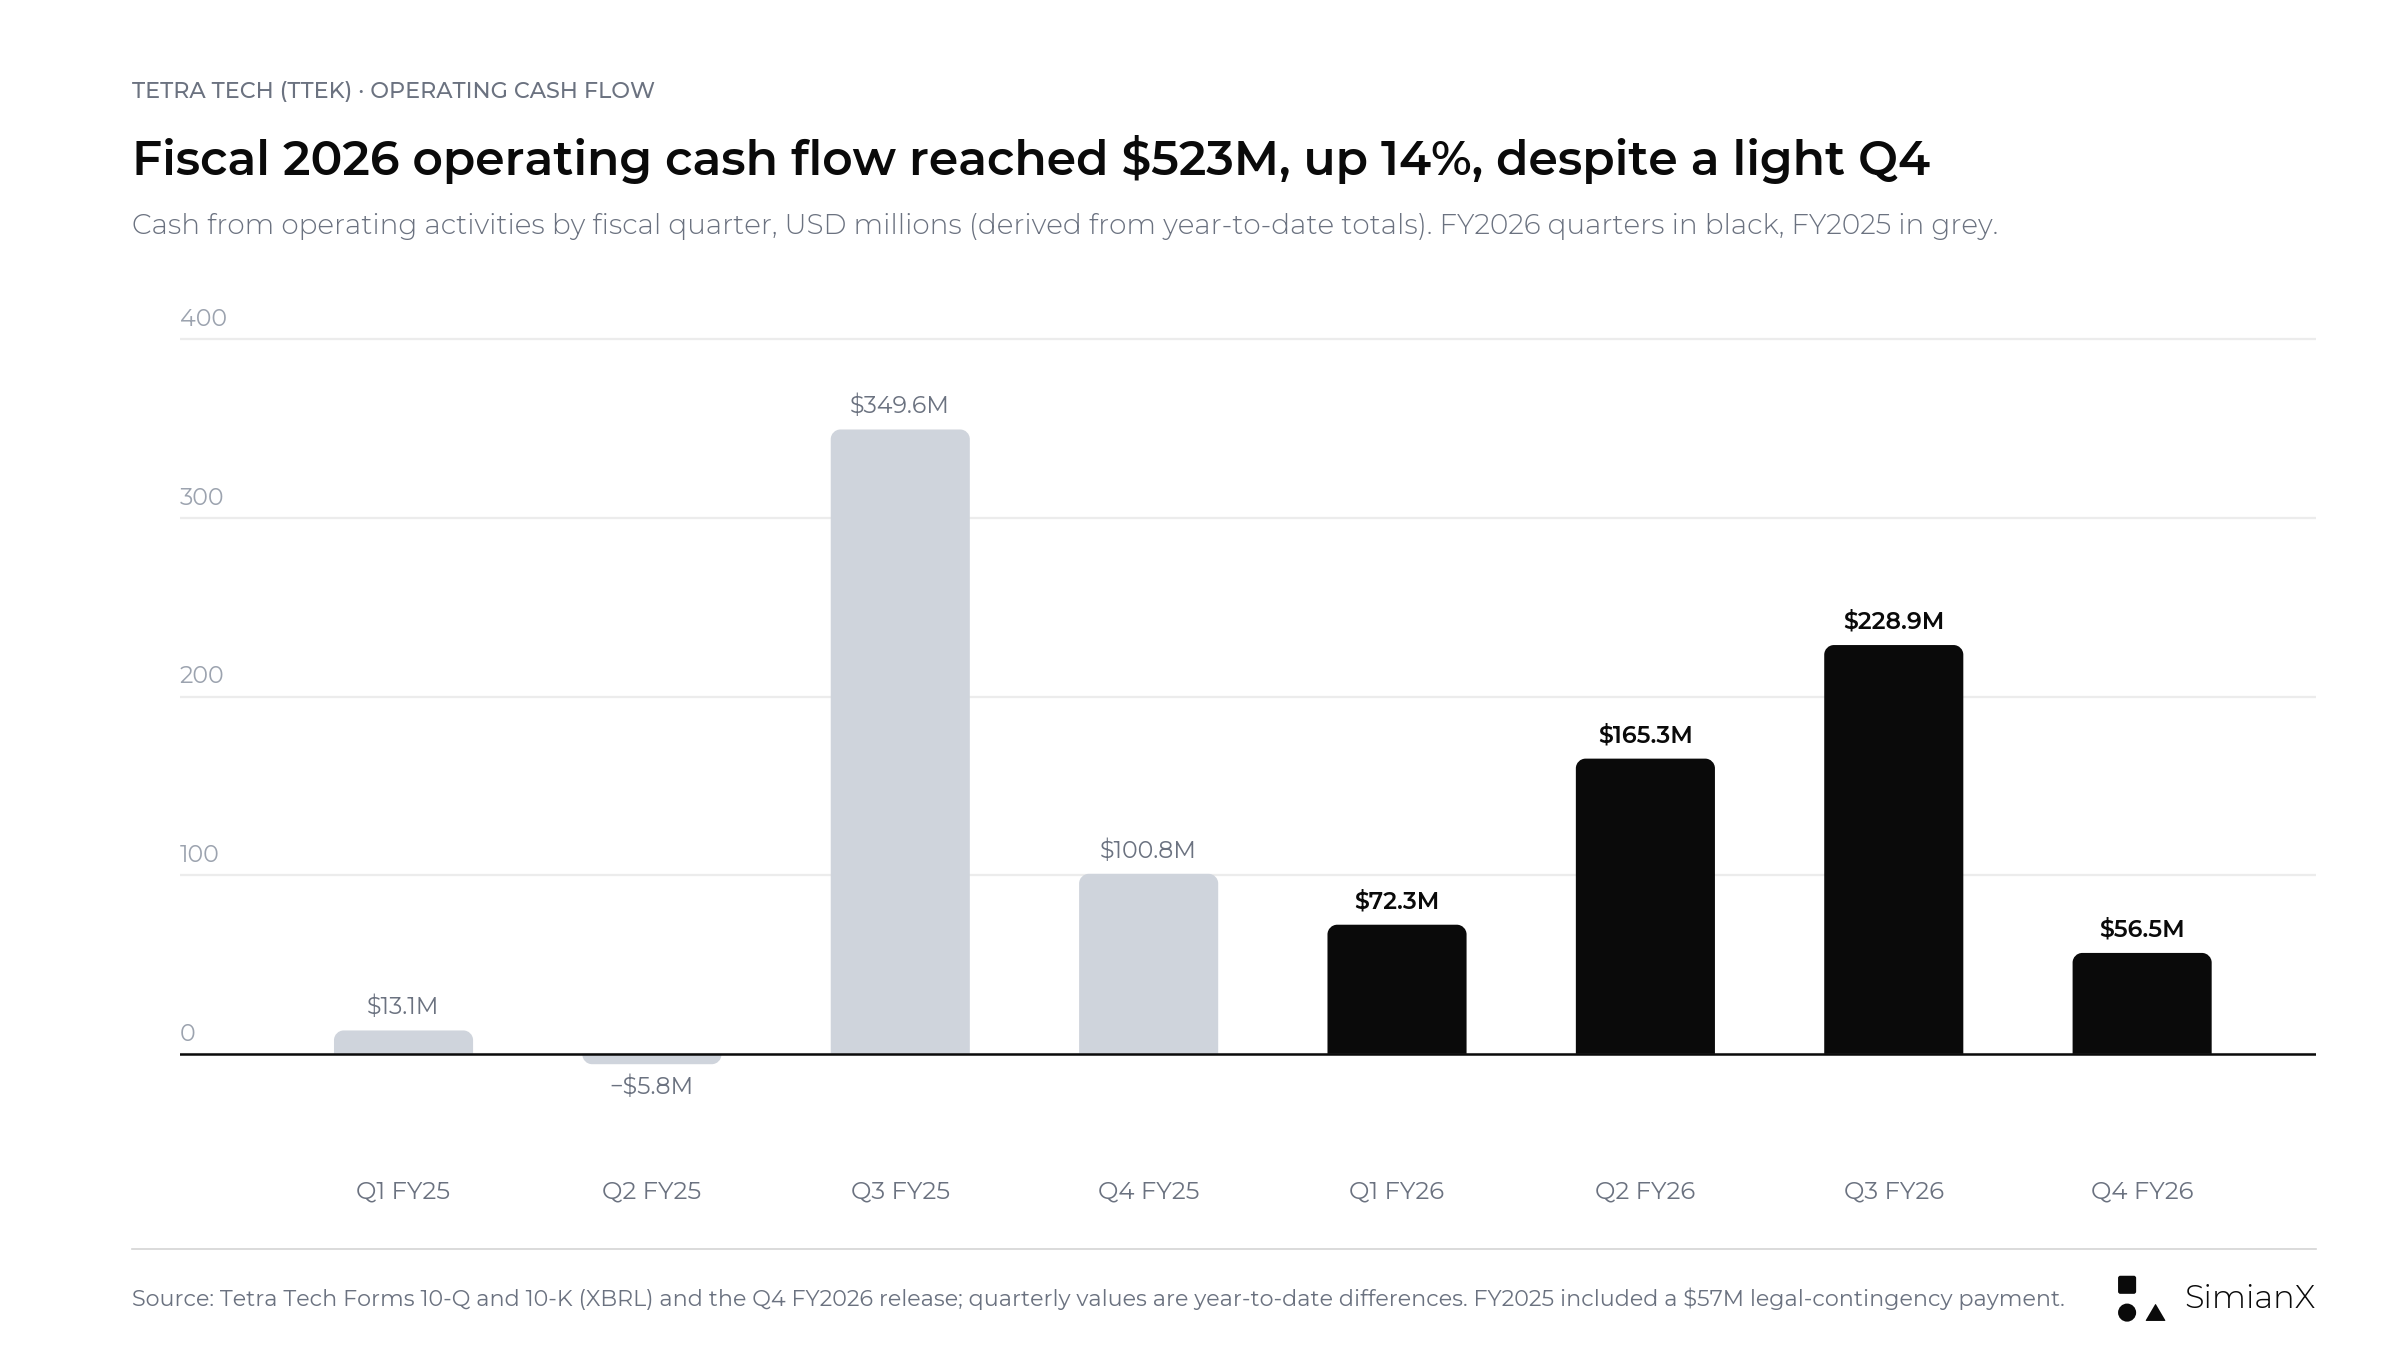
Quarterly operating cash flow is lumpy. Fiscal 2026 rose through Q3, partly on the collection of older receivables, then dropped to about $56.5 million in Q4; the full year was still up 14%.
Collections from legacy work are real cash and improve financial flexibility. However, they should not automatically be projected as recurring cash generation from new business. The next filings should help separate:
- Cash generated by current operating activity.
- Collection of older receivables.
- Changes in payment timing (days sales outstanding was 56 days in Q3, after 51 days in Q1 and 58 days in Q2; the CFO put it at 60 days on the Q4 call).
- Capital expenditure.
- Acquisition spending and financing decisions.
An asset-light model can produce attractive cash conversion. The stronger investment case would show that continuing operations can sustain that conversion after unusual collection benefits fade.
Can Tetra Tech Buybacks Support EPS?
The September 10 capital-allocation announcement expanded the company’s repurchase capacity.
| Capital-allocation measure | Company disclosure |
|---|---|
| Additional repurchase authorization | $500 million |
| Total available authorization after the increase | $898 million |
| Trailing-12-month operating cash flow | $567 million |
| Trailing-12-month buybacks and dividends | $322 million |
| Quarter-end net-debt leverage ratio | 0.88 times |
| Repurchases in the first nine months of fiscal 2026 | $202.0 million ($100 million in Q3) |
| Repurchases in fiscal 2026 | $302.0 million ($100 million in Q4) |
| Remaining authorization at September 27, 2026 | $798 million |
| Quarterly dividend approved July 27, 2026 | $0.072 per share, up 11% year over year |
| Quarterly dividend approved November 9, 2026 | $0.072 per share, up 11% year over year; payable December 11 |
Sources: Tetra Tech’s September 10 announcement, Q3 2026 release, Form 10-Q and Q4 2026 release.
Repurchases can support EPS by reducing the diluted share count, all else equal, and they already have: diluted weighted-average shares were 259.8 million in Q3 FY2026, 1.9% fewer than a year earlier, and 256.7 million in Q4, 2.9% fewer than a year earlier. But an authorization is permission to buy shares, not evidence that the purchases have occurred.
Three distinctions matter. First, EPS growth should be separated into changes in net income and changes in diluted shares. Second, gross repurchases should be assessed alongside equity issuance and share-based compensation. Third, the return on repurchases depends on the price paid. At $39.43 after the report, TTEK trades 7.5% below its 52-week closing high, so each dollar buys far fewer shares than it would have in May.
The Q4 release answered the first follow-up question: $100 million of repurchases in the quarter, leaving $798 million of authorization. The average purchase price, further diluted-share movement and the balance between acquisitions ($191.9 million in fiscal 2026), debt management and capital returns remain worth tracking in the Form 10-K.
The Guidance History Raises the Standard for Fiscal 2027
Management raised or narrowed its full-year outlook after each quarter of fiscal 2026.
| Guidance update | FY2026 net revenue | FY2026 EPS |
|---|---|---|
| Initial, November 12, 2025 | $4.05 billion–$4.25 billion | $1.40–$1.55 |
| After Q1, January 28, 2026 | $4.15 billion–$4.30 billion | $1.46–$1.56 (adjusted) |
| After Q2, April 29, 2026 | $4.25 billion–$4.40 billion | $1.50–$1.58 (adjusted) |
| After Q3, July 29, 2026 | $4.315 billion–$4.365 billion | $1.56–$1.59 (adjusted) |
| Reported, November 11, 2026 | $4.348 billion | $1.60 adjusted; $1.69 GAAP |
Sources: Tetra Tech’s Q4 2025 and Q1, Q2, Q3 and Q4 2026 earnings releases.
The midpoint of EPS guidance moved from $1.475 to $1.575 during the year. The only adjustments in the EPS guidance exclude a gain on the sale of the company’s Norway operations and contingent-consideration changes, so investors should not add quarterly GAAP EPS figures and compare the total with adjusted annual guidance without reconciling the differences.
Before the release, the analyst consensus for fiscal 2027 was $1.74, about 10% above the FY2026 guidance midpoint. When Tetra Tech issued its initial FY2026 range a year ago, it also gave a growth range for net revenue excluding USAID/DOS and disaster work (5% to 11%). The initial fiscal 2027 EPS range of $1.65 to $1.80 has a midpoint of $1.725, just below that consensus, and the release gave no comparable excluded-items growth range. Before the release we listed what a useful fiscal 2027 outlook would address:
- Growth in continuing activities.
- Remaining international-development exposure.
- Acquisition and currency assumptions.
- Project mobilization and staffing.
- Operating profitability.
- Cash conversion and capital deployment.
A headline growth rate would be less informative if the assumptions behind it remained unclear. The release and call covered acquisitions (excluded from guidance), interest and tax assumptions, and expected U.S. federal and U.S. commercial growth. We found no quantified remaining international-development exposure or share-count assumption in the release or the call transcript.
TTEK Stock Reaction to Earnings: 13 Reports Since November 2023
Tetra Tech releases results at or after the close (the Q4 FY2026 release crossed at 4:00 p.m. Eastern), so the reaction shows up in the next session.
| Fiscal quarter | Release (after close) | TTEK next-session move | SPY same session |
|---|---|---|---|
| Q4 FY2023 | November 15, 2023 | +3.5% | +0.1% |
| Q1 FY2024 | January 31, 2024 | +3.9% | +1.3% |
| Q2 FY2024 | May 1, 2024 | +6.1% | +0.9% |
| Q3 FY2024 | July 31, 2024 | +9.0% | −1.4% |
| Q4 FY2024 | November 13, 2024 | −13.5% | −0.6% |
| Q1 FY2025 | January 29, 2025 | −2.9% | +0.5% |
| Q2 FY2025 | May 7, 2025 | +13.0% | +0.7% |
| Q3 FY2025 | July 30, 2025 | −1.1% | −0.4% |
| Q4 FY2025 | November 12, 2025 | +15.3% | −1.7% |
| Q1 FY2026 | January 28, 2026 | +3.0% | −0.2% |
| Q2 FY2026 | April 29, 2026 | +1.4% | +1.0% |
| Q3 FY2026 | July 29, 2026 | −3.9% | +1.7% |
| Q4 FY2026 | November 11, 2026 | +4.8% | −0.4% |
Source: daily closing prices from Polygon.io (split-adjusted for the 5-for-1 split in 2024); release dates from Tetra Tech’s Form 8-K (Item 2.02) earnings releases. Each move is the next session’s close vs the release-day close.
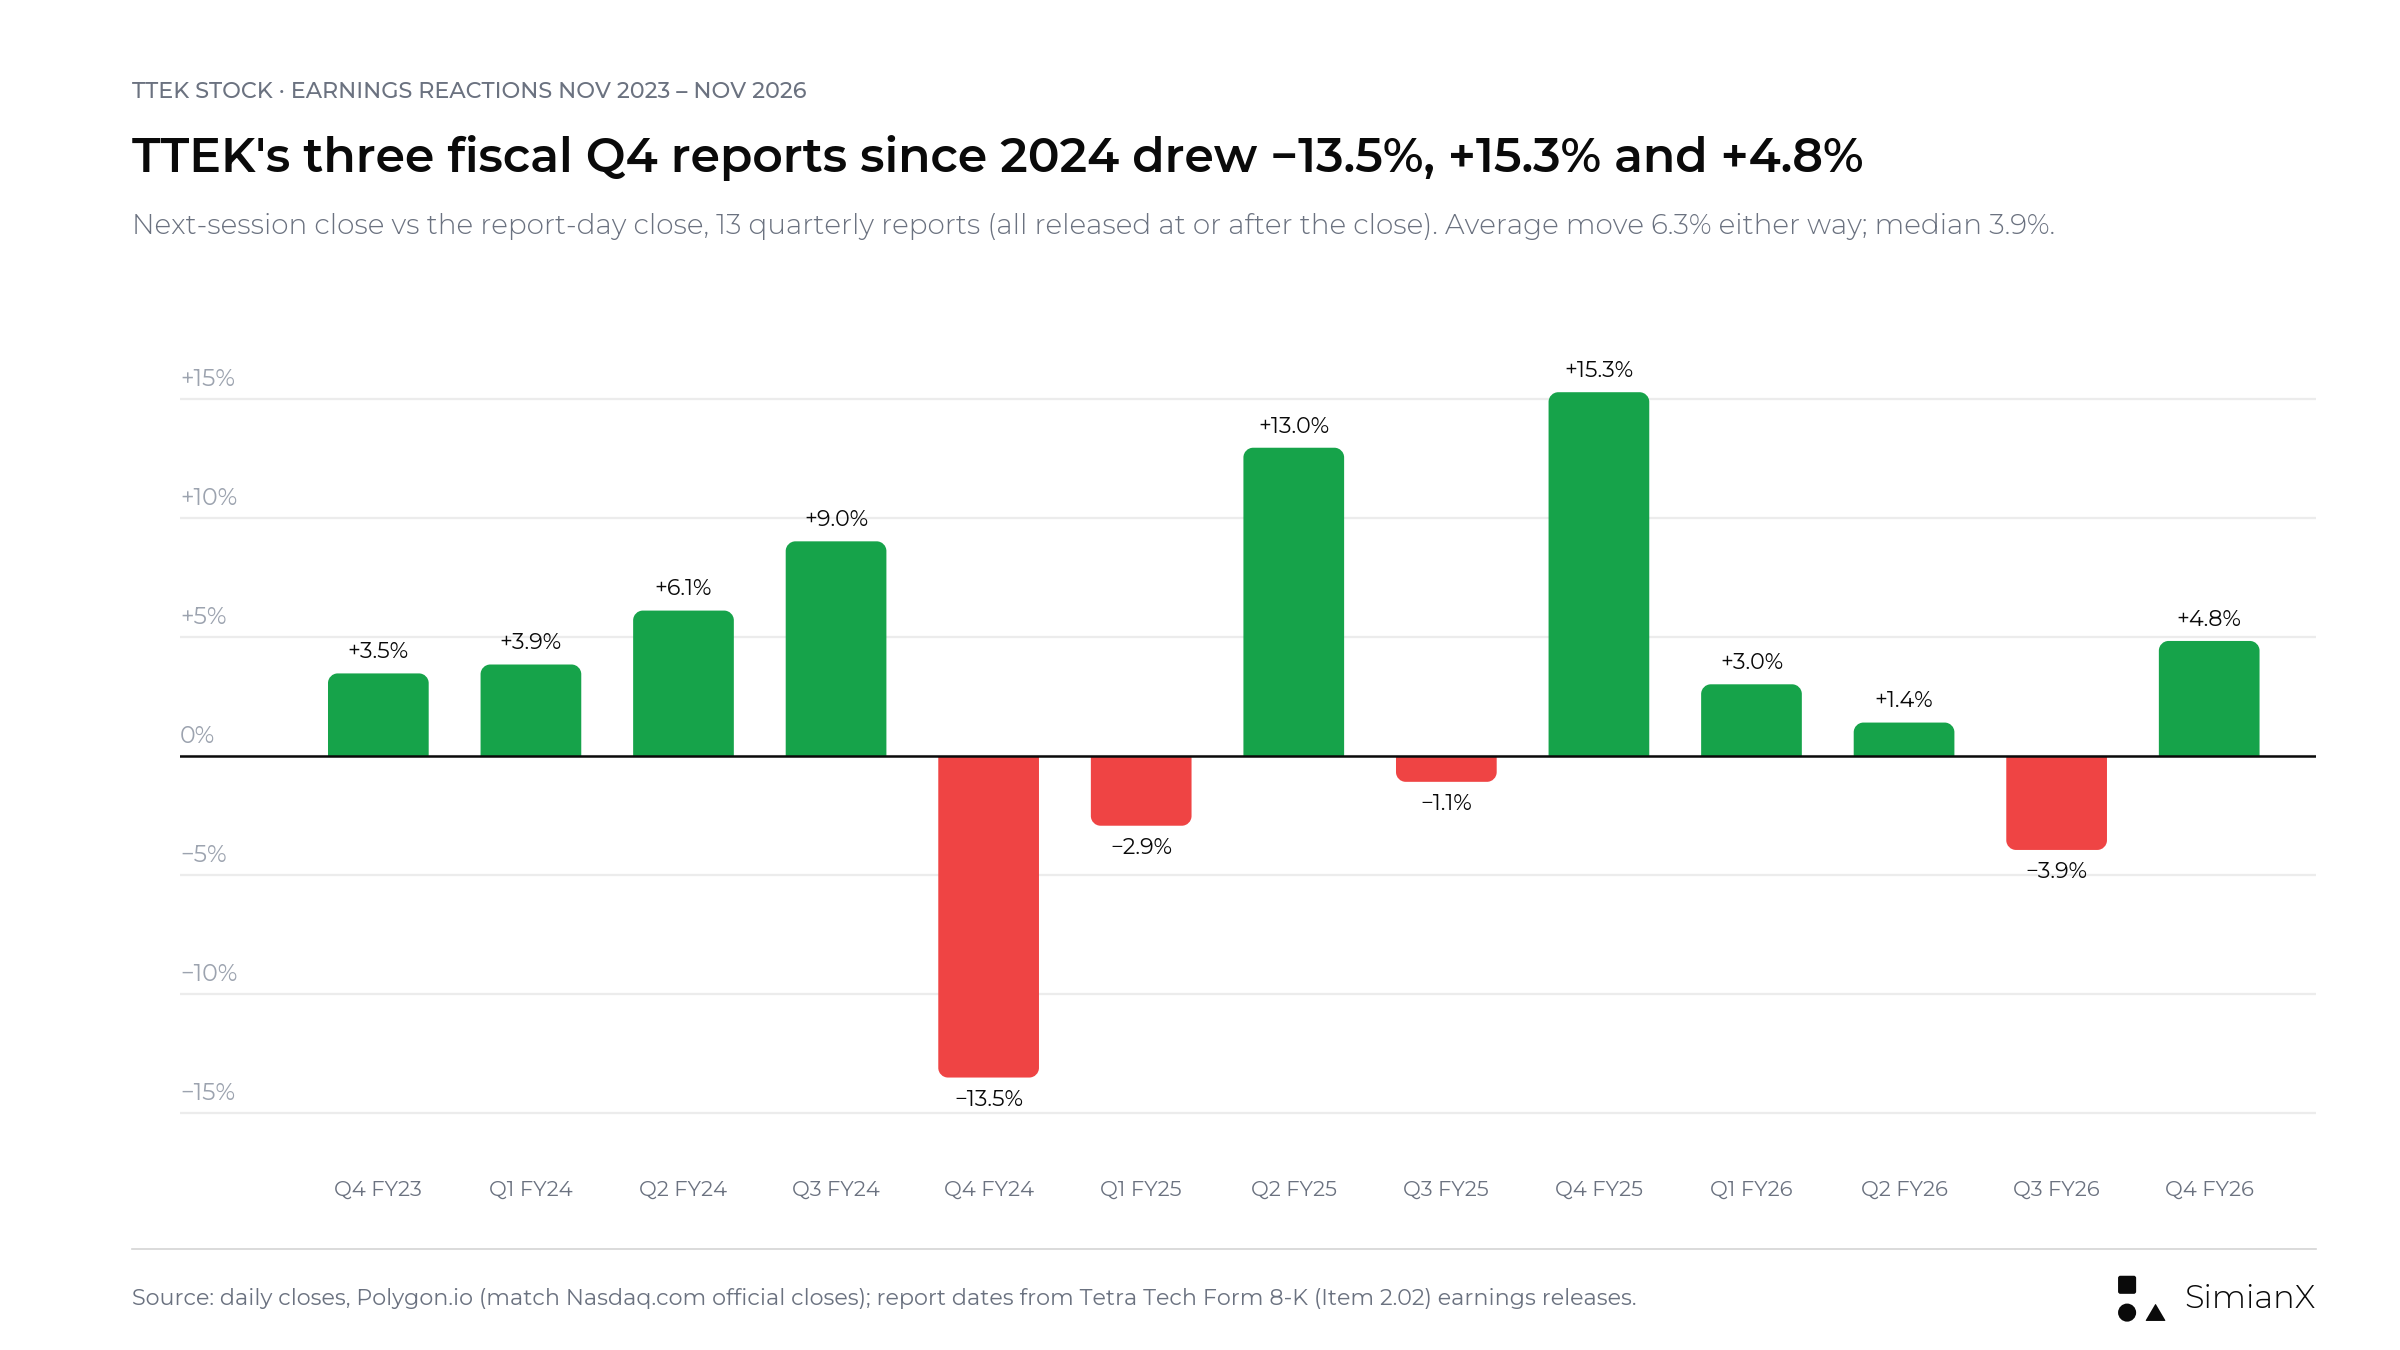
The average move was 6.3% in either direction and the median 3.9%; the stock rose after 9 of the 13 reports.
- Fourth-quarter reports move the stock most. The two largest reactions, −13.5% in November 2024 and +15.3% in November 2025, both followed fiscal Q4 releases, which carry the first guidance for the next year. The November 2026 Q4 report produced a smaller +4.8% move.
- Beats are not enough. The Q3 FY2026 report beat the consensus and raised guidance, yet TTEK fell 3.9% the next day while the S&P 500 ETF rose 1.7%.
- The stock ran into this report, then fell on the day of it. TTEK rose 20.3% from the July 29 close to November 10, against +2.8% for SPY, then fell 7.5% to $37.61 on November 11 on about five times the prior day’s volume, before the 4:00 p.m. release. We found no company announcement that explains that drop. On November 12 the stock opened at $41.375, about 10% higher, and faded to close at $39.43: +4.8% on the day but 3.0% below the November 10 close.
For comparison with another company in the same reporting week, see our D-Wave Q3 2026 earnings page, where a small revenue beat was overshadowed by a wider-than-expected loss.
Scenarios Before the Report, and Where the Results Landed
The following scenarios were set out before the release as qualitative frameworks, not forecasts or price targets.
| Scenario | Evidence in the release and call | Interpretation |
|---|---|---|
| Bull case | Q4 at or above the top of guidance, continuing-business growth at or above 8%, FY2027 guidance at or above the $1.74 consensus | Replacement work is becoming a durable growth engine |
| Base case | Results near guidance with an uneven but manageable transition | Stabilization continues without a decisive acceleration |
| Bear case | Project delays, FY2027 guidance below consensus or cash generation dependent on legacy collections | The order book is not translating into sufficient economic progress |
The results landed between the bull and base cases. Q4 EPS came in above the top of guidance and backlog grew 13%, but growth excluding disaster response was 5% in Q4, the fiscal 2027 EPS midpoint ($1.725) sits slightly below the $1.74 consensus, net-revenue guidance implies about 4% growth at the midpoint, and Q4 operating cash flow was the weakest quarter of the year.
Valuation adds another layer. At the November 12 close of $39.43, TTEK trades at about 24.6 times fiscal 2026 adjusted EPS of $1.60 and about 22.9 times the midpoint of fiscal 2027 EPS guidance ($1.725) (our calculations). Before the release, at $40.65, the multiples were about 25.8 times the FY2026 guidance midpoint ($1.575) and 23.4 times the $1.74 FY2027 consensus. After a 21% rise this year through November 10, expectations going into the report were higher than they were in July. This article does not publish a price target or predict the stock’s next move. To track TTEK’s price and indicators around the report, you can run a live analysis with SimianX AI stock analysis.
Seven Questions for the Earnings Call (Set Before the Release)
- How much growth is organic? Separate continuing-business demand from acquisitions and currency.
- What remains of the international-development reset? Explain the remaining revenue and collection exposure.
- How quickly is backlog converting? Identify project-start timing and major mobilization requirements.
- Which awards are funded? Distinguish contract access from authorized execution.
- Are margins improving through execution or mix? Clarify the contribution of each.
- How repeatable is cash generation? Separate current operations from legacy collections.
- How is capital being deployed? Explain the balance between acquisitions, debt and actual repurchases.
The release and call gave partial answers: growth excluding disaster response (5% in Q4) and excluding USAID/DOS as well (7% for the year), a third straight quarter of book-to-bill above 1.1x, $100 million of Q4 repurchases with $798 million left, and fiscal 2027 guidance that excludes future acquisitions. The release did not say how much of the large new multiple-award contract value is funded.
The strongest answers would include defined measures and comparable periods. Broad statements about a large addressable market would be less useful without a clear link to revenue, profitability and cash.
Frequently Asked Questions
When did Tetra Tech report fiscal Q4 2026 earnings?
Tetra Tech released results at 4:00 p.m. Eastern on Wednesday, November 11, 2026, at the U.S. market close, and held its conference call on Thursday, November 12, at 8:00 a.m. Pacific Time.
Did Tetra Tech beat Q4 FY2026 earnings estimates?
Yes. Adjusted EPS was $0.49 (GAAP EPS $0.51), above the $0.47 consensus and the company’s $0.45 to $0.48 guidance. Net revenue of $1.15 billion was above the midpoint of the $1.12 billion to $1.17 billion range.
What was the TTEK earnings estimate?
Before the release, the Zacks consensus shown on Nasdaq.com was $0.47 per share from two analysts, and Kiplinger’s earnings calendar also listed $0.47. The company’s own guidance was $0.45 to $0.48 of EPS on $1.12 billion to $1.17 billion of net revenue.
What is Tetra Tech’s fiscal 2027 guidance?
EPS of $1.65 to $1.80 and net revenue of $4.425 billion to $4.625 billion. For Q1 FY2027, the company expects EPS of $0.36 to $0.38 on $1.04 billion to $1.08 billion of net revenue. The EPS midpoint, $1.725, is slightly below the $1.74 consensus that stood before the release.
How did Tetra Tech do in Q4 FY2025?
In the quarter ended September 28, 2025, revenue was $1,330.1 million, net revenue $1,163.3 million, EPS $0.48 and adjusted EPS $0.45. The stock rose 15.3% the next day.
Why can Tetra Tech report growth excluding certain activities while total revenue declines?
The measures cover different business bases. Continuing activities grew while the loss of USAID work and lower disaster-response activity reduced the consolidated total. About $85 million of nine-month revenue also came from an acquisition.
Is Tetra Tech’s backlog guaranteed revenue?
No. Backlog provides useful visibility but is not an unconditional receivable. It does not account for termination-for-convenience clauses, which is how the USAID contracts ended. Backlog was $4.67 billion at September 27, 2026.
How much does TTEK usually move on earnings?
Over the last 13 reports, the average next-session move was 6.3% in either direction and the median 3.9%. The two biggest moves came after fiscal Q4 reports; the November 2026 Q4 report produced a +4.8% move.
Can Tetra Tech buybacks support EPS?
Yes, a lower diluted share count can increase EPS if other factors remain unchanged. Tetra Tech bought back $302.0 million of stock in fiscal 2026, and diluted shares fell 2.9% year over year in Q4 FY2026. The actual effect depends on completed purchases, purchase prices and offsetting share issuance.
What matters most for the fiscal 2027 outlook?
Whether continuing demand can support profitable growth and repeatable cash generation. The initial EPS midpoint of $1.725 is close to, but slightly below, the $1.74 consensus, so delivery against the range, starting with Q1 FY2027, matters more than the range itself.
Verdict: Watch Replacement Growth, Not Just the Earnings Beat
Tetra Tech’s next chapter depends on converting technical demand and awarded work into sustainable earnings and cash.
The positive case rests on a broad service opportunity set, an order book that has risen since December 2025 to $4.67 billion of backlog, record full-year EPS, operating cash flow up 14% and meaningful financial flexibility. The counterargument is equally important: excluding disrupted revenue does not replace it, backlog is not guaranteed cash, and legacy collections cannot be assumed to recur.
The most useful earnings scorecard therefore has four parts:
- Demand: Is continuing-business growth supported by new customer activity?
- Conversion: Are awards moving into authorized, productive work?
- Profitability: Does growth generate attractive operating returns?
- Cash: Can current operations sustain collections and capital deployment?
The Q4 report delivered an EPS beat and a stronger order book, and the fiscal 2027 range brackets the consensus without clearly exceeding it. Delivery against these four measures during fiscal 2027 will decide whether Tetra Tech has moved beyond its revenue reset; an EPS beat on its own leaves the central investment question unresolved.
This article provides financial research, not personalized investment advice or a recommendation to buy or sell TTEK.
Related Reading
- Stratasys Earnings by Quarter: Q3 2026 Results and SSYS
- D-Wave Q3 2026 Earnings: $4.5M Revenue Beat, $0.13 Loss Miss
- Constellation Energy Q3 2026 Earnings: $5.06 EPS Beats $3.90
- Airbnb Earnings by Quarter: Q3 2026 Results and ABNB Stock
- ConocoPhillips Earnings by Quarter: Q3 2026 Results and EPS
- McDonald’s Earnings by Quarter: Q3 2026 Results and Comps
- Why Is Caterpillar Stock Down? Q3 2026 Earnings and Backlog
- Government Shutdowns and the Stock Market: 1976–2026
References
- Tetra Tech: Q4 and fiscal 2026 earnings release (Form 8-K, Exhibit 99.1), November 11, 2026
- Tetra Tech via Nasdaq: Q4 and fiscal 2026 results release, published November 11, 2026, 4:00 p.m. Eastern
- The Motley Fool: Tetra Tech Q4 2026 earnings call transcript, November 12, 2026
- Tetra Tech via Nasdaq: Planned dates for fourth-quarter and fiscal 2026 results and conference call, October 21, 2026
- Tetra Tech: earnings-call page
- Tetra Tech: Q3 2026 earnings release (Form 8-K, Exhibit 99.1), July 29, 2026
- Tetra Tech: Form 10-Q for the quarter ended June 28, 2026
- Tetra Tech: Q2 2026 earnings release (Form 8-K, Exhibit 99.1), April 29, 2026
- Tetra Tech: Q1 2026 earnings release (Form 8-K, Exhibit 99.1), January 28, 2026
- Tetra Tech: Q4 and fiscal 2025 earnings release (Form 8-K, Exhibit 99.1), November 12, 2025
- Tetra Tech: Form 10-K for the fiscal year ended September 28, 2025
- Tetra Tech: Q4 and fiscal 2024 earnings release (Form 8-K, Exhibit 99.1), November 13, 2024
- Tetra Tech: $500 million increase to the share-repurchase program (Form 8-K, Exhibit 99.1), September 10, 2026
- Tetra Tech: Dayton PFAS water-treatment facility design, July 21, 2026
- Tetra Tech: FAA $27 million airspace-redesign task order, July 23, 2026
- Tetra Tech: NOAA $49 million multiple-award coastal geospatial contract, August 18, 2026
- Tetra Tech: EPA $16.8 million land-revitalization contract, August 25, 2026
- Nasdaq.com: TTEK earnings date and Zacks consensus
- Kiplinger: Earnings calendar for the week of November 9, 2026
- SEC EDGAR: Tetra Tech, Inc. filing index