
 By Marcus Reeve
Pokémon Card Prices vs the Stock Market: What the Data Show Since 2021
Are Pokémon cards beating the S&P 500? We tracked a fixed basket of 20 Pokémon cards and sealed products every month, using public sold-price data from PriceCharting, and compared it with the S&P 500, the Nasdaq-100, Bitcoin and the listed companies behind the trading card game. All figures are as of the November 16, 2026 close unless a different date is stated. This is a data study. It is not a recommendation to buy or sell anything.
Quick answer (as of Nov 16, 2026)
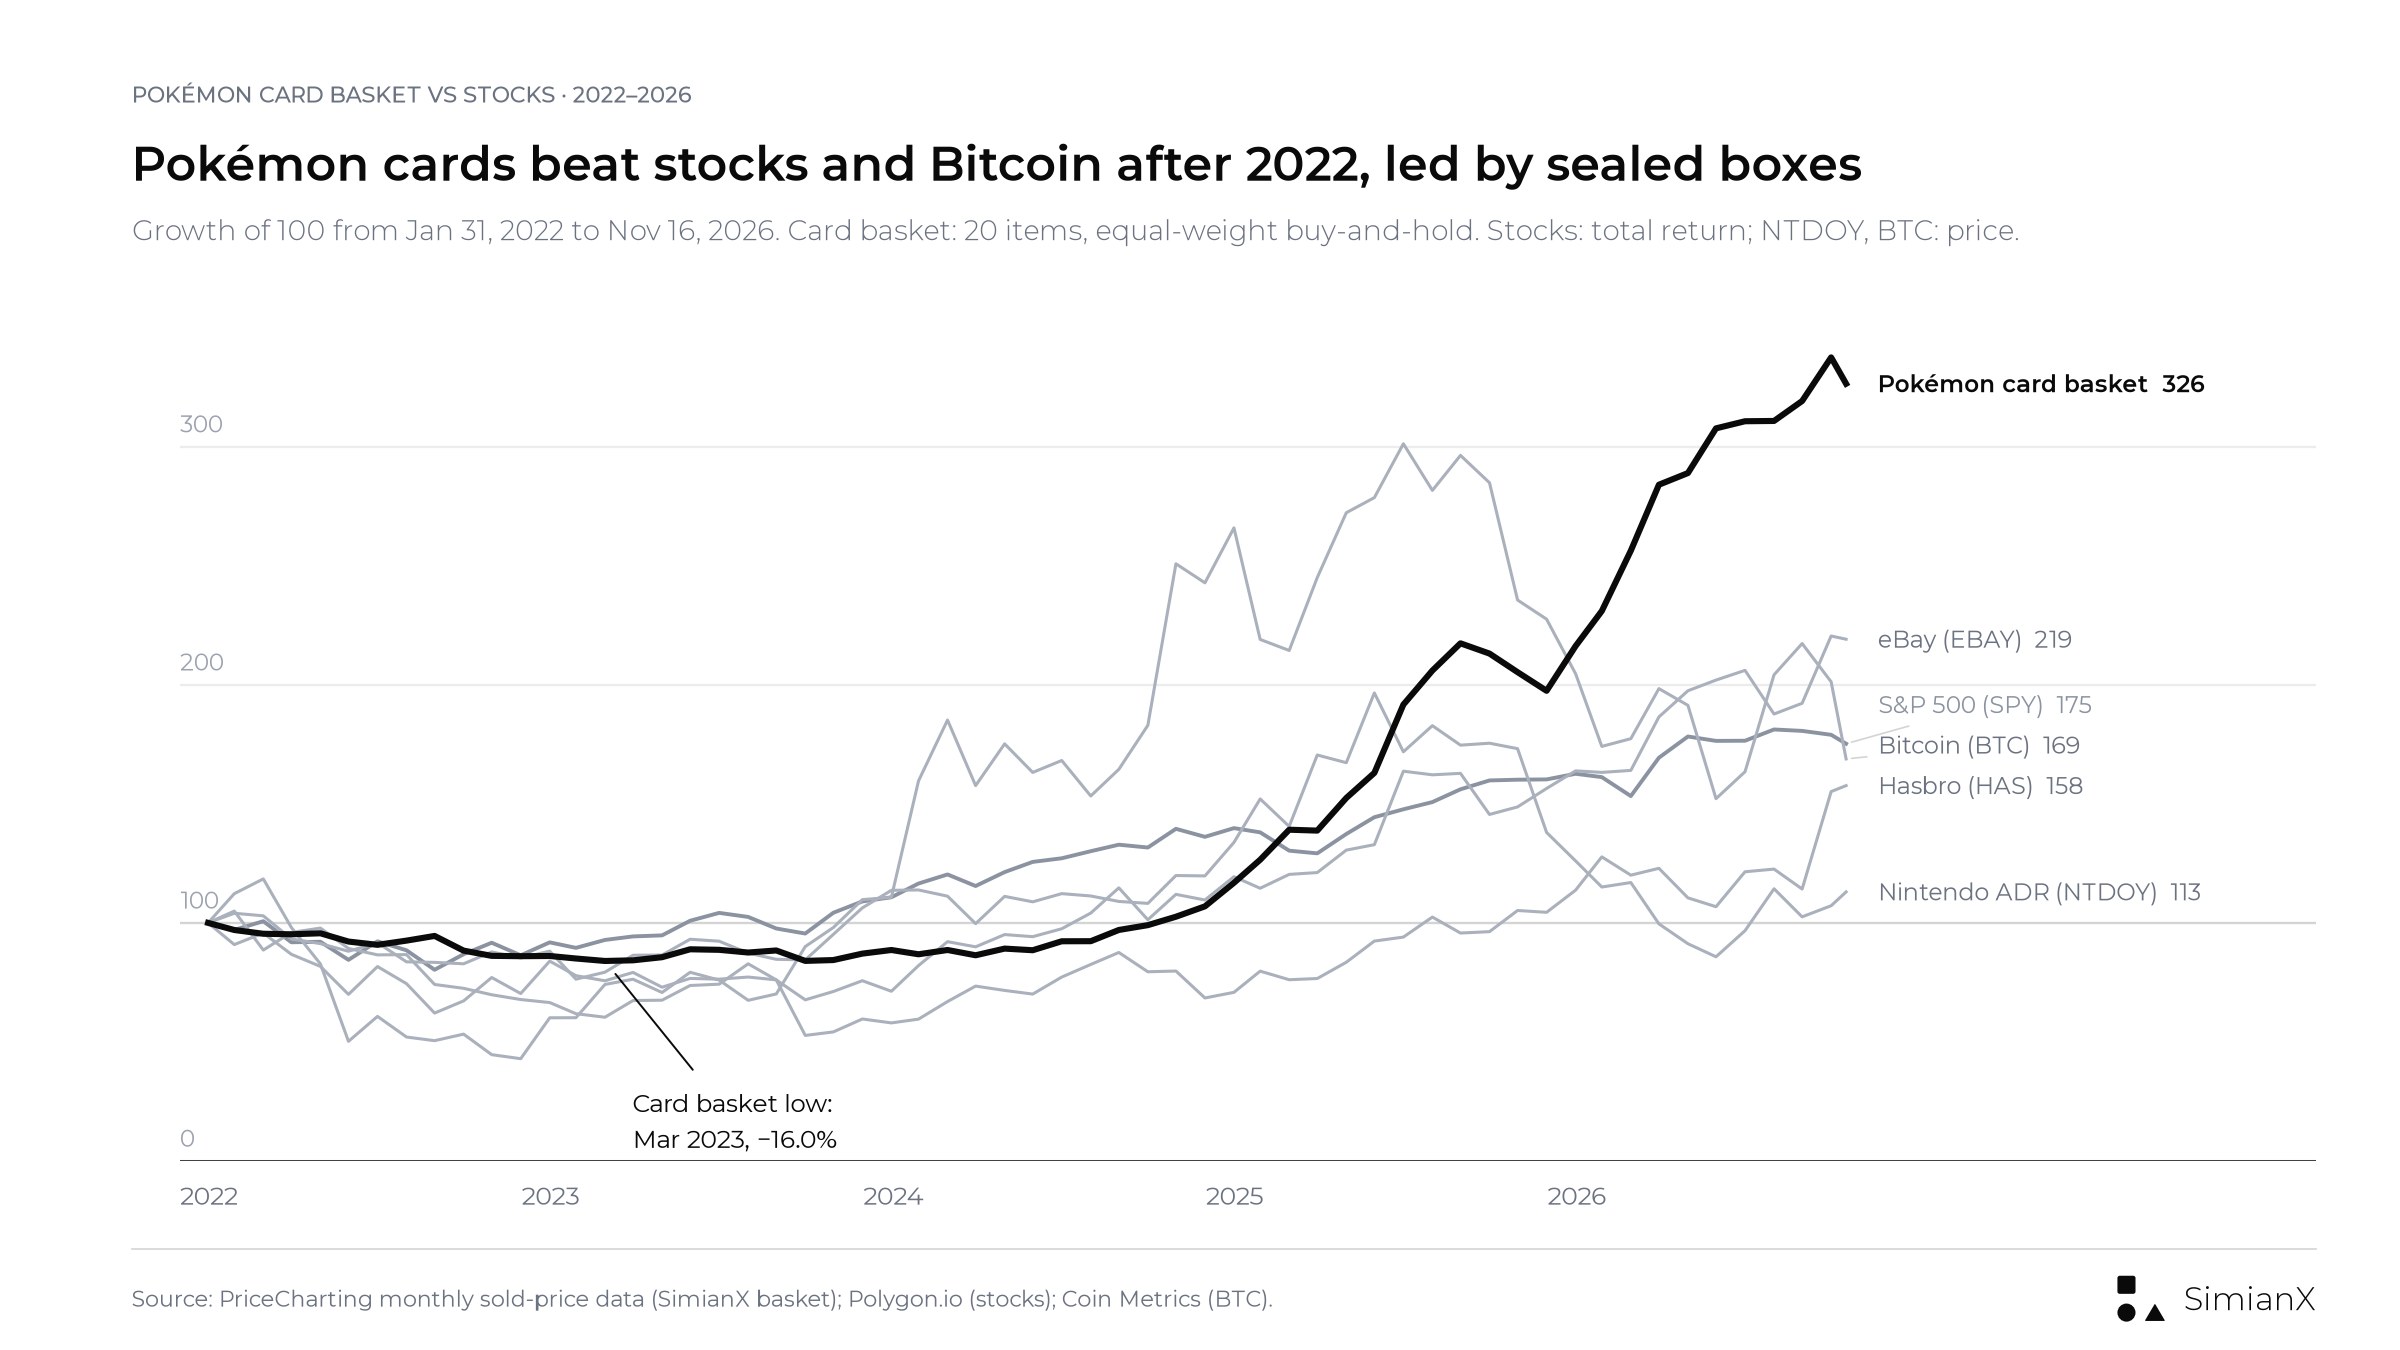
- Since January 31, 2022, our 20-item Pokémon card basket rose +226.4%. Over the same period the S&P 500 (SPY, with dividends) returned +75.2% and Bitcoin +68.8%.
- The gain is narrow. Five sealed products rose +569.4%, while vintage graded cards rose +114.9% and modern graded cards +108.9%. One item, a 2019 Team Up booster box, produced 44% of the basket's gain.
- The timing decides the result. Measured from February 2021, near the last card boom, 15 graded cards are up only +52.4%, against +110.1% for the S&P 500. They fell 60.9% and needed 61 months to get back above their March 2021 high.
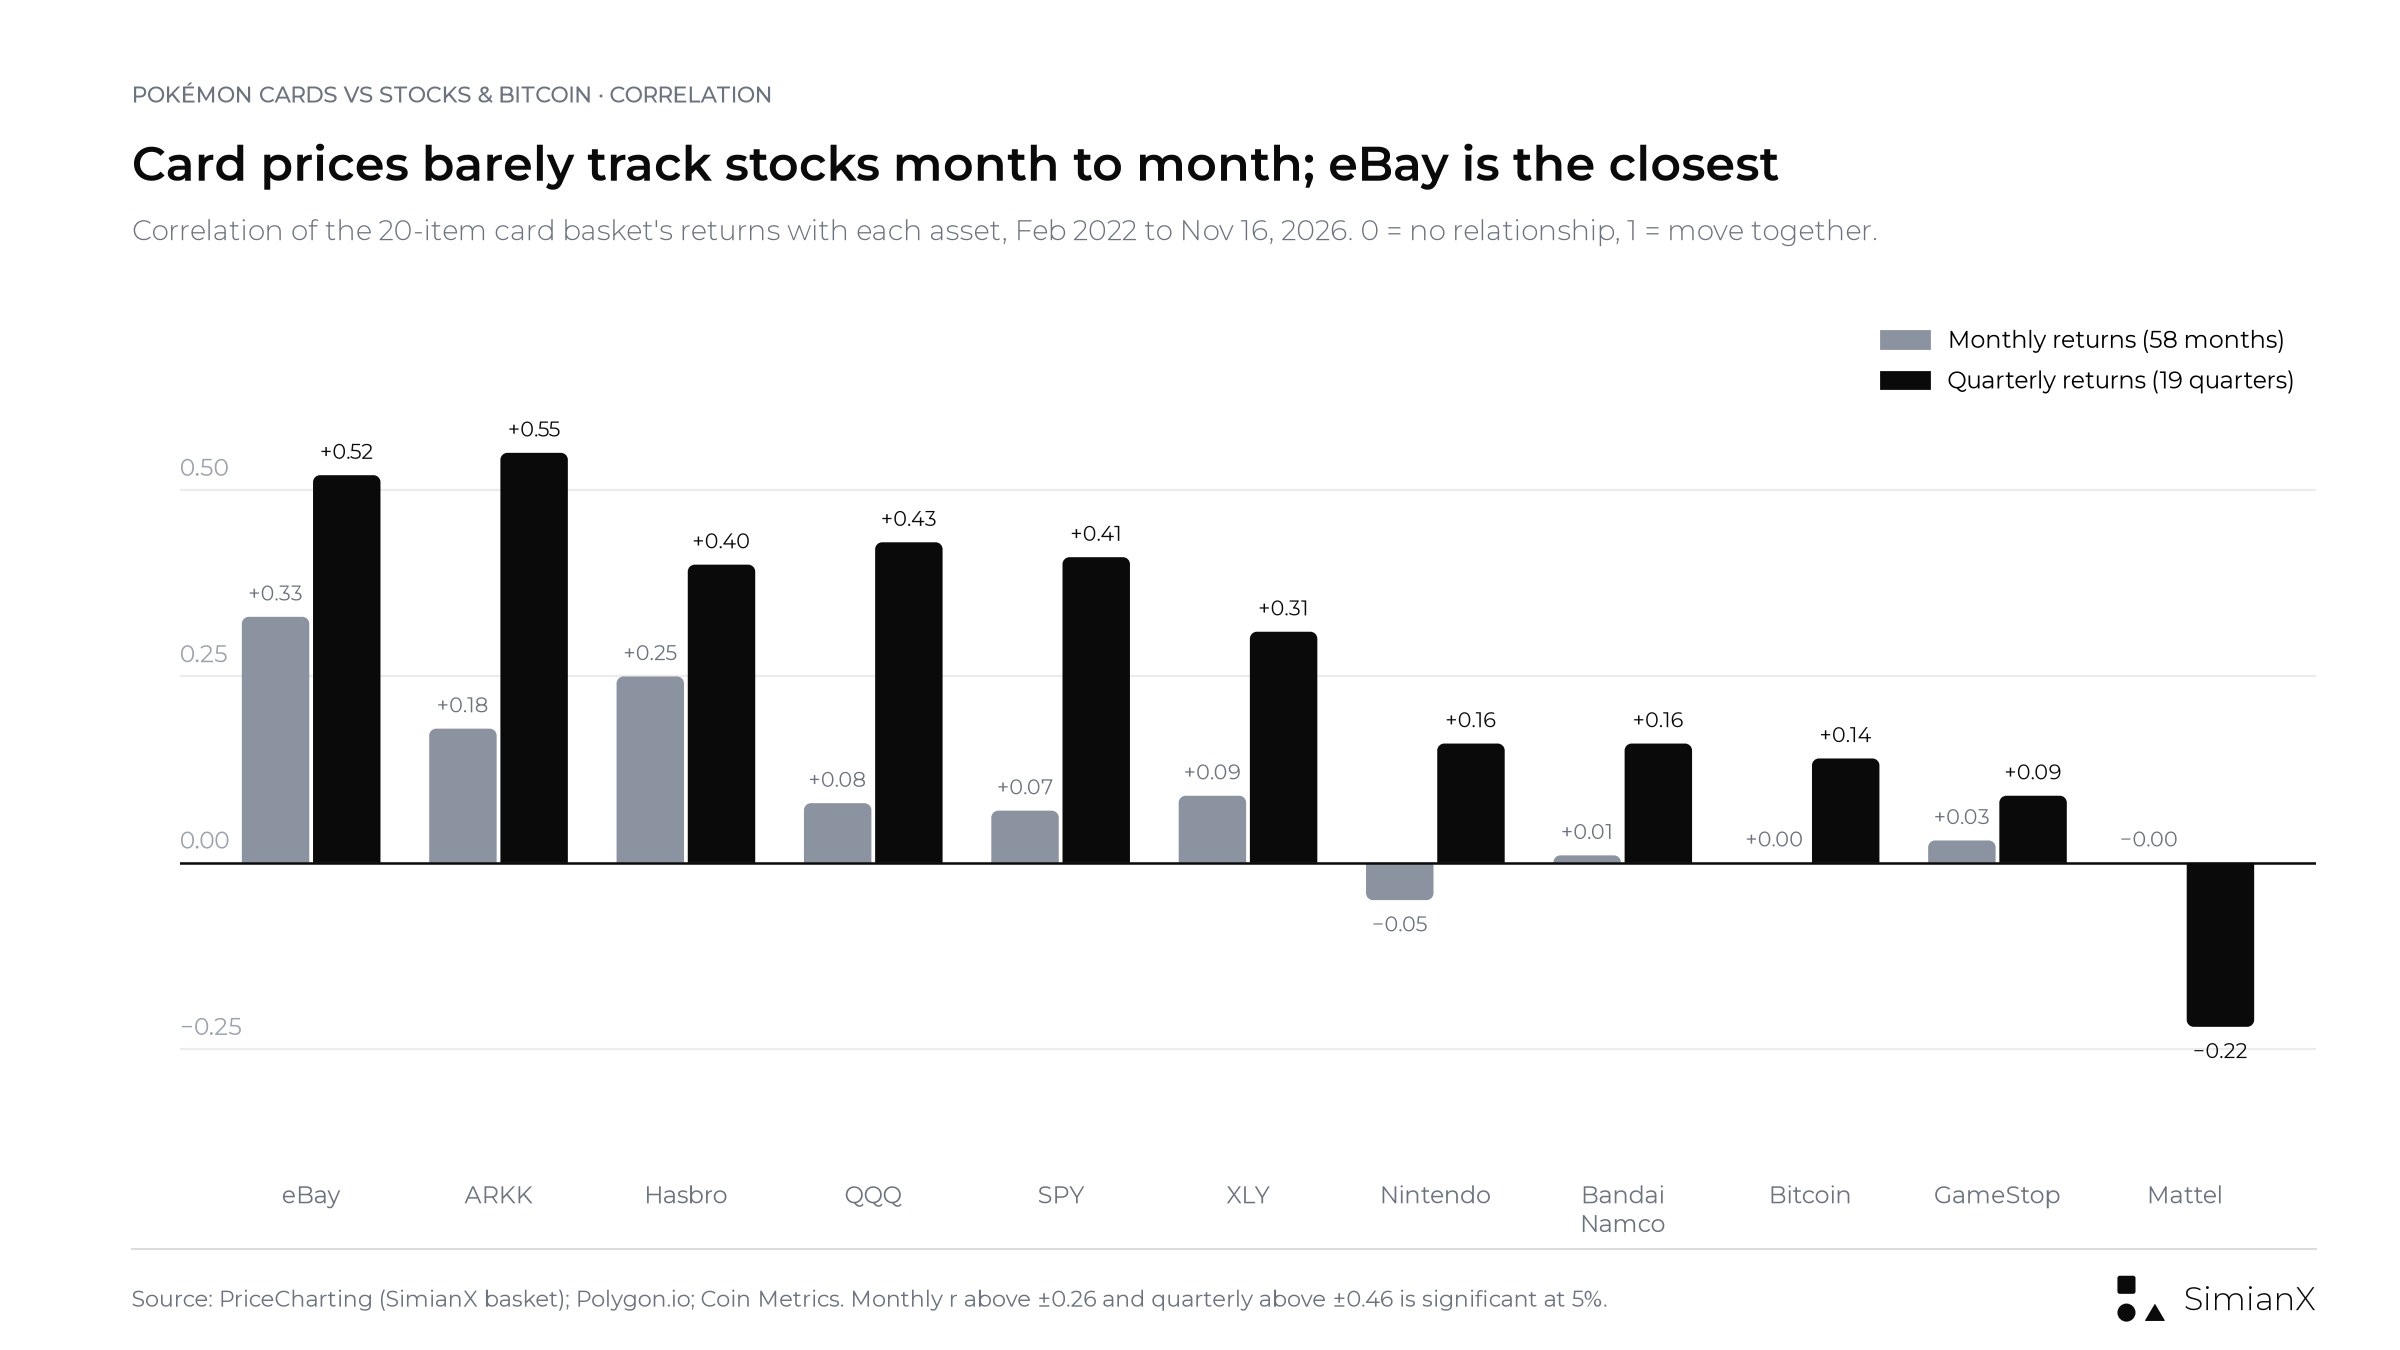
- Cards barely move with stocks month to month. The monthly correlation is 0.07 with the S&P 500 and 0.00 with Bitcoin. eBay has the strongest link, at 0.33.
- Index returns are not investor returns. Marketplace fees, grading costs, spreads and shipping can take a large share of a card's gain, and an index pays none of them.
Pokémon cards vs the S&P 500: the scoreboard since 2022
The table starts on January 31, 2022. That is the first month-end at which all 20 items in the basket have clean price data, and it is also just before the 2022 bear market in stocks. Stocks and ETFs are shown as total return with dividends reinvested. The Nintendo and Bandai Namco ADRs and Bitcoin are shown as price change in US dollars.
| Asset | Total return | Annualized | Max drawdown (month-end) | Peak → trough | Back above peak |
|---|---|---|---|---|---|
| SimianX Pokémon card basket (20 items) | +226.4% | +28.0% | −16.0% | Jan 2022 → Mar 2023 | Nov 2024 |
| Sealed products (5) | +569.4% | +48.7% | −8.1% | Aug 2025 → Dec 2025 | Feb 2026 |
| Vintage graded, Grade 9 (8) | +114.9% | +17.3% | −26.4% | May 2022 → Nov 2023 | Feb 2025 |
| Modern graded, PSA 10 (7) | +108.9% | +16.6% | −40.3% | Jan 2022 → Oct 2023 | Jun 2025 |
| S&P 500 (SPY, total return) | +75.2% | +12.4% | −20.2% | Mar 2022 → Sep 2022 | Jun 2023 |
| Nasdaq-100 (QQQ, total return) | +87.4% | +14.0% | −26.1% | Jan 2022 → Dec 2022 | Jun 2023 |
| Consumer Discretionary (XLY, total return) | +33.0% | +6.1% | −29.7% | Mar 2022 → Dec 2022 | Feb 2024 |
| eBay (EBAY, total return) | +119.1% | +17.8% | −37.9% | Jan 2022 → Sep 2022 | Aug 2024 |
| Bandai Namco ADR (NCBDY, price) | +87.7% | +14.0% | −36.5% | Jun 2025 → May 2026 | Sep 2026 |
| Hasbro (HAS, total return) | +57.7% | +10.0% | −49.7% | Feb 2022 → Oct 2023 | Nov 2025 |
| Bitcoin (BTC, price) | +68.8% | +11.6% | −63.7% | Mar 2022 → Dec 2022 | Feb 2024 |
| Nintendo ADR (NTDOY, price) | +13.0% | +2.6% | −56.4% | Jun 2025 → Jun 2026 | Not yet |
| ARK Innovation (ARKK, total return) | −5.1% | −1.1% | −58.6% | Jan 2022 → Dec 2022 | Sep 2025 |
| GameStop (GME) | −6.0% | −1.3% | −73.4% | Mar 2022 → Apr 2024 | Not yet |
| Mattel (MAT) | −27.2% | −6.4% | −49.6% | May 2022 → Sep 2026 | Not yet |
| Funko (FNKO) | −60.4% | −17.6% | −88.1% | Jul 2022 → Oct 2025 | Not yet |
Window: Jan 31, 2022 to Nov 16, 2026 (4.79 years). Drawdowns use month-end values, so intra-month lows are deeper. "Back above peak" is the first month-end above the pre-drawdown high.
On paper the basket beat every stock benchmark and Bitcoin. The S&P 500's own year-by-year record is in our S&P 500 returns by year table, and Bitcoin's is in the Bitcoin returns by year table. The rest of this page tests whether the card result holds up.
How we built the Pokémon card index (methodology)
There is no free, official, long-history Pokémon card index, so we built a transparent one. These are the rules.
- Source. Each item's monthly price comes from the public chart on its PriceCharting product page. PriceCharting says it combines sold listings from eBay and its own marketplace into one value per item and condition. Each monthly point is frozen at the end of its month. We checked this against archived copies of the same pages from February, June and October 2021 on the Internet Archive, and the completed months matched exactly. November 2026 is the live value we read on November 16, 2026.
- History limit. PriceCharting's Pokémon card history only starts in December 2020. An archived copy from February 24, 2021 shows just three monthly points. That is why this study cannot go back to 2016. Any long-run card chart that starts before 2020 is using a different, often private, data set.
- Items. Twenty items were fixed in advance across three sleeves:
- eight vintage cards from 1999–2000 at Grade 9;
- seven modern cards from 2016–2020 at PSA 10;
- five sealed products: booster boxes, an Elite Trainer Box and a 1999 booster pack.
Every item was a headline item of its set and already existed in 2020.
- Weighting. Equal-weight buy-and-hold. Each item gets the same dollar amount at the base month, and there is no rebalancing. The index level is the average of each item's price relative to its base-month price.
- Base dates. The full basket starts at January 2022 = 100, the first month all 20 items have clean data. Several sealed series begin in mid-2021 with obvious start-up errors, such as a $101 Team Up booster box. A graded-only index of 15 cards starts at February 2021 = 100, so it captures the 2021 peak.
- Comparisons. Stock prices are from Polygon.io and are split-adjusted. We added dividends from Polygon's dividend records to get total return. We spot-checked 99 closes against Nasdaq.com and found no gap above 0.5% (the largest was 0.00%). Bitcoin is the Coin Metrics reference rate, checked against Bitfinex daily closes. Three of 73 month-start checks differed by 0.51–0.79%: August 1, 2023, May 1, 2024 and March 1, 2025.
| Sleeve | Item (set, year, grade) | Jan 31, 2022 | Nov 16, 2026 | Change | Typical sales volume |
|---|---|---|---|---|---|
| Sealed | Team Up booster box (2019) | $621.50 | $13,093.86 | +2,006.8% | 1 per week |
| Modern | Charizard #11, Evolutions (2016), PSA 10 | $1,973.05 | $10,181.50 | +416.0% | 1 per week |
| Sealed | Evolutions booster box (2016) | $706.85 | $3,281.00 | +364.2% | 1 per day |
| Sealed | Hidden Fates Elite Trainer Box (2019) | $136.96 | $507.06 | +270.2% | 2 per day |
| Modern | Rayquaza #138, Vivid Voltage (2020), PSA 10 | $65.60 | $217.75 | +231.9% | 2 per day |
| Vintage | Dark Charizard #4, Team Rocket (2000), Grade 9 | $303.89 | $875.00 | +187.9% | 1 per day |
| Vintage | Mewtwo #10, Base Set (1999), Grade 9 | $150.00 | $380.00 | +153.3% | 1 per day |
| Modern | Umbreon GX SV69, Hidden Fates (2019), PSA 10 | $219.55 | $551.72 | +151.3% | 2 per day |
| Vintage | Charizard #4, Base Set (1999), Grade 9 | $1,301.00 | $3,189.22 | +145.1% | 1 per day |
| Sealed | Vivid Voltage booster box (2020) | $125.00 | $296.32 | +137.1% | 1 per day |
| Vintage | Lugia #9, Neo Genesis (2000), Grade 9 | $1,045.57 | $2,404.75 | +130.0% | 2 per week |
| Vintage | Charizard #4 Shadowless, Base Set (1999), Grade 9 | $5,000.00 | $10,685.55 | +113.7% | 1 per week |
| Sealed | Base Set booster pack (1999) | $480.17 | $810.05 | +68.7% | 4 per day |
| Vintage | Pikachu #58, Base Set (1999), Grade 9 | $31.99 | $53.82 | +68.2% | 1 per day |
| Vintage | Blastoise #2, Base Set (1999), Grade 9 | $471.48 | $793.07 | +68.2% | 1 per day |
| Modern | Charizard GX SV49, Hidden Fates (2019), PSA 10 | $846.00 | $1,330.77 | +57.3% | 1 per day |
| Vintage | Venusaur #15, Base Set (1999), Grade 9 | $335.00 | $510.30 | +52.3% | 1 per day |
| Modern | Charizard V #79, Champion's Path (2020), PSA 10 | $385.00 | $363.00 | −5.7% | 1 per day |
| Modern | Charizard VMAX #74, Champion's Path (2020), PSA 10 | $487.13 | $301.85 | −38.0% | 2 per day |
| Modern | Pikachu VMAX #188, Vivid Voltage (2020), PSA 10 | $604.98 | $299.17 | −50.5% | 2 per day |
Prices are PriceCharting month-end estimates; Nov 16, 2026 is the live value that day. "Grade 9" is PriceCharting's Grade 9 price. "PSA 10" is its PSA-only price, which it lists separately from BGS, CGC and SGC 10s. Volume is PriceCharting's displayed sales rate for that grade on Nov 16, 2026.
The median item rose +133.5%, and 17 of 20 were up. Three things in the table matter more than the headline.
- The winners are the least liquid items. The three biggest gainers each trade about once a week, so a single sale can move their estimate.
- The 2020 "chase" cards lost. Champion's Path and Vivid Voltage PSA 10s, the most hyped cards of late 2020, are the only items down.
- The basket is concentrated. Without the Team Up booster box, the basket gain falls from +226.4% to +132.7%. That is still ahead of the S&P 500's +75.2%, but by far less.
Did the 2021 Pokémon card boom peak with GameStop, ARKK and Bitcoin?
Partly. Cards peaked with the speculative stocks of early 2021, not with the broad market.
We took every series in the 15 graded cards that has data from January 2021 or earlier, across all six grades from ungraded to PSA 10. That gives 44 price series. For each one we found its highest month-end between December 2020 and December 2022.
- 22 of 44 (50%) peaked in February or March 2021.
- 35 of 44 (80%) peaked between January and April 2021.
- None peaked after August 2021.
The 15-card graded index itself topped in March 2021 at 108.7, with February 2021 = 100. By December 2021 it had fallen to 58.1, while US stocks were still making new highs.
| Asset | 2020–2022 closing high | Gap to the card top (Feb–Mar 2021) |
|---|---|---|
| GameStop (GME) | Jan 27, 2021 | 1–2 months before |
| ARK Innovation (ARKK) | Feb 12, 2021 | Same month |
| Pokémon cards (44 series) | Feb 2021 (median month) | — |
| Bitcoin, first 2021 high | Apr 13, 2021 | ~1 month after |
| eBay (EBAY) | Oct 22, 2021 | 7–8 months after |
| Bitcoin, cycle high | Nov 8, 2021 | 8–9 months after |
| Nasdaq-100 (QQQ) | Nov 19, 2021 | 8–9 months after |
| S&P 500 (SPY) | Jan 3, 2022 | 10–11 months after |
| Hasbro (HAS) | Jan 4, 2022 | 10–11 months after |
Daily closing prices from Polygon.io (split-adjusted) and Coin Metrics. The card top is month-end data.
The card top fits the stimulus-era, retail-driven mania of January–February 2021, the same weeks as the GameStop short squeeze and ARKK's peak. It came months before the S&P 500 and Nasdaq topped. Cards behaved like a meme asset, not a stock-market proxy. A caveat: the series start in December 2020, so we cannot see how high cards ran during 2020 itself.
The 2022–2023 Pokémon card market crash: later and longer than stocks
The card drawdown was deep, and it was out of step with the stock market.
- Stocks bottomed first. The S&P 500's month-end low came in September 2022. Bitcoin and the Nasdaq-100 made theirs in December 2022, the month after the FTX collapse.
- Cards kept falling for another 10–14 months. The 20-item basket bottomed in March 2023 at −16.0%. Graded singles did not bottom until October 2023 for modern cards and November 2023 for vintage. Base Set Charizard at Grade 9 fell from $2,389.76 in February 2021 to $874.05 in November 2023, a drop of 63.4%.
- Hasbro bottomed in the same month as graded cards, October 2023. That is a coincidence of timing, not proof of a link; Hasbro had its own problems that year.
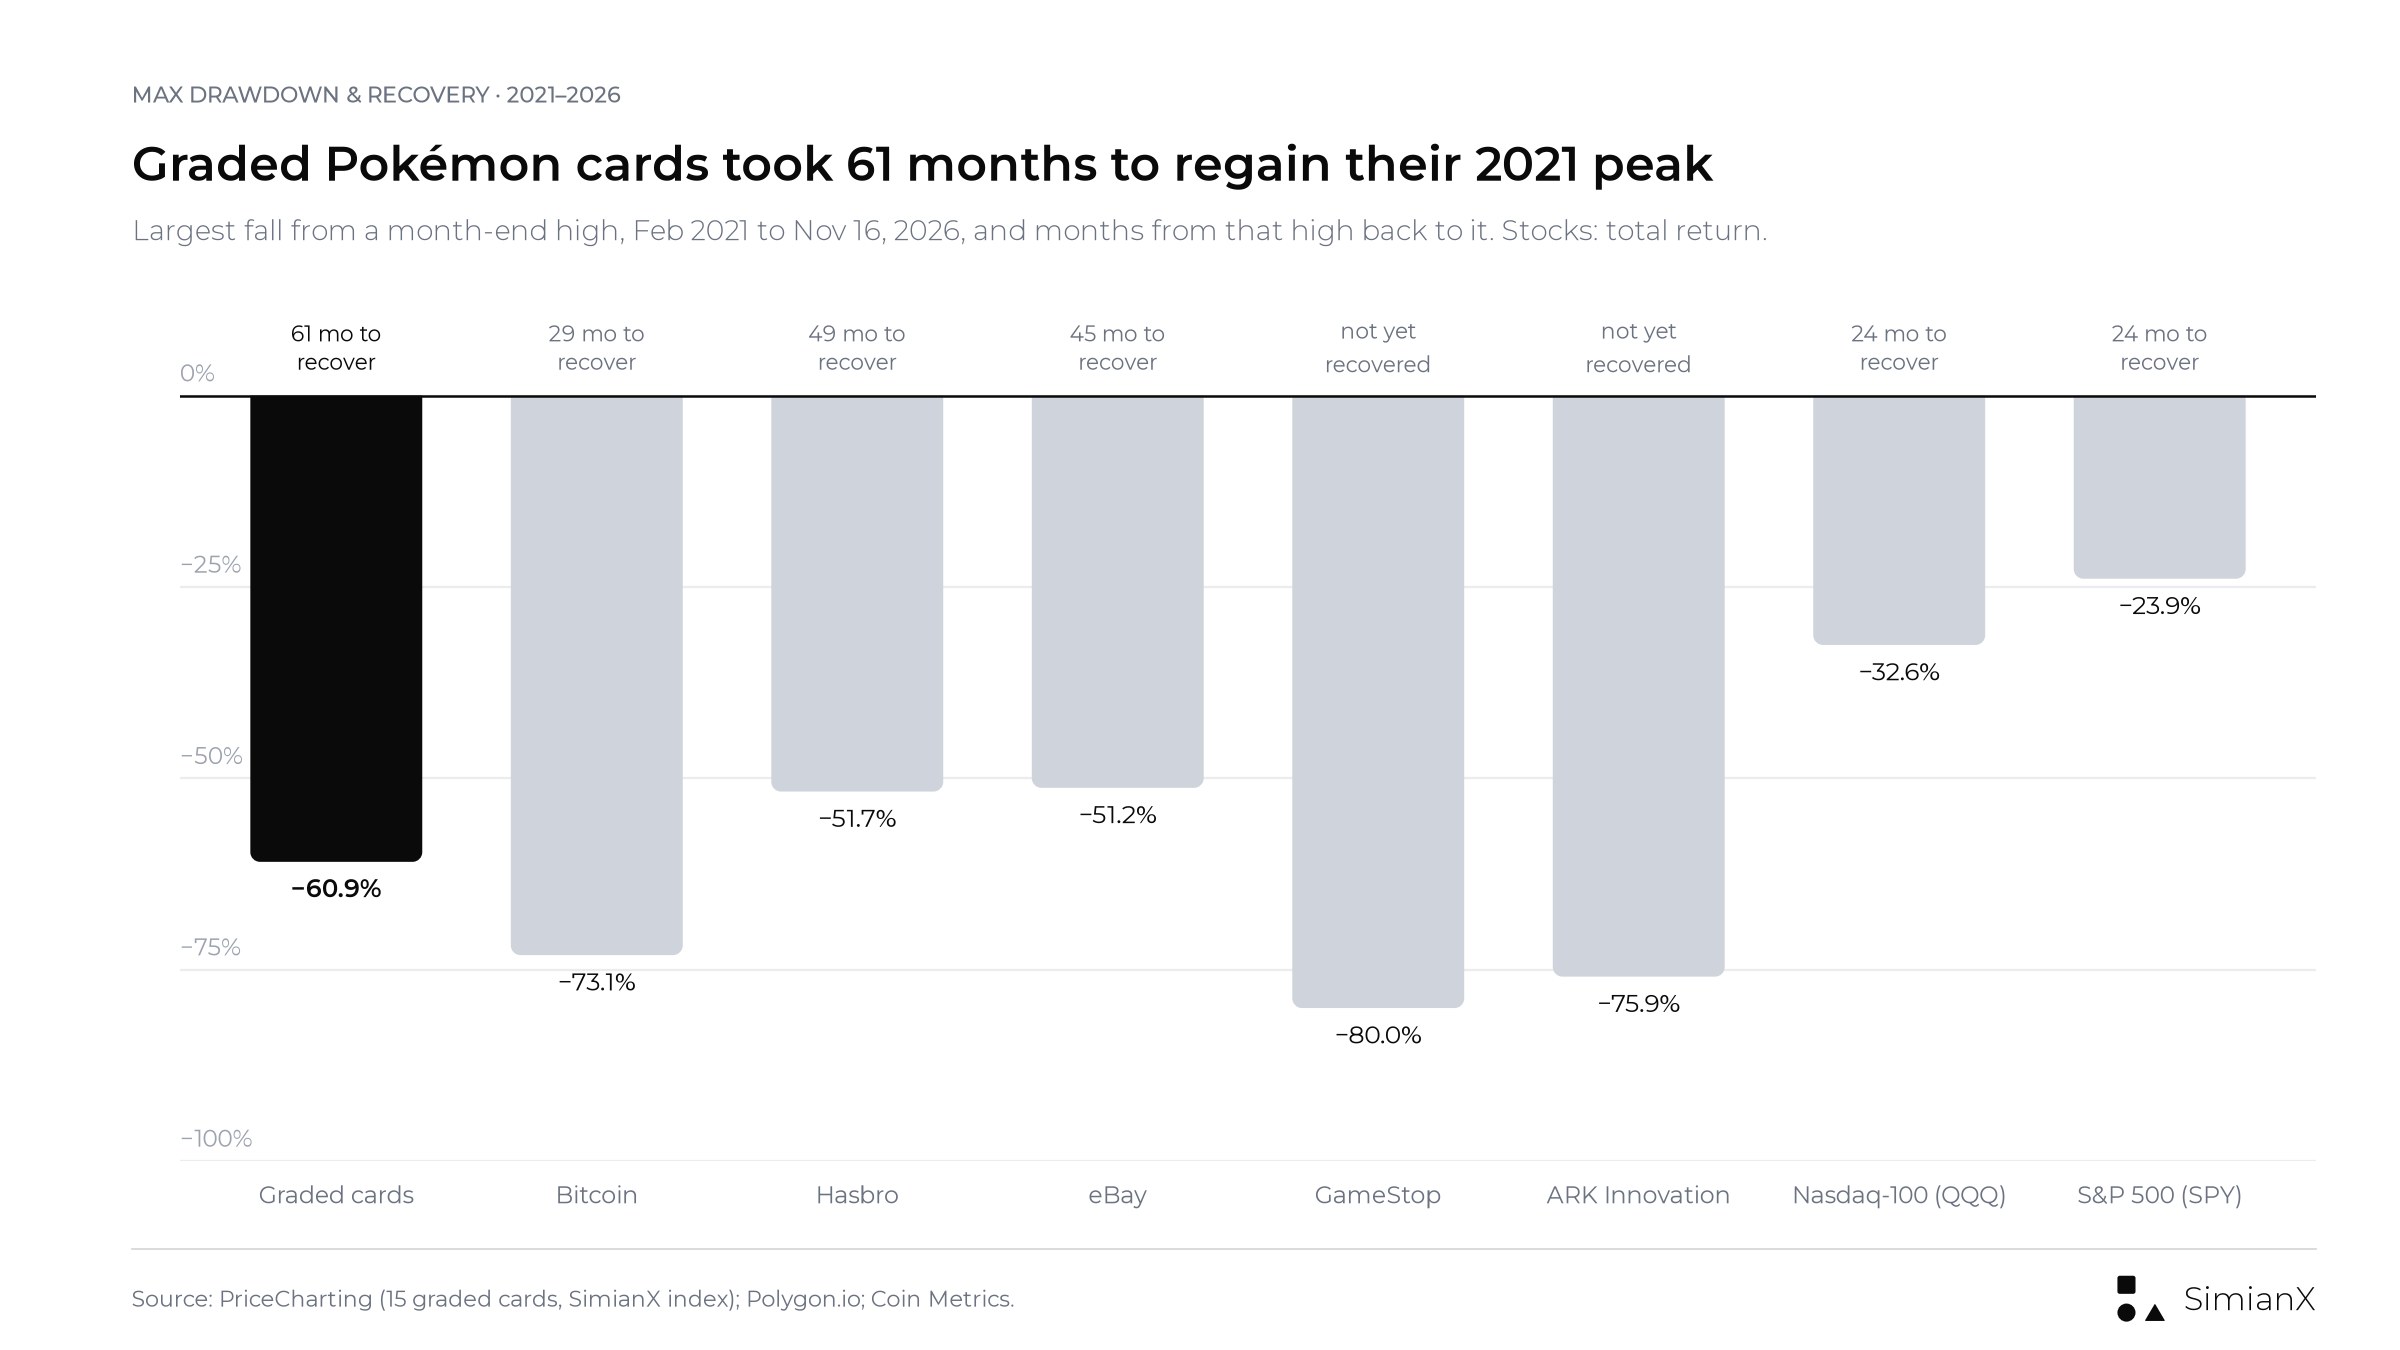
Measured from the 2021 top, graded cards took 61 months to regain their high: from March 2021 to April 2026. The S&P 500 and Nasdaq-100 each needed 24 months, Bitcoin 29, eBay 45 and Hasbro 49. GameStop and ARKK had still not recovered as of November 16, 2026. For longer history, see how long every bear market took to recover and every Bitcoin crash over 50%.
One reason card drawdowns look shallower than they were: prices are estimated from thin trading and change slowly. The basket's monthly returns have a first-order autocorrelation of +0.44, while SPY's is −0.16. Smoothed prices hide part of the real volatility, so a card index can understate how much risk an owner actually took.
2023–2026: did cards decouple? Sealed boxes did the lifting
Yes. From the October 2023 low, cards outran almost everything we tracked.
| Asset | Oct 31, 2023 → Nov 16, 2026 |
|---|---|
| Sealed products (5) | +410.3% |
| SimianX card basket (20) | +288.4% |
| Graded card index (15) | +258.7% |
| eBay (EBAY) | +223.8% |
| Hasbro (HAS) | +198.9% |
| Nasdaq-100 (QQQ) | +91.7% |
| Bitcoin | +87.5% |
| GameStop (GME) | +85.9% |
| S&P 500 (SPY) | +83.5% |
| Nintendo ADR (NTDOY) | +33.8% |
Calendar years show where the divergence happened.
| Year | Card basket | Graded (15) | Sealed (5) | S&P 500 | Bitcoin | Hasbro | Nintendo ADR |
|---|---|---|---|---|---|---|---|
| 2022 (from Jan 31) | −14.0% | −17.7% | +7.3% | −13.6% | −57.0% | −32.2% | −14.7% |
| 2023 | +1.3% | −11.1% | +30.0% | +26.2% | +155.5% | −12.0% | +24.7% |
| 2024 | +22.8% | +9.6% | +33.2% | +24.9% | +121.2% | +14.8% | +12.6% |
| 2025 | +84.6% | +47.4% | +127.7% | +17.7% | −6.3% | +52.5% | +15.2% |
| 2026 to Nov 16 | +65.3% | +113.4% | +58.3% | +9.4% | −25.8% | +51.0% | −18.1% |
Month-end to month-end; S&P 500 and Hasbro are total return; Bitcoin and NTDOY are price.
Three patterns stand out.
- 2023–2024: cards lagged. Bitcoin more than doubled in each year, and the S&P 500 gained about 25% a year. Graded cards were still falling in 2023.
- 2025–2026: cards ran while crypto fell. In 2026 so far, graded cards are +113.4% and Bitcoin is −25.8%. If cards were just another risk-on asset, those two numbers would not point in opposite directions.
- Sealed product led the whole way. The sealed sleeve rose in every calendar year, including 2022. Once a set is out of print, its sealed supply can only shrink, because every box that is opened is gone for good. Graded singles have no such limit: every new grading submission can add to the supply of a card.
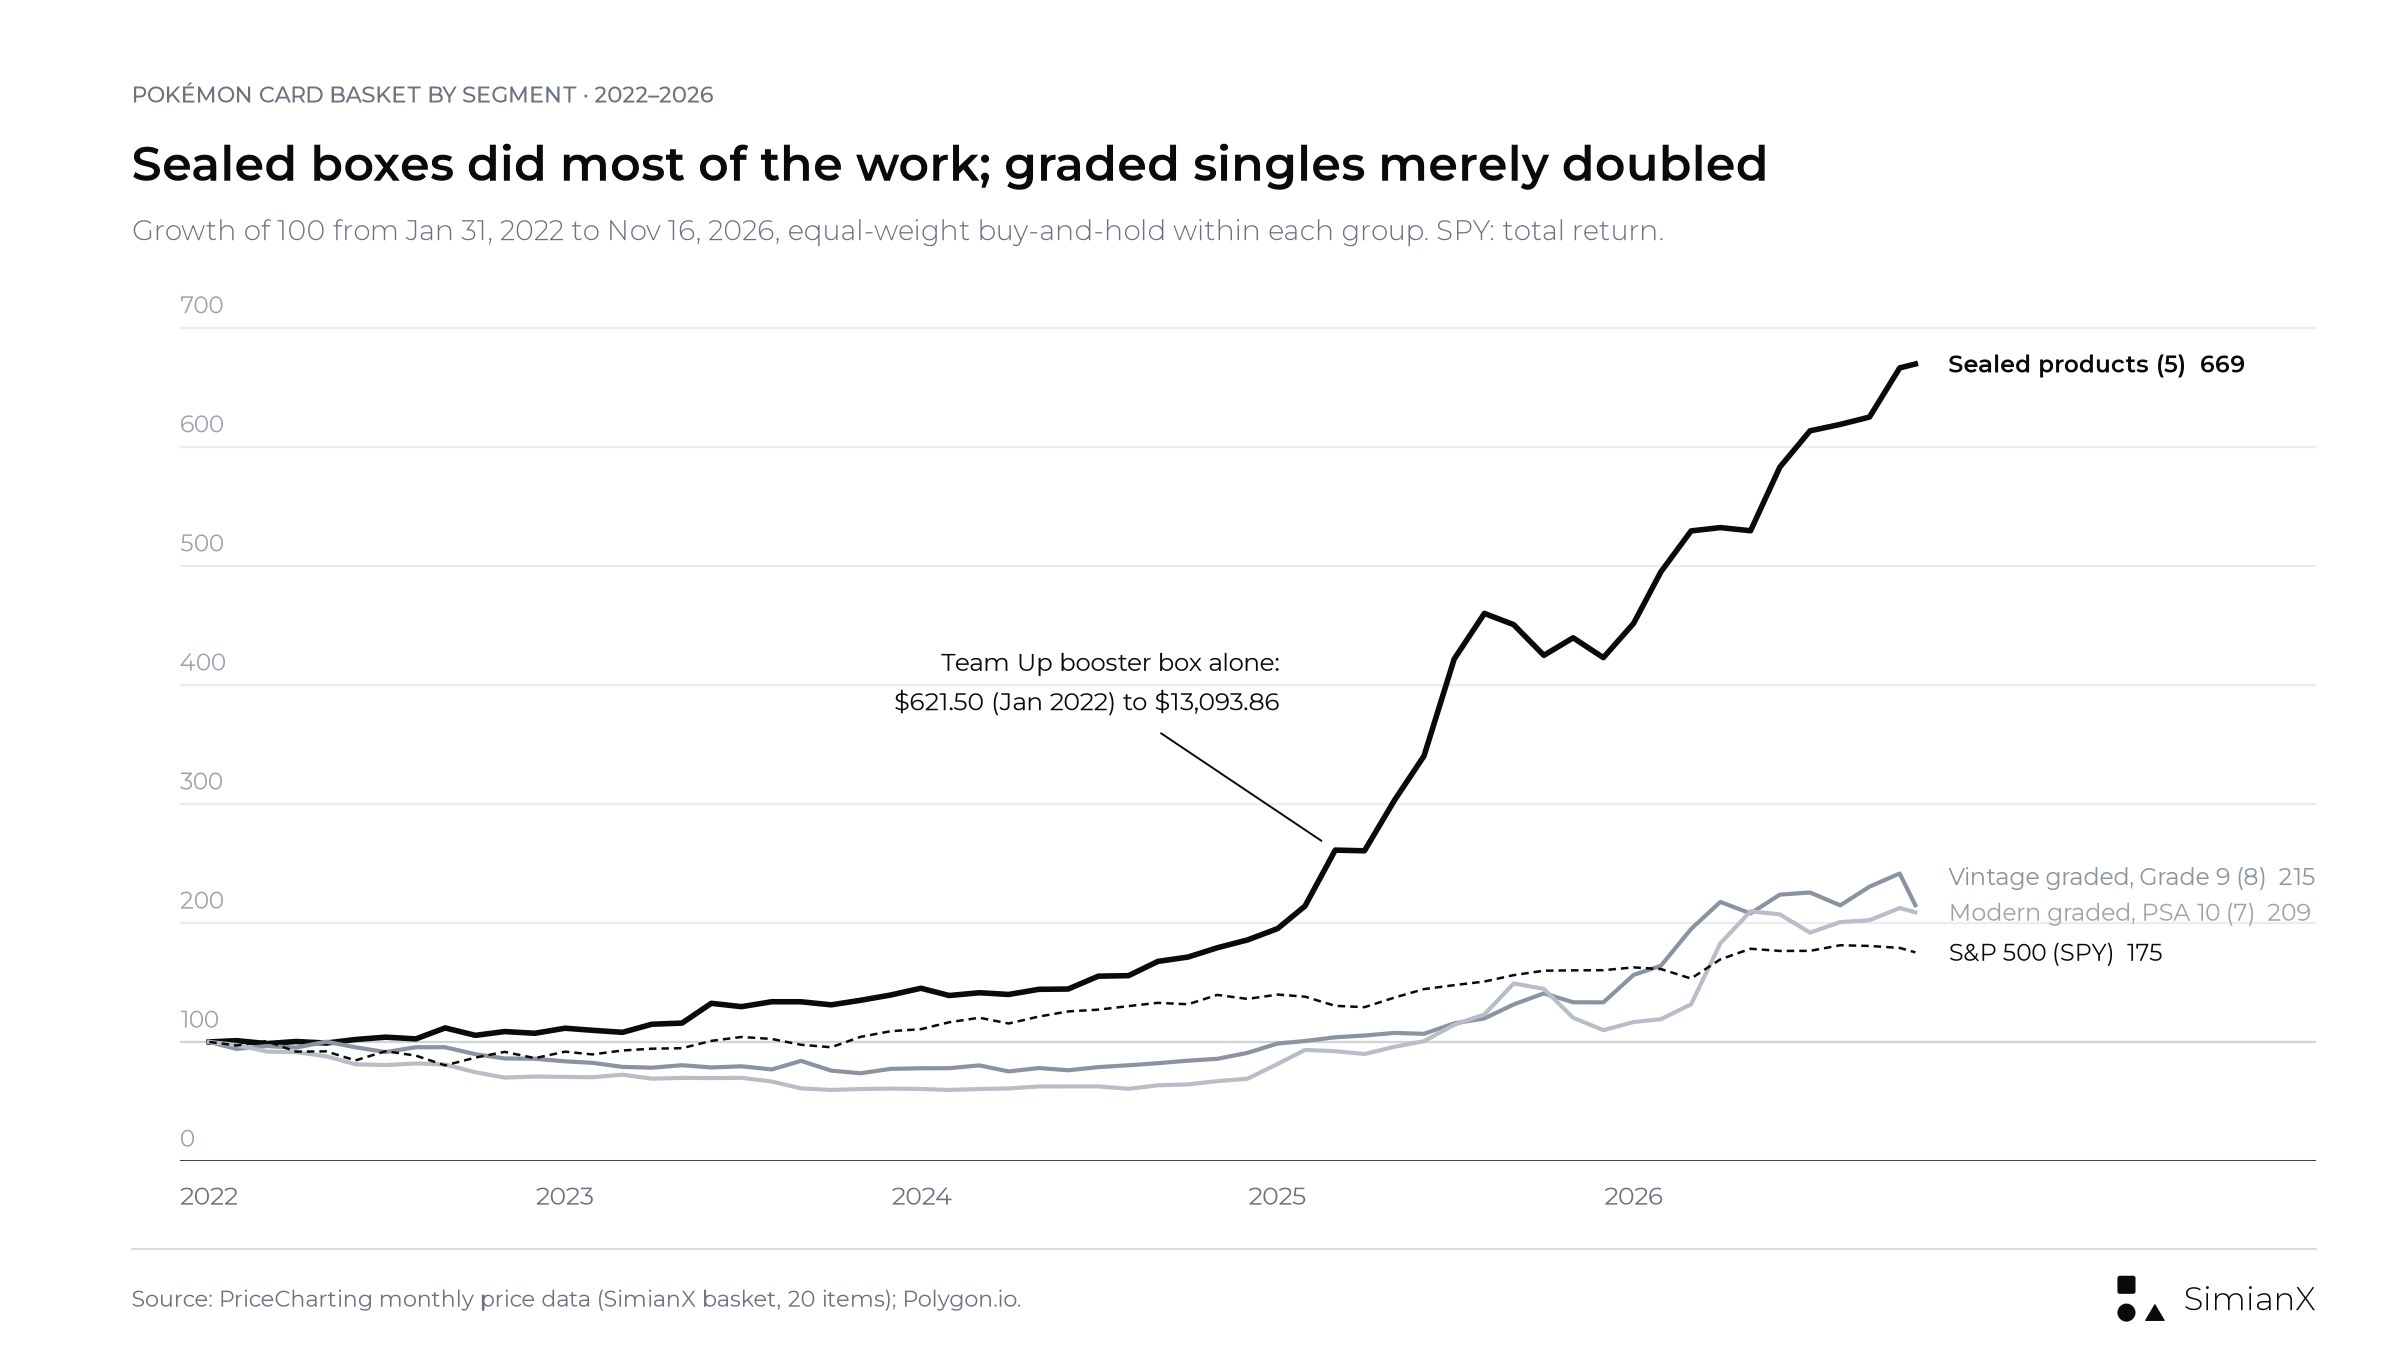
The 30th anniversary. Pokémon turned 30 on February 27, 2026. From the end of December 2025 to the end of March 2026, the graded index rose +39.8%, and vintage Grade 9 cards rose +46.2%. The S&P 500 fell −4.4% and the Nintendo ADR −15.2% over the same three months. Only one anniversary fell inside this data, so the timing fits the hype story but cannot prove it.
New sets: buying the lull beat buying the launch. The newer products below are not in the basket, because they did not exist in 2020. The table shows each one from its first full month on PriceCharting to November 16, 2026.
| Product | First month on PriceCharting | Price then | Peak (month) | Nov 16, 2026 | Change from first month |
|---|---|---|---|---|---|
| Evolving Skies booster box | Mar 2022 | $140.61 | $2,600.00 (Jan 2026) | $2,200.00 | +1,464.6% |
| Team Up Latias & Latios GX #170, PSA 10 | Mar 2022 | $742.56 | $17,250.35 (Jun 2026) | $14,350.00 | +1,832.5% |
| Scarlet & Violet 151 Elite Trainer Box | Sep 2023 | $52.00 | $610.00 (May 2026) | $477.50 | +818.3% |
| 151 Charizard ex #199, PSA 10 | Sep 2023 | $561.34 | $1,799.50 (Apr 2026) | $1,175.00 | +109.3% |
| Prismatic Evolutions Elite Trainer Box | Jan 2025 | $102.75 | $176.25 (Mar 2026) | $122.50 | +19.2% |
| Prismatic Evolutions booster bundle | Jan 2025 | $74.94 | $94.25 (Jun 2026) | $75.00 | +0.1% |
| Prismatic Evolutions Umbreon ex #161, PSA 10 | Jan 2025 | $8,415.56 | $8,415.56 (Jan 2025) | $4,049.50 | −51.9% |
Products bought when the market was quiet, such as Evolving Skies in early 2022 and 151 in late 2023, multiplied. Prismatic Evolutions came out in January 2025, in the middle of a buying frenzy, and has gone sideways or down since its first month. Its PSA 10 Umbreon has halved. Several 2025–2026 hits are also 20–50% below their 2026 peaks as of November 16, 2026. A "Pokémon card market crash" is not visible in the 20-item basket, which is only 3.3% below its October 2026 high. It is already happening item by item.
Do Pokémon card prices move with the stock market or Bitcoin?
Only weakly, and less than most people assume.
| Asset | Monthly correlation (58 months) | Quarterly correlation (19 quarters) |
|---|---|---|
| eBay (EBAY) | +0.33 | +0.52 |
| ARK Innovation (ARKK) | +0.18 | +0.55 |
| Hasbro (HAS) | +0.25 | +0.40 |
| Nasdaq-100 (QQQ) | +0.08 | +0.43 |
| S&P 500 (SPY) | +0.07 | +0.41 |
| Consumer Discretionary (XLY) | +0.09 | +0.31 |
| Nintendo ADR (NTDOY) | −0.05 | +0.16 |
| Bandai Namco ADR (NCBDY) | +0.01 | +0.16 |
| Bitcoin | 0.00 | +0.14 |
| GameStop (GME) | +0.03 | +0.09 |
| Mattel (MAT) | 0.00 | −0.22 |
Basket returns from Feb 2022 to Nov 16, 2026. With these sample sizes, only values above about ±0.26 (monthly) and ±0.46 (quarterly) are statistically different from zero at the 5% level. Bold = significant.
What this says:
- Month to month, cards are close to independent of stocks and crypto. The correlation with Bitcoin is 0.00. That rules out the idea that card prices simply follow crypto risk appetite, at least since 2022.
- eBay is the one real link. eBay is significant at both horizons. That fits: eBay is where most of the sales behind these prices happen, and eBay's own results depend on collectibles activity.
- Over quarters, cards drift with growth stocks. Quarterly correlations with the S&P 500, the Nasdaq-100 and Hasbro sit around 0.4, and ARKK is significant at 0.55. Card prices react slowly, so some of the link only shows up over longer windows.
- The "Pokémon stocks" do not track Pokémon cards. Nintendo and Bandai Namco have near-zero correlation with card prices. Their shares are driven by consoles, video games and the yen, not by the price of a 1999 Charizard.
Trading card stocks: the business behind the cards
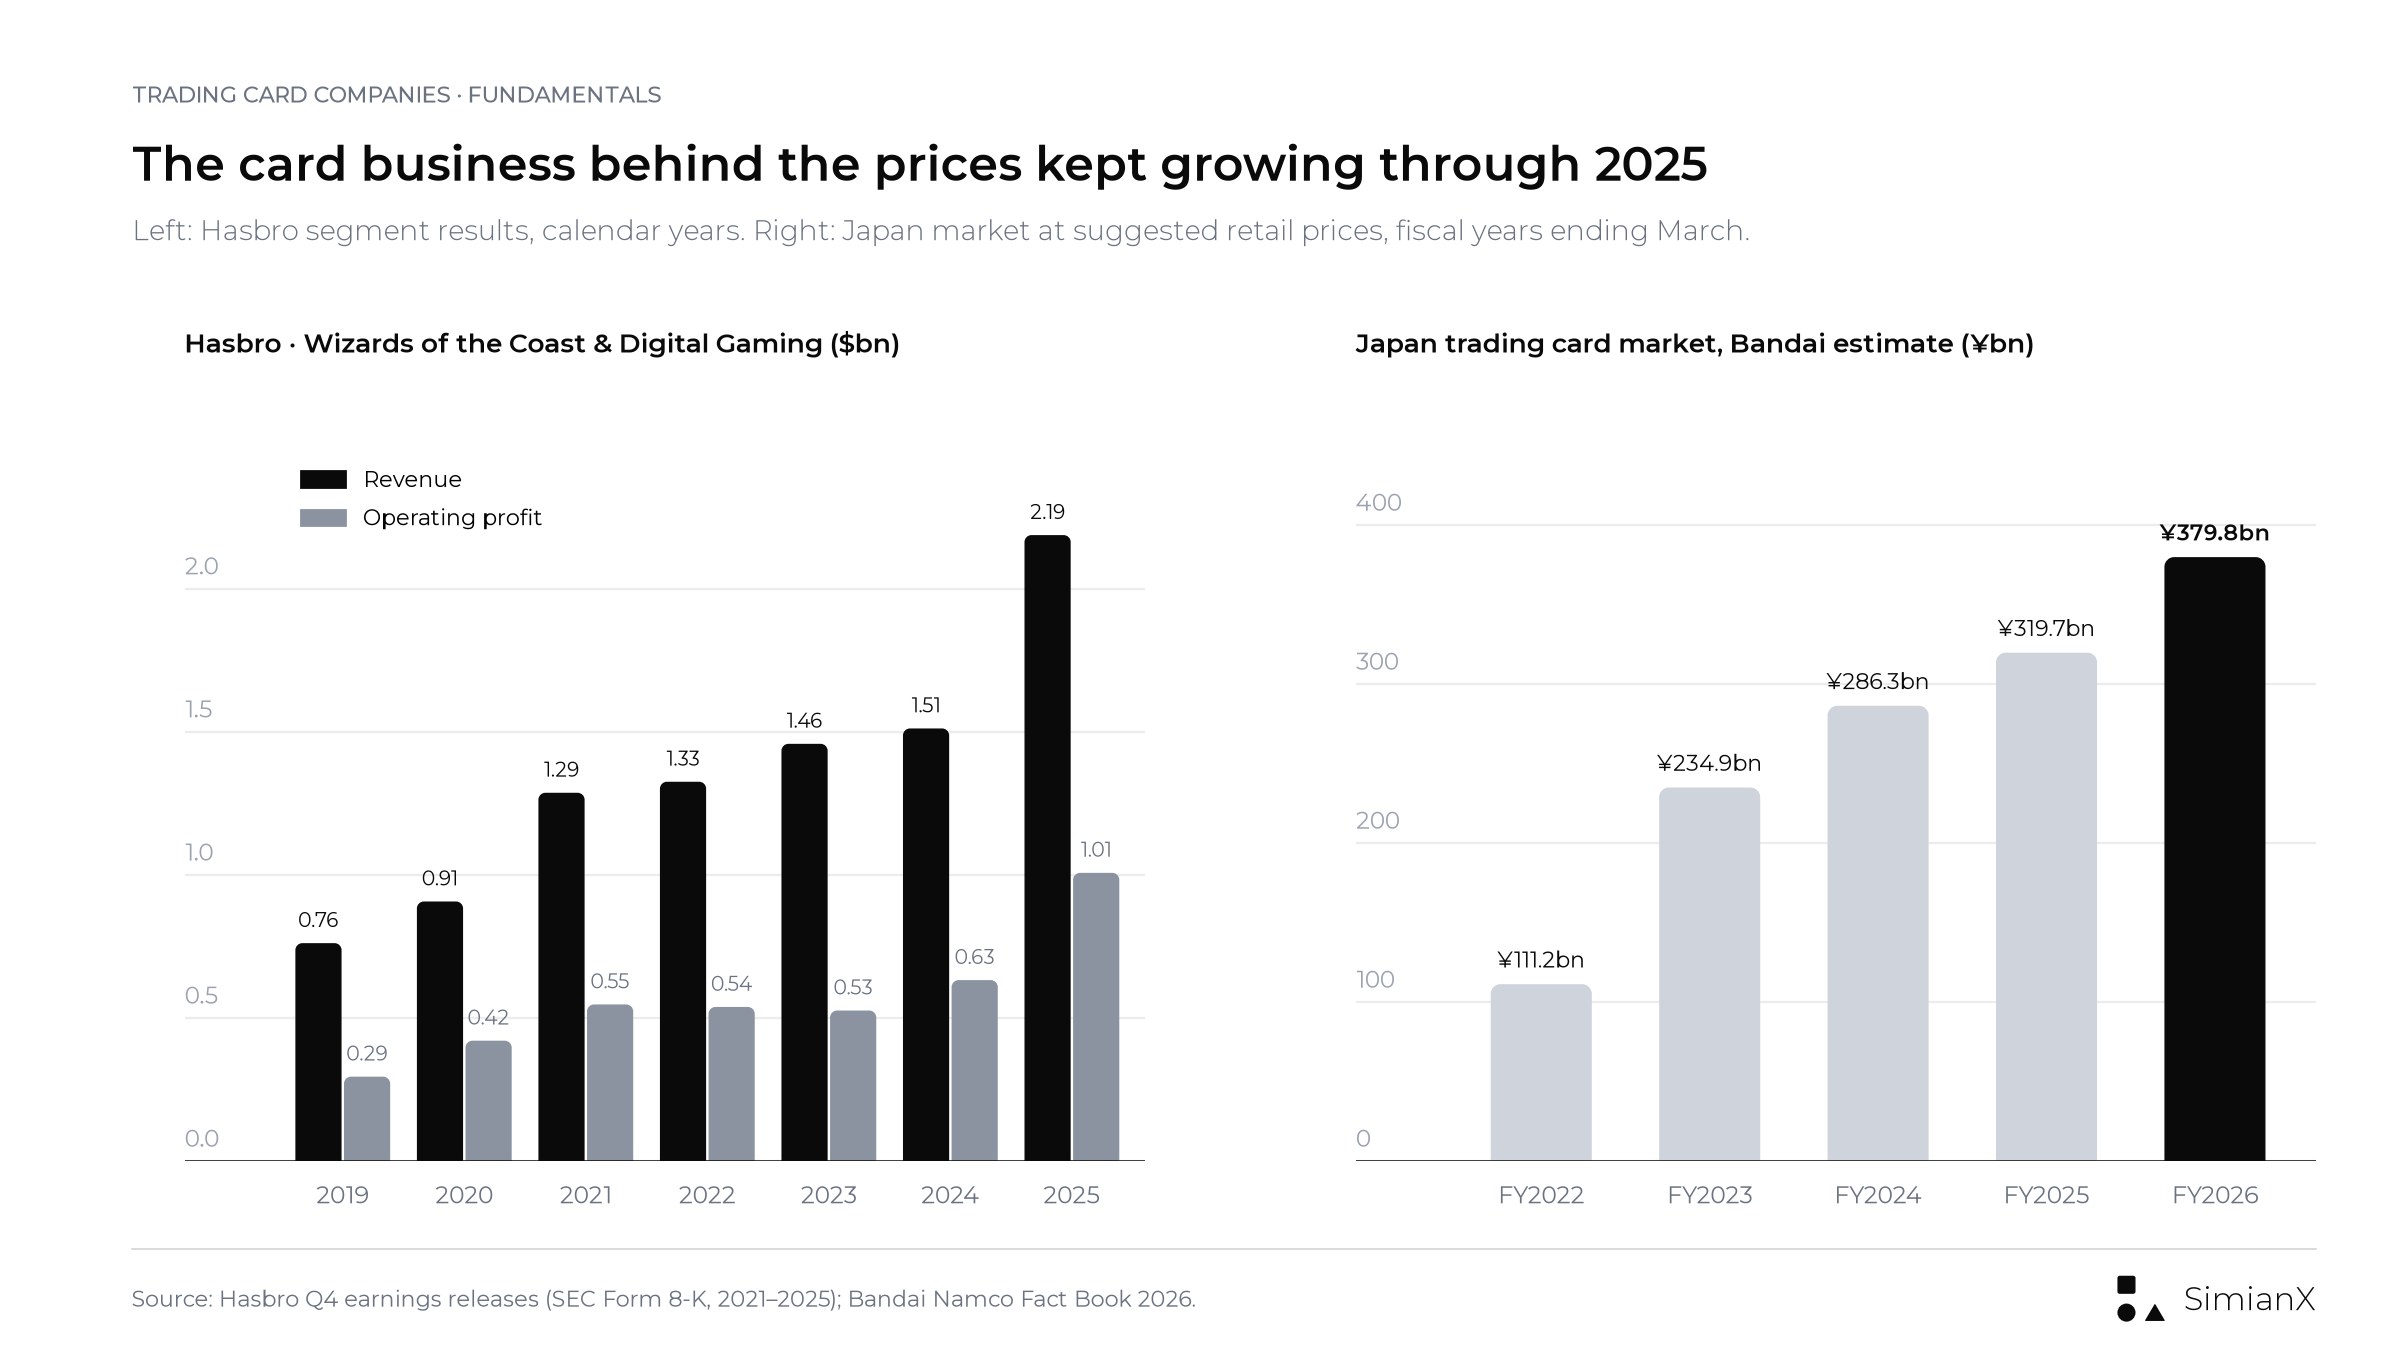
Card prices are what collectors pay each other. The companies below print the cards, run the marketplaces or grade them, and their filings show how much the trading card business itself has grown. Fiscal years differ by company, and all figures are as reported.
Nintendo and The Pokémon Company
- Ownership: 32%. Nintendo holds 32% of the voting rights in The Pokémon Company, according to Nintendo's annual securities report for the year to March 2026. That report names The Pokémon Company as Nintendo's main equity-method affiliate. The Pokémon Company itself is not listed.
- Cards produced: more than 85 billion. The Pokémon Company says it had produced more than 85 billion Pokémon TCG cards by the end of March 2026, sold in 16 languages and more than 90 countries and regions (company figures). Its earlier brand sheets gave more than 64.8 billion at the end of March 2024 and more than 75.0 billion at the end of March 2025. That works out to roughly 10 billion new cards in each of the last two years.
- Supply grew as prices rose. The company has repeatedly said it is printing "at maximum capacity", most recently in a March 2025 update. In April 2022 it agreed to buy its US printer, Millennium Print Group. Rising output did not stop the older, out-of-print cards in our basket from rising in 2025–2026.
- Nintendo's profit from Pokémon and other affiliates. Nintendo's share of profit from equity-method affiliates rose from ¥35.1 billion in the year to March 2025 to ¥82.8 billion in the year to March 2026 (results). It reached ¥60.8 billion in April–September 2026 alone, against ¥44.2 billion a year earlier (first-half results). Nintendo describes this line as relating to "The Pokémon Company and others" and does not give a Pokémon-only figure.
- The Pokémon Company's own results. Its statutory results notice, as compiled by PR TIMES, shows sales of ¥531.4 billion (+29.3%) and net income of ¥120.1 billion for the year to February 2026. That is up from sales of ¥120.0 billion in the year to February 2021. We could not read the original gazette notice, so treat these as a secondary transcription.
Even so, Nintendo's ADR fell 18.1% in 2026 to November 16 while graded cards rose 113.4%. Pokémon is one part of a much larger company.
Hasbro: Wizards of the Coast and Magic: The Gathering
Hasbro does not make Pokémon cards. It owns Wizards of the Coast, maker of Magic: The Gathering, the other big Western trading card game.
| Year | Wizards of the Coast & Digital Gaming revenue | Segment operating profit | Magic: The Gathering revenue |
|---|---|---|---|
| 2019 | $761.2M | $294.7M | — |
| 2020 | $906.7M | $420.4M | — |
| 2021 | $1,286.6M | $547.0M | — |
| 2022 | $1,325.1M | $538.3M | $1,065.2M |
| 2023 | $1,457.6M | $525.7M | $1,085.8M |
| 2024 | $1,511.3M | $632.0M | $1,078.6M |
| 2025 | $2,186.9M | $1,006.8M | $1,720.1M |
| 9 months to Sep 27, 2026 | $1,993.0M | $935.1M | $1,630.9M |
Sources: Hasbro Q4 earnings releases filed with the SEC for 2021, 2022, 2023, 2024 and 2025, plus the Q3 2026 release. Hasbro created this segment in 2021 and restated 2019–2020 to match; the segment also includes digital games such as Monopoly Go! ($168 million of 2025 revenue). Hasbro's releases give no Magic dollar figure for 2019–2021; 2022 was Magic's first year above $1 billion.
Wizards' operating profit in 2025 ($1,006.8 million) was larger than the segment's entire revenue in 2020. Magic revenue rose 59% in 2025, and in Q3 2026 it passed $600 million in a single quarter for the first time ($616.1 million). Hasbro shares followed: −12.0% in 2023, when Magic revenue was flat, then +52.5% in 2025 and +51.0% in 2026 to November 16 (total return). Graded Pokémon cards had a similar pattern, falling in 2023 and surging in 2025–2026. Magic and Pokémon are different products, so the match is better read as a shared hobby cycle than as a direct link.
Bandai Namco and Konami
- Bandai Namco (Tokyo 7832, ADR NCBDY) does not report card-game sales in yen. In an investor Q&A on August 6, 2026, it said its card business, including trading card games such as the ONE PIECE Card Game, roughly doubled in size between the year to March 2024 and the year to March 2026, and that overseas sales now exceed sales in Japan.
- The Japanese card market. Bandai's own estimate, at suggested retail prices, puts Japan's trading card market at ¥111.2 billion in the year to March 2022 and ¥379.8 billion in the year to March 2026, more than three times larger (Bandai Namco Fact Book 2026). Bandai's estimated share of that market was 12.0% in the latest year. Our price index uses US English-language cards; Japanese-language card prices can move differently.
- Konami (Tokyo 9766, ADR KONMY) reports Yu-Gi-Oh! card revenue inside its Digital Entertainment segment, which also includes mobile and console games. That segment's revenue rose from ¥204.2 billion in the year to March 2021 to ¥371.0 billion in the year to March 2026, up 21.5% in the latest year (Konami results). It rose a further 44.3% year on year to ¥243.5 billion in April–September 2026 (first-half results). Konami's last official cumulative total was over 25.1 billion Yu-Gi-Oh! cards sold worldwide by March 2011, a Guinness World Records title.
eBay and GameStop: where the cards trade
- eBay (EBAY). In Q1 2021, eBay said its US trading-card GMV topped $1 billion in a single quarter and active buyers in the category doubled (Q1 2021 release). Since then eBay has:
- bought the card marketplace TCGplayer, completed on October 31, 2022;
- bought the auction house Goldin and sold its card vault to PSA, in deals announced in April 2024.
- By Q3 2026, TCGplayer had passed $1 billion in GMV over the trailing 12 months (Q3 2026 release).
- On its Q3 2025 earnings call, eBay said Pokémon GMV had grown "in the triple digits year over year for the third straight quarter".
- On the Q4 2025 call, its CFO said eBay expected Pokémon growth to slow in 2026.
- GameStop (GME). GameStop's collectibles sales fell from $964.6 million in fiscal 2022 to $717.9 million in fiscal 2024. They then rose to $1,060.2 million in the year to January 31, 2026, 29.2% of its net sales (10-K). That filing says a significant portion of collectibles revenue comes from trading cards, including Pokémon. It credits growth partly to the rollout of graded-card submission services to all US stores, following an October 2024 collaboration with PSA (8-K). In the quarter to August 1, 2026, collectibles were 45.1% of GameStop's net sales.
The pattern across these companies is consistent. The trading card business grew strongly from 2021 to 2026, both in cards printed and in revenue, and that growth showed up in Hasbro's and eBay's results. It did not make Nintendo stock a proxy for Pokémon card prices.
Is there seasonality or a set-release cycle in Pokémon card prices?
Not that the data can show. We averaged the graded index's monthly returns by calendar month from March 2021 to October 2026. January (+4.5%) and March (+4.7%) look strong and November (−3.4%) looks weak. But each month has only five or six observations, and a single strong year dominates each average. For the full basket from February 2022, every month of the year averaged positive except October (−1.1%) and November (−0.5%).
That is consistent with "holiday selling, then new-year buying", but it is also consistent with noise. We treat it as no reliable seasonality. The same goes for set releases: English main sets come out roughly every quarter, and we found no stable pattern around release months. The S&P 500, with 75 years of data, does show measurable seasonality, and so does Bitcoin month by month. Six years of card data is not enough to claim the same.
Why card returns are not stock returns: fees, grading, spreads and storage
A card index pays no costs. A collector pays several. As of November 16, 2026:
| Cost | Typical size | Source |
|---|---|---|
| eBay selling fee, trading card categories | 13.25% of the sale up to $7,500 per item, 2.35% on the part above $7,500, plus $0.30 per order of $10 or less or $0.40 above $10 | eBay seller fees page, read Nov 16, 2026 |
| TCGplayer marketplace commission (Level 1–4 sellers) | 10.75% from Feb 10, 2026, capped at $75 per item | TCGplayer seller blog, Jan 8, 2026 |
| PSA grading, Value tier | $39.99 per card, maximum insured value $500, 90–100 business days (reopened Oct 29, 2026) | PSA's announcement as reported by Sports Illustrated |
| PSA grading, Standard tier | $59.99 per card, maximum insured value $1,000, 70–80 business days from Oct 28, 2026 | Sports Illustrated, Sep 2026 and Oct 2026 report above |
| Spread between buying and selling prices | Not measured here. The index uses estimated sale prices, not the prices you can actually buy or sell at | — |
| Shipping, insurance, storage and authentication | Varies by item. No card index includes them | — |
PSA's own website was not accessible to us, so PSA prices are as reported by Sports Illustrated. Fees change often; check the platform before you sell.
What the fees do to the numbers above:
- Selling fees alone cut the basket's gain by about a sixth. If every item had been sold on eBay on November 16, 2026, eBay's fee would have cut the basket's gain from +226.4% to about +189.0%. That still beats the S&P 500's +75.2%, but it ignores any premium paid over the estimated price when buying, plus shipping, insurance and tax.
- A card must rise about 15% just to break even. A $1,000 card has to gain about 15.3% to cover eBay's selling fee alone ($132.90). A $100 card needs about 15.8%.
- Grading adds cost and time. Grading a raw card costs a fee per card and takes roughly 70–100 business days at PSA's cheaper tiers. The grade is not guaranteed, and a low grade can leave a card worth less than the fee.
- Holding an index fund costs very little by comparison. A broad index fund typically charges a small fraction of 1% a year.
Survivorship bias. This basket uses each set's headline items as known today. Choosing famous cards after the fact flatters returns, because the typical card in a 1999 or 2020 box never became a headline item. The basket also starts with cards that were already graded or sealed. Raw cards that grade badly lose much of their value.
Liquidity. Our biggest winners trade about once a week, and a PSA 10 Base Set Charizard about once a month. A stock in the S&P 500 trades millions of shares a day. When many owners want out at once, card prices can gap down, and the last sale may not be a price you can actually get.
No cash flow. Cards pay no dividends and earn no profits. Their price depends entirely on future collectors wanting them. The S&P 500 figures above include SPY's dividends, which came to roughly 1.1–1.7% of its price in each year from 2022 to 2025. A card's return is its price change minus costs.
Are Pokémon cards a good investment in 2026? What the data does and doesn't say
We do not give investment advice, and this section does not recommend buying or selling cards or stocks. Here is what the numbers support as of November 16, 2026:
- Start date dominates the answer. From January 2022 the basket beat the S&P 500 by more than 150 percentage points. From February 2021, the 15 graded cards trailed it by almost 60 points.
- Concentration dominates the average. One sealed box explains 44% of the basket's gain. The median item, +133.5%, is a fairer summary than the mean.
- Drawdowns are long. The last full cycle took 61 months to recover, and the price data are smoothed, so the real ride was rougher than the index shows.
- Costs change the result. After fees, grading and shipping, the gap to a cheap index fund narrows a lot, and it can reverse for low-value cards.
- Cards diversify a stock portfolio only partly. Monthly correlations are near zero, but quarterly links to growth stocks and eBay are real, and every card boom so far has ended when retail risk appetite turned.
If your question is simply "pokémon cards vs S&P 500", the honest answer is that the result depends on when you start and which cards you hold. Spread across a whole market, the average card bought at retail does far worse than any index of famous survivors.
How to get Pokémon exposure through the stock market
The Pokémon Company is private, so there is no "Pokémon stock". The listed companies closest to the trading card game are covered in the fundamentals section above. We do not recommend any of them. As of November 16, 2026, none of them tracked card prices closely:
- Nintendo (Tokyo 7974; US ADR NTDOY) owns part of The Pokémon Company, as set out above. Its share price is driven mainly by consoles and games, and its card-price correlation is close to zero.
- Hasbro (HAS) owns Wizards of the Coast, the maker of Magic: The Gathering. It is a trading card business, but not a Pokémon one.
- Bandai Namco (Tokyo 7832; US ADR NCBDY) sells the One Piece, Dragon Ball and Digimon card games.
- eBay (EBAY) is the marketplace where most of these prices are set. It had the strongest correlation with our basket.
- GameStop (GME) sells collectibles and has a grading partnership, but its share price has followed its own retail-trading story.
You can run a live, data-driven analysis of any of these tickers on SimianX. Bitcoin, the risk-appetite benchmark used here, is tracked on its SimianX asset page.
FAQ
Have Pokémon cards beaten the S&P 500?
Since January 31, 2022, yes, on paper. Our 20-item basket rose +226.4% to November 16, 2026, against +75.2% for the S&P 500 with dividends. From February 2021, near the last boom's peak, 15 graded cards rose only +52.4% against +110.1% for the S&P 500. Both figures are before fees.
Is there a Pokémon card index?
There is no official public one with long history. Commercial trackers exist, often behind accounts. PriceCharting's free Pokémon price history starts in December 2020. The index on this page uses that public data, with the methodology and item list shown above.
When did the Pokémon card market crash?
After the early-2021 peak. Our graded index topped in March 2021 and fell 60.9% to October 2023, and it got back above the 2021 high only in April 2026. As of November 16, 2026, the basket is 3.3% below its October 2026 high, but several 2025–2026 releases are 20–50% below their peaks.
Do Pokémon card prices follow Bitcoin?
Not since 2022. The monthly correlation with Bitcoin was 0.00, and in 2026 so far graded cards rose +113.4% while Bitcoin fell −25.8%. In 2021 both were part of the same speculative wave, but cards topped about two months before Bitcoin's first 2021 high.
Are sealed Pokémon boxes better than graded cards?
In this sample, sealed products rose +569.4% from January 2022 to November 16, 2026, against +114.9% for vintage and +108.9% for modern graded cards. Most of that came from a few older, scarce boxes. Newer sealed products bought at launch, such as Prismatic Evolutions in 2025, are flat to down.
Can I buy Pokémon stock?
No. The Pokémon Company is privately held. Nintendo owns part of it but is a much larger and different business, and Nintendo's ADR showed near-zero correlation with card prices.
Which stock moves most with Pokémon card prices?
eBay, the main marketplace for these sales. Its correlation with the basket was +0.33 monthly and +0.52 quarterly, the strongest of the stocks tested.
What costs reduce Pokémon card returns?
Marketplace selling fees, grading fees and wait times, the gap between buying and selling prices, shipping, insurance, storage and authentication. An index assumes you buy and sell at the estimated price with no costs, which no collector actually gets.
Data, sources and update schedule
Raw monthly prices for all 20 items, the index levels and the comparison series were saved with this study, and the item list above lets anyone rebuild the index from PriceCharting's public pages. We plan to refresh this page every quarter, after the next Hasbro, Nintendo and Bandai Namco results, with updated card prices.
Related reading
- S&P 500 Returns by Year 1928–2026: Full Table + 2026 YTD
- Bitcoin Returns by Year: Every Year 2011–2026 Table
- Gold Price by Year 1971–2026: Returns Table With 2026 YTD
- Nasdaq Returns by Year: Every Year 1972–2026 Table
- How Long Every Bear Market Took to Recover: 1929-2022
- Every Bitcoin Crash Over 50%: Recovery Times Since 2011
- Every Tech Bubble Since 1929: How AI in 2026 Compares
- S&P 500 Seasonality: The Best & Worst Months 1950–2026
Sources
Price data
- PriceCharting — Pokémon card prices: monthly price history for the 20 basket items and the newer products, read Nov 16, 2026 (how prices are calculated)
- Internet Archive — PriceCharting page, Feb 24, 2021: used to check that history starts in Dec 2020 and that past months are not revised
- Polygon.io: daily split-adjusted closes and dividend records for SPY, QQQ, XLY, ARKK, HAS, MAT, FNKO, EBAY, GME, NTDOY and NCBDY
- Nasdaq.com historical quotes: second-source check on 99 closes
- Coin Metrics community data and Bitfinex: Bitcoin daily prices
Company filings and official statements
- Nintendo — annual securities report, year to March 2026, FY results and first-half results
- The Pokémon Company — Pokémon in figures and 30th anniversary brand sheet (Japanese)
- Pokémon — TCG product availability update, March 2025
- Hasbro — Q4 2025 results (SEC) and Q3 2026 results (SEC)
- Bandai Namco — Fact Book 2026 and investor Q&A, Aug 6, 2026 (Japanese)
- Konami — results for the year to March 2026
- eBay — Q3 2026 results (SEC)
- GameStop — 10-K for the year to January 31, 2026 (SEC)
Costs and other references