
 By Marcus Reeve
Bitcoin Monthly Returns Since 2013: Seasonality Heatmap and November 2026 So Far
Updated November 11, 2026. Monthly returns through the October 31, 2026 close; November 2026 is month to date through the November 11, 2026 close (UTC). The November row will be finalized after the November 30 close.
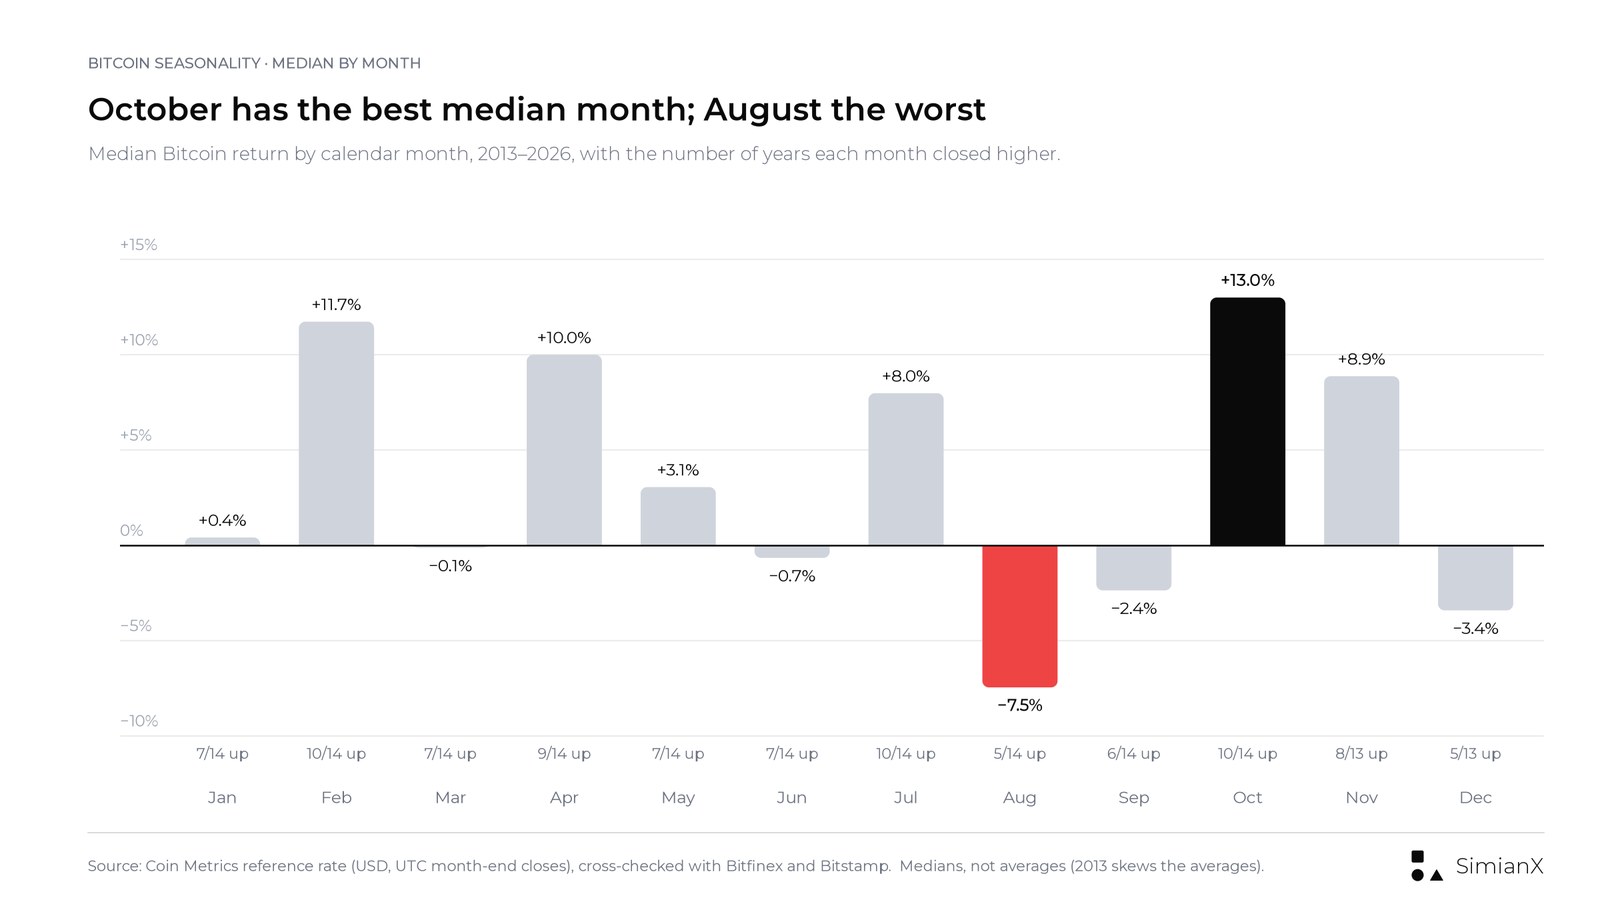
Short answer: Since 2013, Bitcoin's best calendar month has been October (median +13.0%, higher in 10 of 14 years) and its worst has been August (median −7.5%, higher in only 5 of 14). November has the highest average return (+41.4%), but that figure is driven by one month, November 2013 (+450.6%). Its median is +8.9%, and it closed higher in 8 of 13 years, but only 3 of the last 7. Through November 11, 2026, Bitcoin is −4.6% for the month.
This page lists Bitcoin monthly returns for every month from January 2013 to October 2026, plus November 2026 to date, in one year-by-month table and a seasonality heatmap. It then sums up each calendar month (average, median, share of positive years, best and worst year) to answer the questions people actually search for: which month is best for Bitcoin, which is worst, and whether November really is a good month. Every month-end price comes from the Coin Metrics reference rate and was checked against Bitfinex and Bitstamp daily closes; the methodology and the months where sources disagree are listed at the end.
For the same data at other time scales, see our Bitcoin returns by year table and Bitcoin quarterly returns table.
Key numbers at a glance
- Months covered: 166 complete months (January 2013 to October 2026). Bitcoin closed higher in 91 of them (54.8%). The median month was +3.0%; the average month, +9.6%.
- Best calendar month (median): October, +13.0%, higher in 10 of 14 years.
- Worst calendar month (median): August, −7.5%, higher in 5 of 14 years.
- Most consistent: February, July and October each closed higher in 10 of 14 years.
- Only months with both a negative average and a negative median: June (−2.1% / −0.7%) and September (−2.5% / −2.4%).
- Best single month: November 2013, +450.6%. Worst single month: June 2022, −39.3%.
- Longest winning streak: 7 months in a row, September 2023 through March 2024. Longest losing streak: 6 months, August 2018 through January 2019.
- 2026 so far: 5 of 10 completed months higher; −15.7% for the year through November 11.
Bitcoin Monthly Returns Table: Every Month 2013–2026
Monthly price returns in U.S. dollars, from the last UTC close of the previous month to the last UTC close of the month. Negative months are in bold. The "Year" column is the calendar-year return over the same closes.
| Year | Jan | Feb | Mar | Apr | May | Jun | Jul | Aug | Sep | Oct | Nov | Dec | Year |
|---|---|---|---|---|---|---|---|---|---|---|---|---|---|
| 2013 | +51.4% | +62.7% | +181.3% | +48.2% | −8.1% | −30.0% | +9.5% | +31.0% | −1.8% | +61.2% | +450.6% | −34.8% | +5,286% |
| 2014 | +10.1% | −31.4% | −17.4% | −1.4% | +39.9% | +1.8% | −8.9% | −17.8% | −18.7% | −13.4% | +12.3% | −15.3% | −56.0% |
| 2015 | −32.2% | +17.3% | −4.0% | −3.4% | −2.9% | +15.0% | +7.9% | −18.9% | +2.6% | +32.7% | +20.1% | +13.9% | +34.0% |
| 2016 | −14.7% | +19.5% | −5.0% | +8.2% | +18.0% | +27.0% | −7.3% | −8.4% | +6.4% | +14.8% | +6.2% | +30.6% | +125.5% |
| 2017 | −0.05% | +22.7% | −9.0% | +27.8% | +66.4% | +6.7% | +16.7% | +65.6% | −8.6% | +48.3% | +55.5% | +39.3% | +1,337% |
| 2018 | −27.8% | +2.6% | −32.8% | +33.3% | −19.0% | −14.8% | +21.2% | −9.1% | −6.0% | −4.5% | −37.0% | −7.2% | −73.5% |
| 2019 | −7.5% | +11.2% | +7.9% | +28.6% | +62.5% | +26.7% | −7.2% | −4.5% | −13.8% | +10.5% | −17.5% | −5.1% | +94.4% |
| 2020 | +30.6% | −8.3% | −25.0% | +34.5% | +9.0% | −3.1% | +24.0% | +3.0% | −7.8% | +28.2% | +42.4% | +47.6% | +304.9% |
| 2021 | +14.2% | +36.8% | +29.6% | −1.8% | −35.4% | −6.0% | +19.2% | +13.0% | −7.3% | +40.3% | −7.1% | −18.8% | +59.7% |
| 2022 | −17.0% | +12.3% | +5.5% | −17.2% | −15.6% | −39.3% | +20.8% | −14.3% | −2.9% | +5.4% | −16.2% | −3.8% | −64.4% |
| 2023 | +40.0% | +0.1% | +23.2% | +3.0% | −7.3% | +12.0% | −4.1% | −11.2% | +3.9% | +28.4% | +8.9% | +11.9% | +155.5% |
| 2024 | +0.9% | +44.2% | +16.0% | −14.9% | +11.1% | −6.8% | +3.1% | −8.9% | +7.3% | +11.2% | +37.1% | −3.2% | +121.2% |
| 2025 | +9.5% | −17.6% | −2.1% | +14.3% | +11.1% | +2.3% | +8.1% | −6.5% | +5.2% | −3.9% | −17.3% | −3.4% | −6.3% |
| 2026 | −10.1% | −14.9% | +1.9% | +11.9% | −3.5% | −20.5% | +7.4% | +24.9% | +6.4% | −7.4% | −4.6%\* | — | −15.7%\* |
\*November 2026 and the 2026 year figure run through the November 11, 2026 close ($73,806). January 2017 was −0.05%, shown to two decimals so that its sign is visible.
The heatmap below shows the same table in colour. Two things stand out at once: 2013 and 2017 are almost solid green, and 2014, 2018 and 2022, the three years after a cycle peak, are mostly red. Seasonality matters much less than where Bitcoin stands in its four-year cycle.

Bitcoin Seasonality: Average, Median and % Positive by Month
The table summarizes each calendar month across all years. Averages are pulled up by 2013, when Bitcoin rose from about $13.55 to $730, so the median and the count of positive years are the better guides. The last column shows the average without 2013.
| Month | Average | Median | Higher / years | Best (year) | Worst (year) | Average excl. 2013 |
|---|---|---|---|---|---|---|
| January | +3.4% | +0.4% | 7 / 14 | +51.4% (2013) | −32.2% (2015) | −0.3% |
| February | +11.2% | +11.7% | 10 / 14 | +62.7% (2013) | −31.4% (2014) | +7.3% |
| March | +12.2% | −0.1% | 7 / 14 | +181.3% (2013) | −32.8% (2018) | −0.9% |
| April | +12.2% | +10.0% | 9 / 14 | +48.2% (2013) | −17.2% (2022) | +9.4% |
| May | +9.0% | +3.1% | 7 / 14 | +66.4% (2017) | −35.4% (2021) | +10.3% |
| June | −2.1% | −0.7% | 7 / 14 | +27.0% (2016) | −39.3% (2022) | +0.1% |
| July | +7.9% | +8.0% | 10 / 14 | +24.0% (2020) | −8.9% (2014) | +7.7% |
| August | +2.7% | −7.5% | 5 / 14 | +65.6% (2017) | −18.9% (2015) | +0.5% |
| September | −2.5% | −2.4% | 6 / 14 | +7.3% (2024) | −18.7% (2014) | −2.5% |
| October | +18.0% | +13.0% | 10 / 14 | +61.2% (2013) | −13.4% (2014) | +14.7% |
| November | +41.4% | +8.9% | 8 / 13 | +450.6% (2013) | −37.0% (2018) | +7.3% |
| December | +4.0% | −3.4% | 5 / 13 | +47.6% (2020) | −34.8% (2013) | +7.2% |
What the table says, month by month:
- October is the strongest month by every measure. It has the highest median (+13.0%), the second-highest average (+18.0%), 10 positive years out of 14, and even without 2013 its average is +14.7%. Its worst result, −13.4% in 2014, is milder than the worst result of every other month except July (−8.9%). "Uptober" is a real pattern in this data, but October 2025 (−3.9%) and October 2026 (−7.4%) were both negative, the first time October has been lower two years running.
- February, April and July are quietly strong. February (median +11.7%) and July (median +8.0%) each closed higher in 10 of 14 years; April's median is +10.0%. July has the narrowest range of the positive months: its worst year was −8.9% (2014).
- August is the weakest month by median. It closed lower in 9 of 14 years, with a median of −7.5%. Its positive average (+2.7%) comes from two big years, 2013 (+31.0%) and 2017 (+65.6%).
- September is reliably soft. Its average (−2.5%) and median (−2.4%) are both negative, it rose in only 6 of 14 years, and its best year was only +7.3% (2024). September has the smallest spread of any month, so it rarely hurts much and rarely helps.
- January and March are coin flips. Both rose in 7 of 14 years, and without 2013 both averages are slightly negative.
- December is weaker than its reputation. It rose in only 5 of 13 years and its median is −3.4%. The average (+4.0%) rests on 2016 (+30.6%), 2017 (+39.3%) and 2020 (+47.6%).
Best and Worst Months for Bitcoin
Measured by median return, the best months for Bitcoin have been October (+13.0%), February (+11.7%), April (+10.0%), November (+8.9%) and July (+8.0%). The worst have been August (−7.5%), December (−3.4%), September (−2.4%), June (−0.7%) and March (−0.1%).
Single months are a different list. The ten biggest monthly gains and losses since 2013:
| Rank | Best months | Return | Worst months | Return |
|---|---|---|---|---|
| 1 | November 2013 | +450.6% | June 2022 | −39.3% |
| 2 | March 2013 | +181.3% | November 2018 | −37.0% |
| 3 | May 2017 | +66.4% | May 2021 | −35.4% |
| 4 | August 2017 | +65.6% | December 2013 | −34.8% |
| 5 | February 2013 | +62.7% | March 2018 | −32.8% |
| 6 | May 2019 | +62.5% | January 2015 | −32.2% |
| 7 | October 2013 | +61.2% | February 2014 | −31.4% |
| 8 | November 2017 | +55.5% | June 2013 | −30.0% |
| 9 | January 2013 | +51.4% | January 2018 | −27.8% |
| 10 | October 2017 | +48.3% | March 2020 | −25.0% |
Five of the ten best months come from 2013 and four from 2017, both years in which Bitcoin rose more than tenfold; the only other entry is May 2019. The worst months are more spread out, but they cluster in the years after a cycle top (2014, 2018, 2022) and in shocks: March 2020 was the COVID-19 crash, May 2021 the sell-off after Tesla suspended Bitcoin payments and China stepped up its crackdown on crypto mining, and June 2022 the Celsius freeze and the Three Arrows Capital failure, a month after Terra/LUNA collapsed. Our table of every Bitcoin crash over 50% shows how long each of those drawdowns took to recover.
Is November a Good Month for Bitcoin?
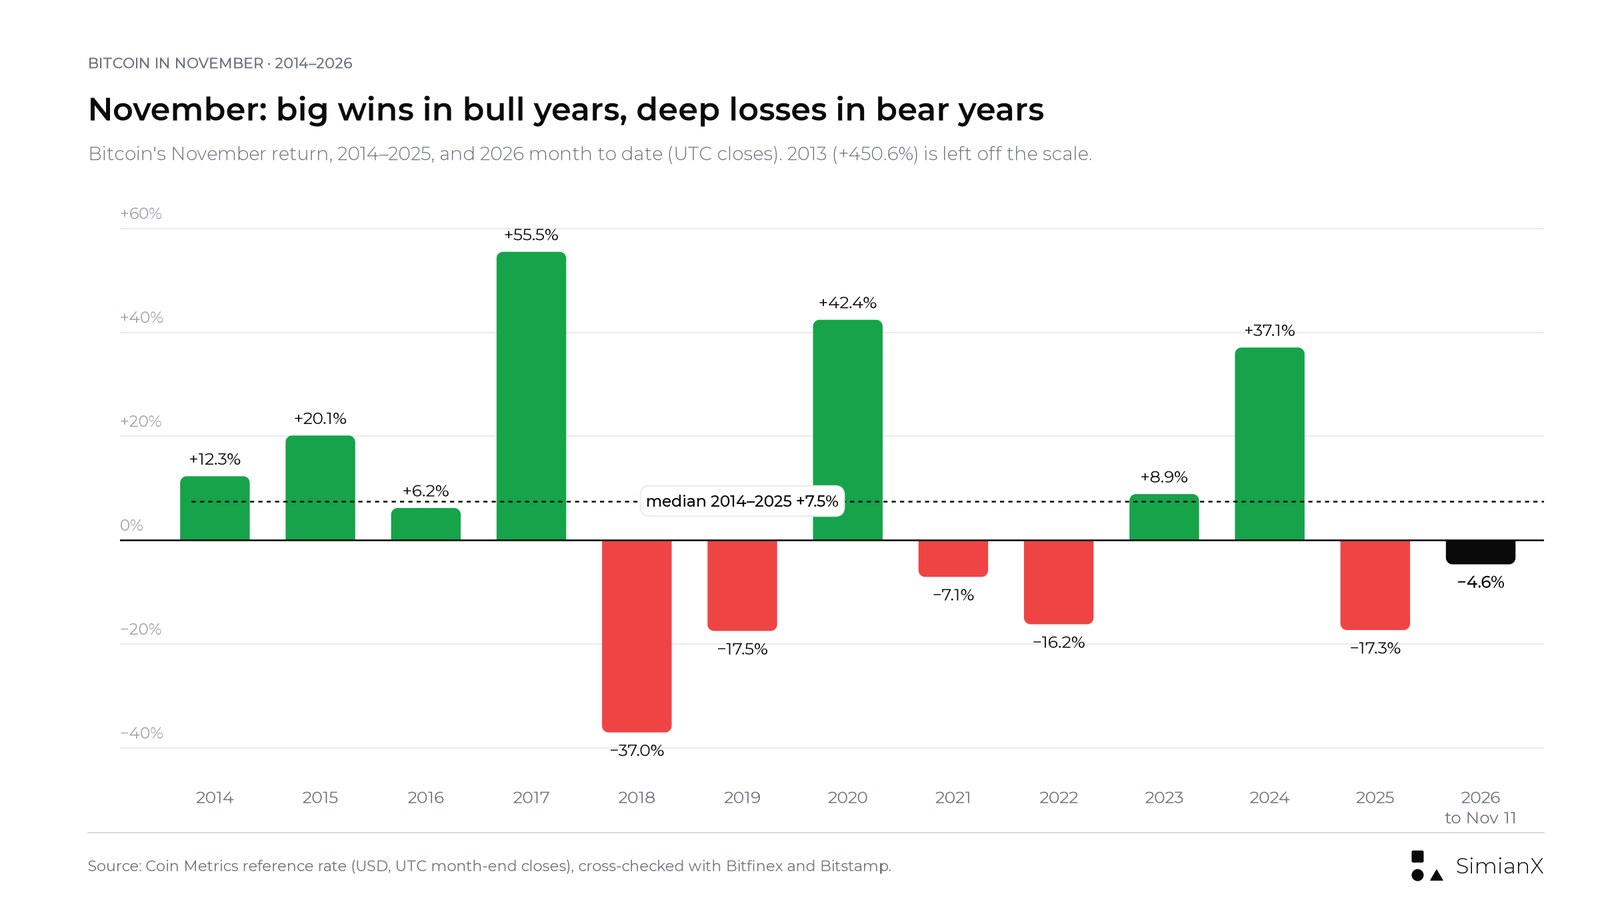
On the full record, yes: November has the highest average (+41.4%) and the fourth-highest median (+8.9%) of any month, and it closed higher in 8 of 13 years. But the details are less comfortable than the headline.
- The average is one month. Without November 2013 (+450.6%), the November average falls to +7.3%, and the median for 2014–2025 is +7.5%.
- Recent Novembers have been weak. Since 2019, November rose in only 3 of 7 years (2020, 2023, 2024) and its median was −7.1%.
- November amplifies the trend. The biggest gains came in strong bull years (2013, 2017, 2020, 2024); the deepest loss, −37.0% in November 2018, came in a bear market, when Bitcoin fell from $6,306 to $3,973.
The table puts each November next to where Bitcoin stood at the end of October:
| Year | Price on Oct 31 | Change Jan 1–Oct 31 | Below record close on Oct 31 | November return | December return |
|---|---|---|---|---|---|
| 2013 | $203.28 | +1,401% | −11.9% | +450.6% | −34.8% |
| 2014 | $337.18 | −53.8% | −70.3% | +12.3% | −15.3% |
| 2015 | $314.12 | −2.0% | −72.3% | +20.1% | +13.9% |
| 2016 | $698.90 | +62.7% | −38.4% | +6.2% | +30.6% |
| 2017 | $6,429 | +563.4% | at record | +55.5% | +39.3% |
| 2018 | $6,306 | −54.7% | −67.9% | −37.0% | −7.2% |
| 2019 | $9,155 | +148.3% | −53.4% | −17.5% | −5.1% |
| 2020 | $13,807 | +92.6% | −29.7% | +42.4% | +47.6% |
| 2021 | $61,433 | +111.7% | −7.0% | −7.1% | −18.8% |
| 2022 | $20,491 | −55.8% | −69.7% | −16.2% | −3.8% |
| 2023 | $34,636 | +109.6% | −48.7% | +8.9% | +11.9% |
| 2024 | $70,367 | +66.7% | −3.7% | +37.1% | −3.2% |
| 2025 | $109,554 | +17.3% | −12.2% | −17.3% | −3.4% |
| 2026 | $77,401 | −11.6% | −38.0% | −4.6% (to Nov 11) | — |
Two cuts of this table are relevant to 2026:
- After a red October, which 2026 had (−7.4%), November was +12.3% (2014), −37.0% (2018) and −17.3% (2025). That is three cases, too few to draw a rule from.
- When Bitcoin was down for the year at the end of October, as it was in 2026 (−11.6%), November was +12.3% (2014), +20.1% (2015), −37.0% (2018) and −16.2% (2022): two up, two down.
For comparison, November is also the best month for U.S. stocks: the S&P 500 has averaged +1.9% in November since 1950 and risen in 70% of years, according to our S&P 500 seasonality table. Bitcoin's November is far more volatile: its standard deviation across years is about 121 points with 2013 included.
November 2026 So Far
Bitcoin ended October 2026 at $77,401. Its daily closes in November, through November 11:
| Date (UTC close) | BTC | Change vs Oct 31 |
|---|---|---|
| Oct 31 | $77,401 | — |
| Nov 1 | $78,135 | +0.95% |
| Nov 2 | $76,681 | −0.93% |
| Nov 3 | $77,656 | +0.33% |
| Nov 4 | $80,488 | +3.99% |
| Nov 5 | $75,803 | −2.06% |
| Nov 6 | $75,827 | −2.03% |
| Nov 7 | $75,724 | −2.17% |
| Nov 8 | $74,968 | −3.14% |
| Nov 9 | $75,161 | −2.89% |
| Nov 10 | $73,661 | −4.83% |
| Nov 11 | $73,806 | −4.65% |
As of the November 11 close, Bitcoin is −4.6% for the month at $73,806. Bitfinex (−4.6%, $74,029) and Bitstamp (−4.5%, $73,915) agree within about 0.1 point. The highest close of the month so far was $80,488 on November 4. Bitcoin is 40.9% below its record close of $124,824 on October 6, 2025; how that compares with the same point in earlier cycles is covered in Bitcoin one year after its peak vs every past cycle.
With 19 days left, the November 2026 figure can still change a great deal. In past Novembers the gap between the best and worst years was more than 90 points even without 2013.
Bitcoin in 2026, Month by Month
| Month-end (UTC) | BTC close | Monthly return |
|---|---|---|
| Dec 31, 2025 | $87,517 | — |
| Jan 31, 2026 | $78,702 | −10.1% |
| Feb 28, 2026 | $66,966 | −14.9% |
| Mar 31, 2026 | $68,215 | +1.9% |
| Apr 30, 2026 | $76,300 | +11.9% |
| May 31, 2026 | $73,600 | −3.5% |
| Jun 30, 2026 | $58,525 | −20.5% |
| Jul 31, 2026 | $62,875 | +7.4% |
| Aug 31, 2026 | $78,534 | +24.9% |
| Sep 30, 2026 | $83,580 | +6.4% |
| Oct 31, 2026 | $77,401 | −7.4% |
| Nov 11, 2026 (month to date) | $73,806 | −4.6% |
2026 has been a year of large swings in both directions. Bitcoin fell in January and February, recovered in March and April, and then dropped 20.5% in June to its lowest close of the year ($58,525 on June 30). July, August and September were all higher, with August's +24.9% the best month of the year, before October and early November gave back part of the rally. Five of ten completed months were higher. By quarter, the same closes give −22.1% for Q1, −14.2% for Q2 and +42.8% for Q3.
Seasonality vs. the Halving Cycle
Calendar months explain less of Bitcoin's monthly returns than the four-year halving cycle does. Count positive months by year:
- In the big up years, most months were positive: 2013 (8 of 12), 2017 (9 of 12), 2020 (8 of 12) and 2023 (9 of 12).
- In the years after a cycle top, few were: 2014 (4 of 12), 2018 (3 of 12) and 2022 (4 of 12).
- In 2026, 5 of 10 completed months were higher.
Put differently, an "average October" mixes years like 2017 (+48.3%) with years like 2014 (−13.4%). Seasonality numbers are best read together with the year-level picture in our Bitcoin returns by year table and the quarter-level picture in the quarterly returns table.
How to Read Bitcoin Seasonality Data
- The samples are small. Each calendar month has only 13 or 14 observations. A single year can move a month's average by tens of points, and patterns can break: October was positive in six straight years (2019–2024) before turning negative in 2025 and 2026.
- Use the median and the hit rate, not only the average. Bitcoin's monthly returns are highly skewed. The average month since 2013 is +9.6%, but the median month is +3.0%.
- Month-end prices depend on the time and the source. Bitcoin trades around the clock, so a "monthly close" is defined by a time zone. This page uses 00:00 UTC. Exchanges and data providers can differ by a point or more in a given month, mostly before 2018.
- Seasonality is not a forecast. Past monthly patterns describe what happened; they do not set what will happen in any particular month.
If you want to see how AI models read Bitcoin right now, rather than how it behaved in past Novembers, you can open a live AI analysis of BTC or compare models on the crypto AI model leaderboard.
FAQ
What is the best month for Bitcoin?
By median return since 2013, October: +13.0%, with Bitcoin higher in 10 of 14 Octobers. By average return, November is highest (+41.4%), but only because of November 2013 (+450.6%); without 2013, October's average (+14.7%) is the highest.
What is the worst month for Bitcoin?
August, by median return (−7.5%, higher in only 5 of 14 years). September is the only month besides June with both a negative average and a negative median (−2.5% and −2.4%). The worst single month was June 2022 (−39.3%).
Is November a good month for Bitcoin?
Historically, it has been better than most: median +8.9%, higher in 8 of 13 years. But since 2019 it has been higher in only 3 of 7 years, with a median of −7.1%. November 2026 is −4.6% through November 11.
How has Bitcoin done in November 2026 so far?
Bitcoin closed October at $77,401 and was at $73,806 on November 11, 2026 (UTC close), a decline of 4.6% for the month. The month's highest close so far was $80,488 on November 4.
What was Bitcoin's best month ever?
November 2013, +450.6%, when Bitcoin rose from about $203 to about $1,119. The best month since 2017 was May 2019 (+62.5%).
What was Bitcoin's worst month ever?
June 2022, −39.3%, the month Celsius froze withdrawals and Three Arrows Capital failed, a month after the collapse of Terra/LUNA. November 2018 (−37.0%) and May 2021 (−35.4%) follow.
How often does Bitcoin go up in a month?
In 91 of 166 complete months from January 2013 to October 2026, or 54.8%.
Is "Uptober" real?
In the data, October is Bitcoin's strongest month: median +13.0%, higher in 10 of 14 years. But October 2025 (−3.9%) and October 2026 (−7.4%) were both negative.
Why do other sites show different monthly returns?
Sites use different closing times (UTC midnight vs. a U.S. close), different price sources (a single exchange vs. an index) and, before 2018, exchanges whose prices differed by several percent. The months where our sources differ by more than one point are listed below.
Methodology and sources
- Prices: the Coin Metrics community reference rate for BTC in U.S. dollars at the end of each UTC day (00:00 UTC), downloaded on November 11, 2026.
- Monthly return: the change from the last daily close of the previous month to the last daily close of the month. November 2026 runs from the October 31 close to the November 11 close. Calendar-year returns use the December 31 closes.
- Cross-checks: every monthly return was recomputed from Bitfinex daily candles (163 months, April 2013 to October 2026) and Bitstamp daily candles (all 166 months). Since August 2022 every month agrees within one point in all three sources.
- Where sources differ by more than one point: Bitstamp gives January–March 2013 as +54.5%, +63.9% and +186.8% (Bitfinex has no data before April 2013). For May 2017, Coin Metrics gives +66.4%, Bitfinex +52.7% and Bitstamp +70.2%; for May 2019, Coin Metrics +62.5% and Bitstamp agree within a point, while Bitfinex shows +52.4%. Bitfinex prices differed from other exchanges by several percent at some month-ends in 2017 and 2019 (on April 30, 2019, its close was 6.3% above the Coin Metrics rate), which also explains its higher April 2017 (+32.7%) and April 2019 (+34.4%) figures. For June and July 2022, Coin Metrics gives −39.3% and +20.8%, while Bitfinex (−37.3%, +16.8%) and Bitstamp (−37.3%, +17.1%) show a smaller fall and a smaller rebound. Other gaps of 1 to 4 points occurred in 2013 and 2015–2019, plus one of 1.0 point in July 2021. The table uses Coin Metrics throughout.
- Statistics: averages and medians include every completed month; November and December have 13 observations, the other months 14. November 2026 is not included in any statistic.
- Consistency with our other tables: the same Coin Metrics closes are used in our year and quarter tables; quarterly figures computed from these monthly closes agree with the quarterly returns table within 0.2 point for every quarter it lists from 2024 to 2026.
- This page is for information only and is not investment advice.
Related reading
- Bitcoin After US Elections: Every Vote 2012–2026 (Table)
- Bitcoin returns by year: every year 2011–2026
- Bitcoin quarterly returns: full history table 2013–2026
- Bitcoin one year after its $126K peak vs every past cycle
- Every Bitcoin crash over 50%: recovery times since 2011
- Bitcoin halving cycles: complete returns reference 2012–2028
- S&P 500 seasonality: the best and worst months 1950–2026
- Crypto AI model leaderboard