 By Marcus Reeve
Solana Price History by Year: Year-End Prices and Annual Returns Since 2020
Updated November 12, 2026. Data through the November 11, 2026 close (UTC). The 2026 row will be finalized after the December 31, 2026 close.
Short answer: Solana (SOL) ended 2025 at $124.58, down 34.2% for the year. It rose in 3 of its 5 full calendar years from 2021 to 2025, with a median annual return of +87.2%. Best year: 2021, +11,199%. Worst: 2022, −94.2%, the year FTX collapsed. 2026 through November 11: −33.4%, at $82.96. Record close: $261.15 on January 18, 2025; SOL is 68.2% below it.
This page lists the Solana price by year for every year since SOL started trading in April 2020, plus 2026 to date: the year-end price, the calendar-year return, the highest and lowest daily close, and the largest decline inside each year. Every year-end price was checked against at least two independent data sources. It also compares Solana with Bitcoin and Ether year by year, gives the SOL/BTC ratio at every year-end, lists every decline of 50% or more from a record close (including the FTX crash of November 2022), and ranks the best and worst years. It uses the same conventions as our Ethereum price by year table and our Bitcoin returns by year table.
Solana historical returns at a glance
| Measure (calendar-year price return) | 2021–2025 | 2022–2025 | 2023–2025 |
|---|---|---|---|
| Years | 5 | 4 | 3 |
| Up years | 3 (60%) | 2 (50%) | 2 (67%) |
| Median annual return | +87.2% | +26.5% | +87.2% |
| Compound annual growth | +142% | −7.5% | +132% |
| Best year | +11,199% (2021) | +916% (2023) | +916% (2023) |
| Worst year | −94.2% (2022) | −94.2% (2022) | −34.2% (2025) |
Solana has only five full calendar years of trading, so every summary figure depends heavily on where you start. From $1.51 at the end of 2020 to $124.58 at the end of 2025, SOL compounded at 142% a year. From the end of 2021 ($170.53), after that year's 11,199% rally, it lost 7.5% a year: $100 bought at the end of 2021 was worth $73.05 at the end of 2025. From the end of 2022 ($9.96), the bottom of the FTX crash year, it compounded at 132% a year. The arithmetic average of the five yearly returns, +2,415%, is meaningless, because almost all of it comes from 2021.
Solana price by year: the complete table, 2020–2026
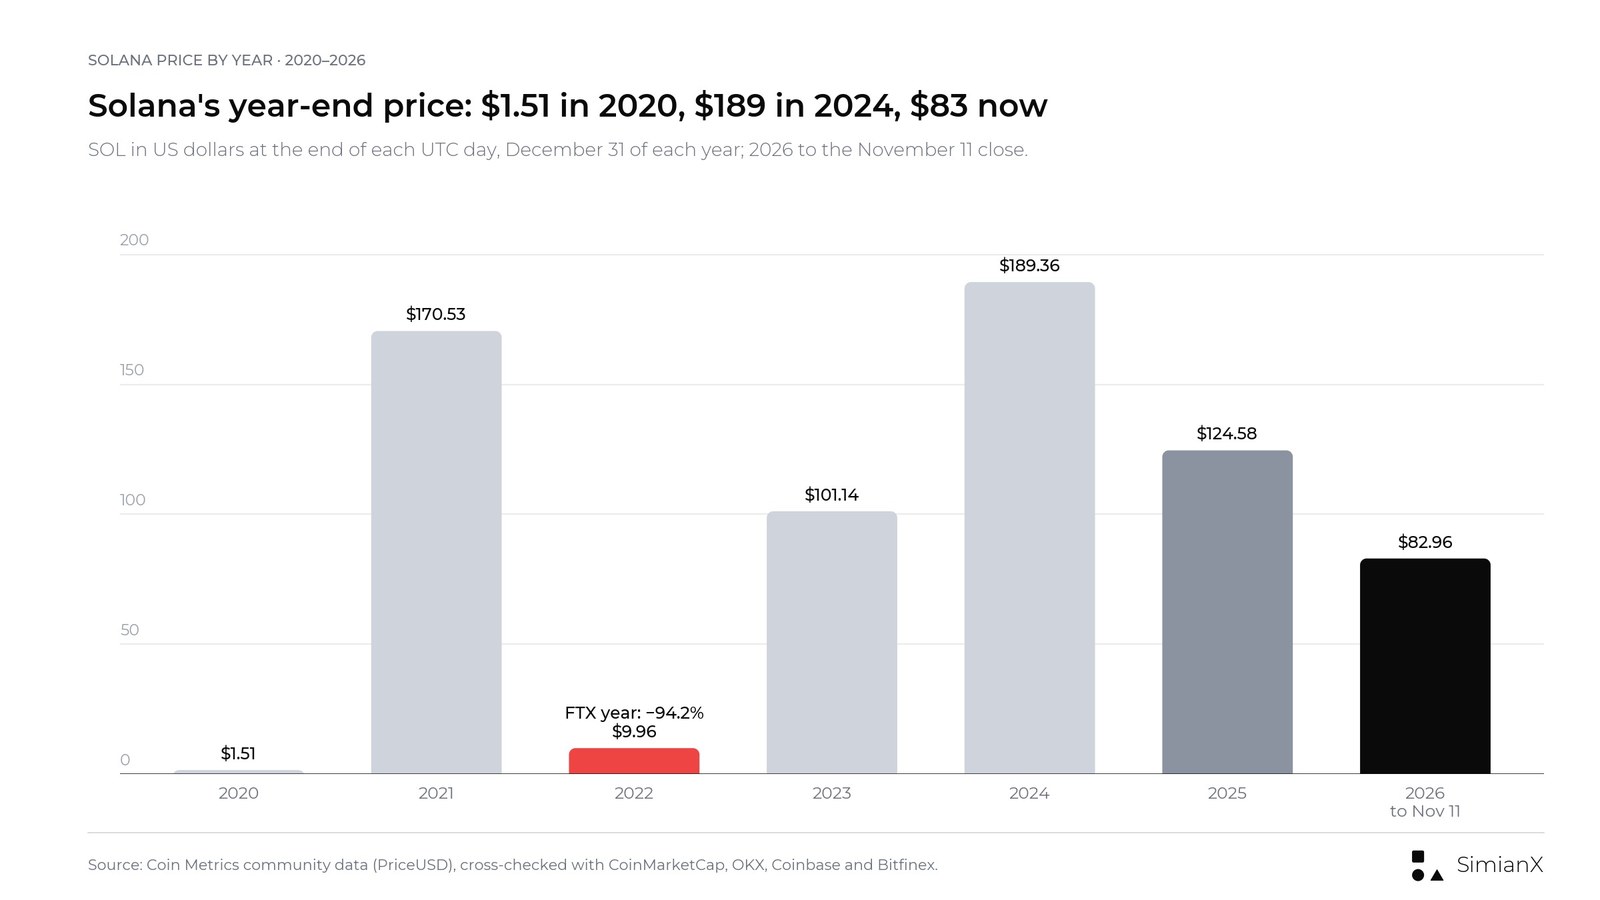
Newest first. Down years are in bold. Prices are in U.S. dollars at the end of each UTC day; "largest decline within the year" is the deepest fall from a high close to a later low close inside the calendar year, starting from the previous year-end price.
| Year | Year-end price | Calendar-year return | Highest close | Lowest close | Largest decline within the year |
|---|---|---|---|---|---|
| 2026 (to Nov 11) | $82.96 | −33.4% | $146.59 (Jan 14) | $62.07 (Jun 6) | −57.7% |
| 2025 | $124.58 | −34.2% | $261.15 (Jan 18) | $105.32 (Apr 8) | −59.7% |
| 2024 | $189.36 | +87.2% | $256.99 (Nov 21) | $83.56 (Jan 22) | −38.3% |
| 2023 | $101.14 | +916% | $120.99 (Dec 25) | $9.98 (Jan 1) | −44.7% |
| 2022 | $9.96 | −94.2% | $178.03 (Jan 1) | $9.54 (Dec 29) | −94.6% |
| 2021 | $170.53 | +11,199% | $258.30 (Nov 6) | $1.80 (Jan 2) | −57.9% |
| 2020 (from Apr 10) | $1.51 | +58.9% | $4.80 (Aug 31) | $0.52 (May 11) | −74.8% |
Notes: Year-end prices are the Coin Metrics reference rate at the end of each UTC day, cross-checked with CoinMarketCap daily closes (from April 2020), OKX SOL/USDT (from October 2020), Bitfinex SOL/USD (from February 2021), Coinbase SOL/USD (from June 2021) and, for 2024 and 2025, Kraken SOL/USD. Every year-end price agrees within 0.7% in all available sources (the widest gap is Bitfinex at the end of 2023, +0.69%). Returns for 2022 and 2025 agree within 0.2 points in every source; the other years differ by more because the moves were so large or the year-end prices sit at opposite ends of the 0.7% band: 2021 is +11,199% here, +11,171% on CoinMarketCap and +11,153% on OKX; 2023 is +916% here and +919% to +921% elsewhere; 2024 is +87.2% here and +85.7% to +86.5% elsewhere. Binance, where SOL first traded, returned HTTP 451 to our data request (it blocks requests from some regions), so its candles are not used. 2020 is a partial year. Solana's network produced its first block on March 16, 2020 (Wikipedia), but the price series starts when exchange trading began: Coin Metrics' first daily close is $0.95 on April 10, 2020 (CoinMarketCap: $0.951), so the 2020 row runs from April 10 to December 31.
Solana vs. Bitcoin and Ether by year
| Year | Solana (SOL) | Ether (ETH) | Bitcoin (BTC) | SOL/BTC at year-end | SOL/ETH at year-end | Best of the three |
|---|---|---|---|---|---|---|
| 2026 (to Nov 11) | −33.4% | −30.9% | −15.7% | 0.001124 | 0.0405 | BTC |
| 2025 | −34.2% | −10.9% | −6.3% | 0.001423 | 0.0420 | BTC |
| 2024 | +87.2% | +46.2% | +121% | 0.002028 | 0.0568 | BTC |
| 2023 | +916% | +90.7% | +155% | 0.002396 | 0.0444 | SOL |
| 2022 | −94.2% | −67.6% | −64.4% | 0.000603 | 0.0083 | BTC |
| 2021 | +11,199% | +399% | +59.7% | 0.003679 | 0.0463 | SOL |
| 2020 (from Apr 10) | +58.9% | +369% | +323% | 0.0000520 | 0.0020 | ETH |
| 2021–2025 (5 years) | Solana | Ether | Bitcoin |
|---|---|---|---|
| Up years | 3 | 3 | 3 |
| Median annual return | +87.2% | +46.2% | +59.7% |
| Best year | +11,199% (2021) | +399% (2021) | +155% (2023) |
| Worst year | −94.2% (2022) | −67.6% (2022) | −64.4% (2022) |
| $100 at the end of 2020 grew to | $8,254 | $402 | $302 |
| $100 at the end of 2021 grew to | $73 | $81 | $189 |
| $100 at the end of 2022 grew to | $1,251 | $248 | $530 |
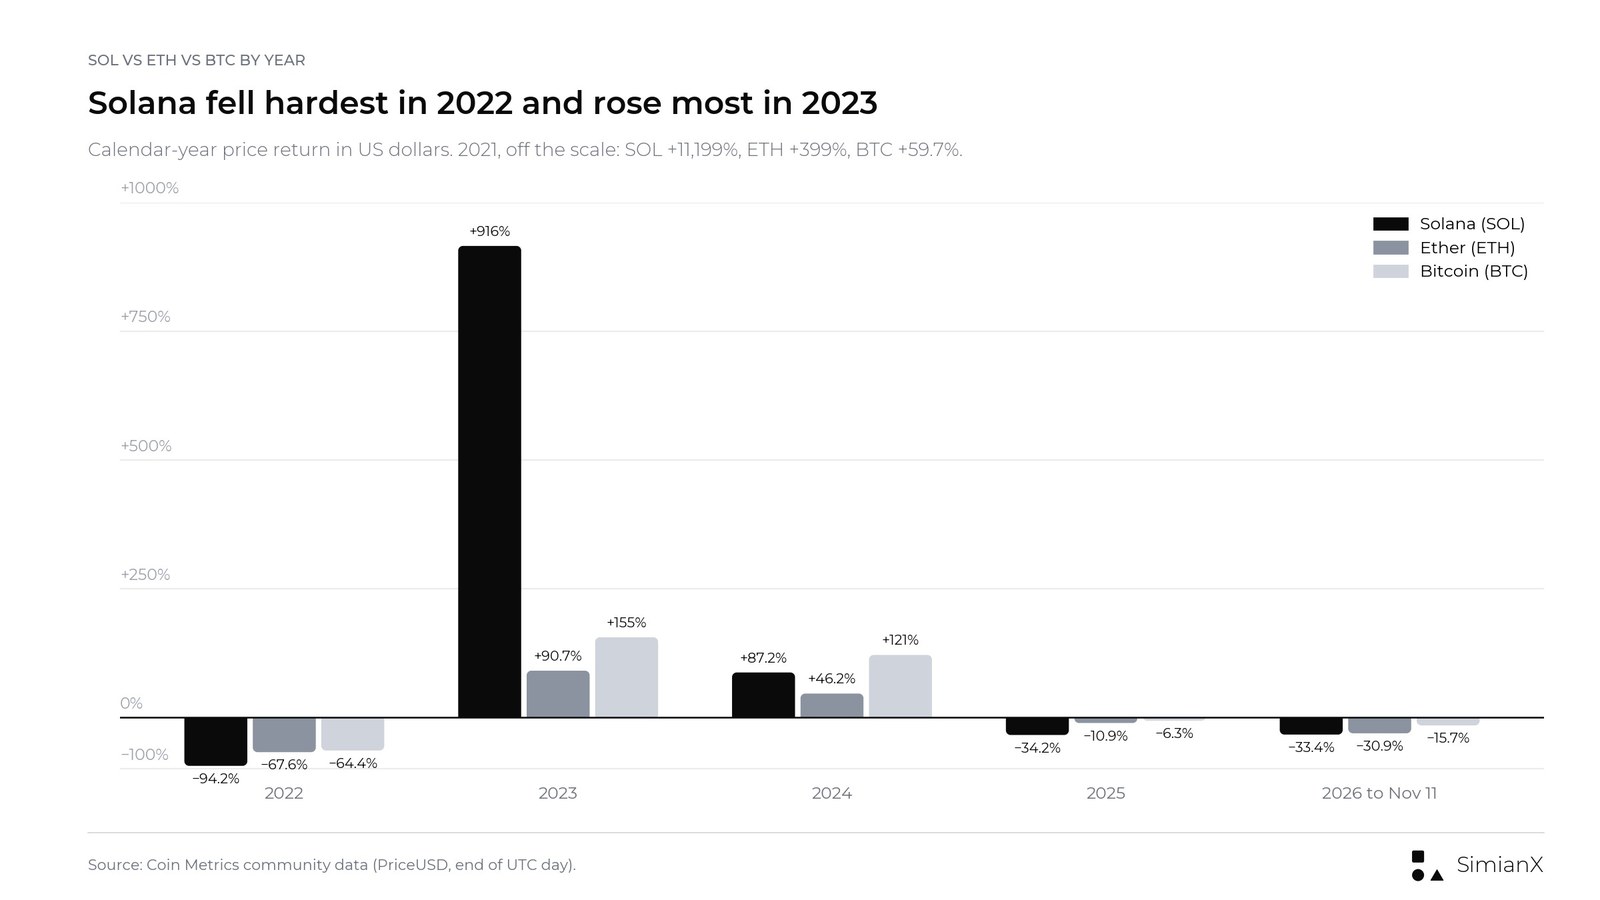
Solana beat Bitcoin in 2 of its 5 full years, 2021 and 2023, and beat Ether in 3 (2021, 2023 and 2024). In every down year it fell the most of the three: −94.2% in 2022 against −67.6% for Ether and −64.4% for Bitcoin, and −34.2% in 2025 against −10.9% and −6.3%. 2026 so far follows the same pattern, with SOL down 33.4% against 30.9% for Ether and 15.7% for Bitcoin. In its partial first year SOL rose 58.9% from April 10, while Bitcoin and Ether more than quadrupled over the same window.
The SOL/BTC column shows the same swings as a price. One SOL bought 0.000052 bitcoin at the end of 2020 and 0.003679 at the end of 2021; the ratio's record, 0.004203, came on November 6, 2021, the same day as SOL's 2021 record close. It fell to 0.000603 by the end of 2022, and its lowest close since that 2021 peak was 0.000532 on June 28, 2023. On November 11, 2026 it stood at 0.001124, 73% below the 2021 record. Against Ether, SOL peaked at 0.0868 ETH on April 20, 2025 and was at 0.0405 on November 11, 2026. How these rotations fit Bitcoin's dominance cycle is in our altcoin season history.
The start date decides which asset looks better. From the end of 2020, $100 in SOL grew to $8,254 by the end of 2025, against $402 in Ether and $302 in Bitcoin. From the end of 2021, the order reverses: Bitcoin turned $100 into $189, Ether into $81 and Solana into $73.
Every Solana decline of 50% or more from a record
| Record close (peak) | Lowest close after it | Decline | Days to the low | Next record close | Peak to next record |
|---|---|---|---|---|---|
| August 31, 2020: $4.80 | December 23, 2020: $1.21 | −74.8% | 114 | February 2, 2021 | 155 days |
| May 18, 2021: $56.07 | July 20, 2021: $23.59 | −57.9% | 63 | August 16, 2021 | 90 days |
| November 6, 2021: $258.30 | December 29, 2022: $9.54 | −96.3% | 418 | January 18, 2025 | 3.2 years |
| January 18, 2025: $261.15 | June 6, 2026: $62.07 | −76.2% | 504 | not yet (−68.2% on November 11, 2026) | — |
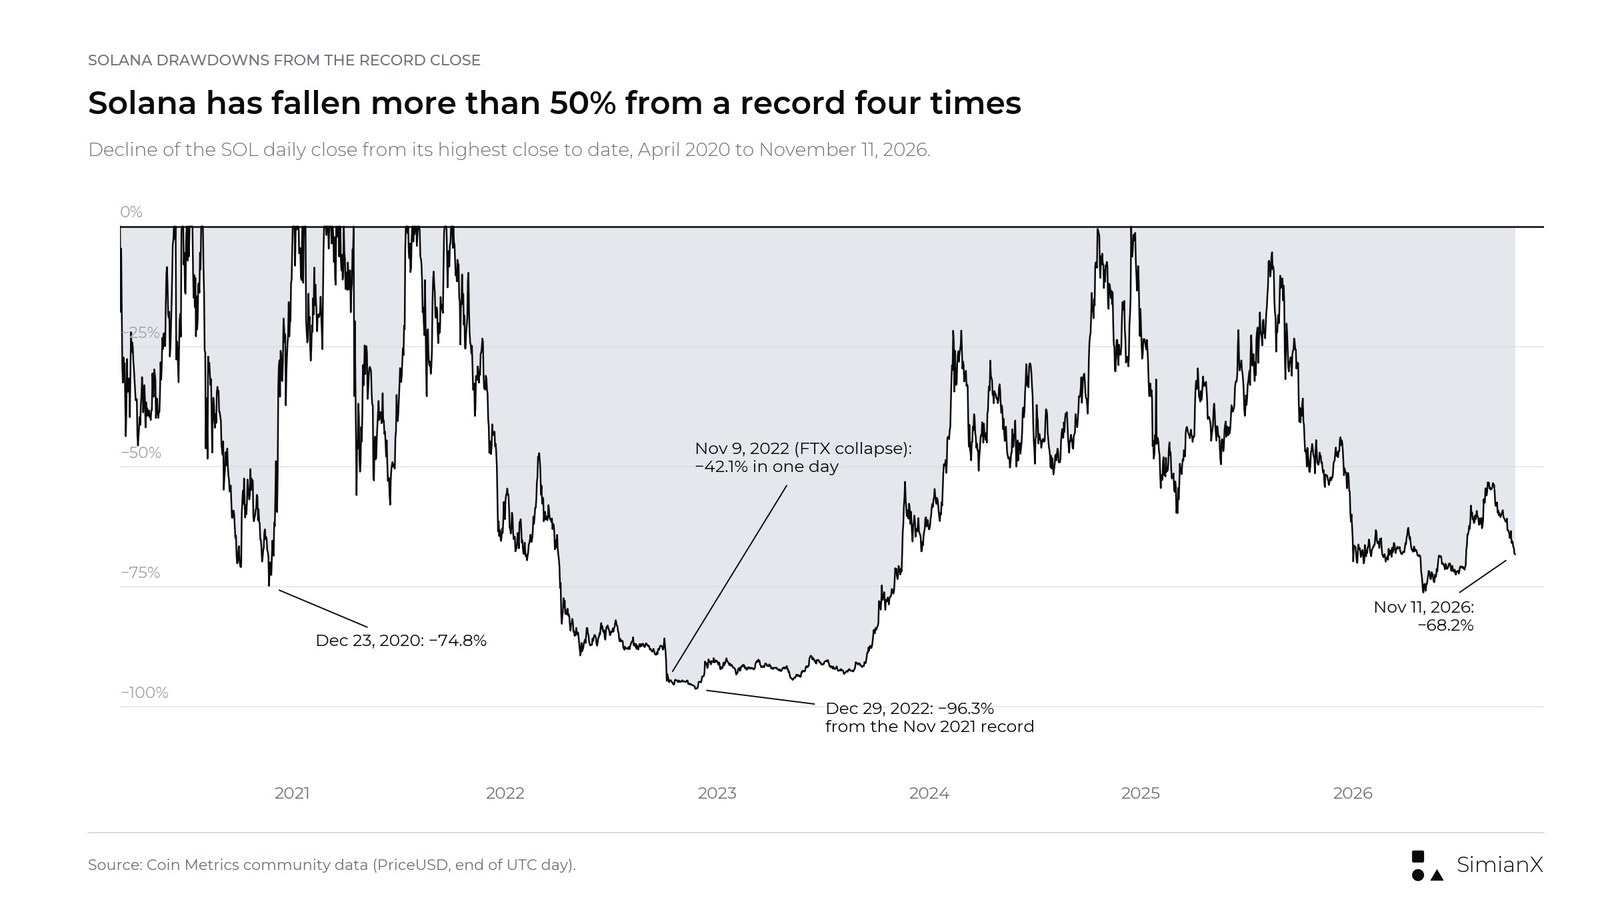
Solana has fallen at least 50% from a record close four times in six and a half years. The deepest was the 2021–2022 bear market: from $258.30 on November 6, 2021 to $9.54 on December 29, 2022, a fall of 96.3% that took 418 days. On intraday prices the low was lower still: $8.00 on Coinbase and $7.86 on OKX on December 29, 2022. It then took until January 18, 2025, 3.2 years after the 2021 peak, to close at a new record, and that close, $261.15, beat the 2021 record by only 1.1%. Intraday the high was $295 on Coinbase and $295.90 on OKX on January 19, 2025, when the close was lower.
The current decline is the second deepest. From January 18, 2025 SOL fell 76.2% to $62.07 on June 6, 2026, recovered to $118.08 at the end of September, and was at $82.96 on November 11, 2026, 68.2% below the record. Getting back to $261.15 would take a gain of 215%. Bitcoin's falls of 50% or more, with their recovery times, are in our Bitcoin crash history; Ether's are in the Ethereum price by year table.
The FTX crash: Solana's November 2022 in numbers
No single event shows up in Solana's price history like the collapse of FTX. SOL tokens were Alameda Research's second-largest holding at the time, according to Fortune, and the price fell as traders expected those tokens to be sold. The daily closes:
| Date (2022) | SOL close | Change from Nov 5 | Bitcoin | Ether |
|---|---|---|---|---|
| November 5 | $36.77 | — | $21,283 | $1,627 |
| November 7 | $29.51 | −19.7% | $20,569 | $1,567 |
| November 8 | $24.02 | −34.7% | $18,521 | $1,332 |
| November 9 | $13.91 | −62.2% | $15,758 | $1,093 |
| November 11 (FTX files for bankruptcy) | $16.09 | −56.2% | $16,917 | $1,281 |
| November 21 | $11.86 | −67.7% | $15,778 | $1,108 |
| December 29 (year low) | $9.54 | −74.1% | $16,631 | $1,201 |
On November 9, 2022 alone, SOL closed 42.1% below the previous day. In the four days from November 5 to November 9 it lost 62.2%, against 26.0% for Bitcoin and 32.8% for Ether. Bitcoin and Ether made their lows of the episode on November 9 and then stabilized; SOL kept falling to the end of the year. That is why 2022 is the worst calendar year in this table, −94.2%, and why the next year, starting from $9.96, produced the +916% of 2023. The FTX estate's later payouts depended partly on that recovery: Wikipedia's account of the FTX bankruptcy notes that Solana's 2023 recovery made it possible to pay customers back. The theft of about $477 million from FTX's wallets on November 12, 2022 is in our ranking of the biggest crypto exchange hacks, and Bitcoin's side of the 2022 bear market is in our crash history.
Solana's best and worst years
The best calendar years were 2021 (+11,199%), 2023 (+916%) and 2024 (+87.2%). The worst were 2022 (−94.2%) and 2025 (−34.2%). SOL fell in 2 of its 5 full years, and 2026, down 33.4% through November 11, would be the first time it fell in two years in a row if it ends lower.
Every year contained a deep fall. The median largest decline inside a calendar year from 2021 to 2025 was 57.9%, and 3 of the 5 years had a decline of more than 50%. In 2021 SOL gained 11,199% but fell 57.9% between May 18 and July 20; in 2024 it rose 87.2% after a 38.3% fall between March 31 and September 6.
Network events sit inside the table. The blockchain went offline for about 17 hours from September 14, 2021, and again on May 1, May 31 and October 1, 2022 (Wikipedia). About 9,231 wallets were drained in a hack on August 3, 2022. In June 2023 the SEC's suit against Coinbase named SOL among the tokens it called securities. 2021 was the best year despite the September outage; 2022 combined three outages, the wallet hack and FTX.
2026 so far
Through November 11, 2026, Solana stood at $82.96, down 33.4% from its 2025 year-end price of $124.58. Its highest close of the year was $146.59 on January 14; its lowest, $62.07 on June 6, a decline of 57.7% inside the year and 50.2% below the 2025 year-end. SOL closed below $85 at the end of every month from February to July, rallied to $103.03 at the end of August and $118.08 at the end of September, then fell back to $95.29 at the end of October.
Over the same period Bitcoin lost 15.7% (to $73,806) and Ether 30.9% (to $2,050). One SOL bought 0.001124 bitcoin on November 11, against 0.001423 at the end of 2025. On the same date in earlier years SOL was down 90.6% (2022) and 18.1% (2025). CoinMarketCap ($83.32), Coinbase ($83.18), Bitfinex ($83.26), OKX ($83.28) and Kraken ($83.19) put the November 11 close within 0.5% of the Coin Metrics rate. Live analysis of the current market is on the Solana page of the SimianX crypto leaderboard, where AI models analyze SOL alongside Bitcoin and Ether; Market Pulse scores crypto-moving news as it breaks, and you can run your own live analysis session. The price zones we discussed earlier this year are in BTC vs. ETH vs. SOL: best buy zones in the 2026 dip.
How to read Solana's historical returns
- The start date dominates the answer. From the end of 2020, SOL compounded at 142% a year; from the end of 2021, at −7.5%; from the end of 2022, at +132%. Quoting a Solana return without its period says little.
- Five full years is a short record. Bitcoin has fifteen full calendar years and Ether ten; Solana has five, one of them a 94% loss. Medians and averages over five numbers move a lot when one year changes.
- Averages mislead more than medians. 2021 alone (+11,199%) lifts the five-year arithmetic average above +2,400%.
- Calendar years hide the path. Every full year had a decline of at least 38%, and three of five had a decline of more than 50%.
- Returns are in nominal U.S. dollars, price only. Inflation is not removed, and staking rewards, which most SOL holders can earn, are not included.
Frequently asked questions
What was the price of Solana at the end of each year?
$1.51 (2020), $170.53 (2021), $9.96 (2022), $101.14 (2023), $189.36 (2024) and $124.58 (2025). On November 11, 2026 it was $82.96.
What was Solana's price in 2020?
SOL started trading in April 2020. The first daily close in the Coin Metrics series was $0.95 (April 10); the lowest close of the year was $0.52 on May 11, the highest $4.80 on August 31, and the year ended at $1.51, up 58.9% from April 10.
What was Solana's price in 2021?
It started the year at about $1.51 and ended it at $170.53, a gain of 11,199%. The highest close of 2021, and the record until 2025, was $258.30 on November 6.
How much did Solana fall after FTX?
From $36.77 on November 5, 2022 to $13.91 on November 9 (−62.2%), including −42.1% on November 9 alone, and to $9.54 by December 29 (−74.1% from November 5). From its November 2021 record it fell 96.3%.
What was Solana's best year?
2021, at +11,199%. The next best were 2023 (+916%) and 2024 (+87.2%).
What was Solana's worst year?
2022, at −94.2% (from $170.53 to $9.96). The other down year was 2025 (−34.2%).
Has Solana beaten Bitcoin?
In 2 of 5 full years (2021 and 2023). From the end of 2020, SOL gained far more ($100 grew to $8,254 vs. $302); from the end of 2021, Bitcoin did better ($189 vs. $73).
What is Solana's highest price ever?
The record daily close is $261.15 on January 18, 2025, just above the $258.30 of November 6, 2021. The intraday high was $295 on Coinbase ($295.90 on OKX) on January 19, 2025.
What is the SOL/BTC ratio by year?
At year-end: 0.000052 (2020), 0.003679 (2021), 0.000603 (2022), 0.002396 (2023), 0.002028 (2024) and 0.001423 (2025). On November 11, 2026 it was 0.001124; its record was 0.004203 on November 6, 2021.
Methodology and sources
- Solana prices are the Coin Metrics community reference rate in U.S. dollars at the end of each UTC day. Each year-end price was cross-checked against CoinMarketCap daily closes, OKX SOL/USDT daily candles (from October 2020), Bitfinex SOL/USD (from February 2021), Coinbase SOL/USD (from June 2021) and Kraken SOL/USD (2024–2026). Intraday highs and lows are from Coinbase and OKX candles.
- Returns are calendar-year changes from the December 31 price of the previous year to the December 31 price of the year; 2020 runs from the first daily close (April 10, 2020). Highest and lowest closes and declines within the year use the same daily series. The decline table lists every fall of 50% or more from a record close before the next record.
- Bitcoin and Ether returns and the SOL/BTC and SOL/ETH ratios use Coin Metrics' BTC and ETH reference rates on the same dates; for 2020 they are measured over the same April 10 to December 31 window.
- Network events (first block, outages, wallet hack, SEC suit) and Alameda's holding are from Wikipedia and the sources it cites.
- Data compiled November 12, 2026, to the November 11 close. This page is for information only and is not investment advice.
Related Reading
- Ethereum Price by Year: Every Year 2015–2026 Returns Table
- Bitcoin Returns by Year: Every Year 2011–2026 Table
- BTC vs ETH vs SOL: Best Buy Zones in the 2026 Crypto Dip
- Altcoin Season History: Bitcoin Dominance Cycles 2017-2026
- Biggest Crypto Exchange Hacks: Every Major Theft, Ranked
- Every Bitcoin Crash Over 50%: Recovery Times Since 2011
- Crypto cycles: all SimianX reference pages
References
- Coin Metrics — Community network data (SOL PriceUSD)
- CoinMarketCap — Solana historical data
- OKX — SOL/USDT
- Coinbase — Solana price
- Bitfinex — SOL/USD
- Kraken — Solana price
- Wikipedia — Solana (blockchain platform)
- Wikipedia — Bankruptcy of FTX
- Fortune — How will the Binance-FTX drama affect Solana? (Nov 9, 2022)
- Solana — official site