
 By Marcus Reeve
Bitcoin After US Elections: Every Midterm and Presidential Vote, 2012–2026
Updated November 11, 2026. Prices are daily UTC closes through November 11, 2026.
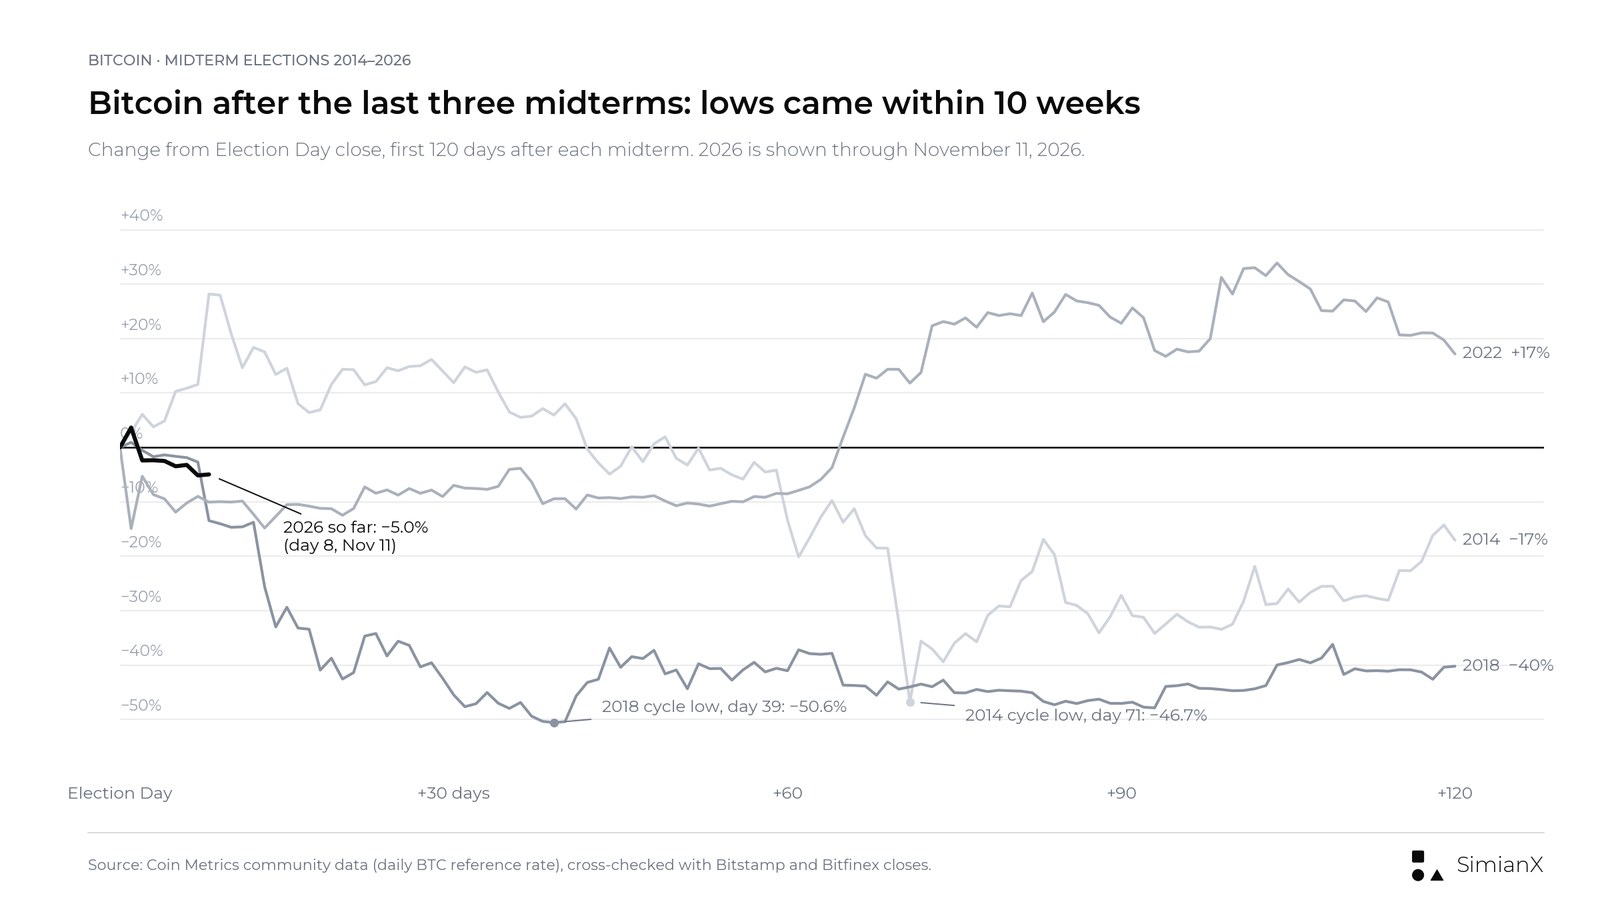
Quick answer: how has Bitcoin done after US elections? In the four presidential elections since 2012, Bitcoin was higher 1 week, 1 month, 3 months, 6 months and 12 months after every one of them; the median 12-month gain was about +648%. The three midterms were different: Bitcoin was lower 3 months after two of the three (2014 −31.2%, 2018 −47.7%; 2022 +23.8%), but higher 12 months after all three (+23.0%, +45.2%, +93.3%). In each past midterm, the bear-market low arrived within about ten weeks of the vote. After the 2026 midterm (November 3), Bitcoin is −5.0% as of the November 11 close ($73,806 vs $77,656). The sample is seven completed elections, and the timing of the halving cycle explains most of the split. Treat this as history, not a forecast.
People search "what happens to Bitcoin after the election" every two years. The honest answer is a table, so this page gives one: Bitcoin's return 1 week, 1 month, 3 months, 6 months and 12 months after every US Election Day since 2012, including the four presidential votes (2012, 2016, 2020, 2024) and the four midterms (2014, 2018, 2022, 2026). Every number comes from one consistent daily price series and has been checked against at least one exchange.
It is a companion to our stock-market work on the same question. For the S&P 500 after every midterm since 1950, see Stock Market After Midterm Elections: 2026 vs Every Cycle, and for how the 2026 result itself hit stocks, see Stock Market Reaction to 2026 Midterms.
Bitcoin Returns After Every US Election: The Full Table
Base price = the Bitcoin daily close on Election Day (a UTC close, about 7 p.m. Eastern, before most results were known). Each window ends on the close of the same calendar date 1 week, 1, 3, 6 or 12 months later.
| Election | Type | Result | Election Day close | 1 week | 1 month | 3 months | 6 months | 12 months |
|---|---|---|---|---|---|---|---|---|
| Nov 6, 2012 | Presidential | Obama re-elected | $10.87 | +1.2% | +24.0% | +95.1% | +931.6% | +2,321.8% |
| Nov 4, 2014 | Midterm | Republicans win the Senate | $329.66 | +11.6% | +11.9% | −31.2% | −27.5% | +23.0% |
| Nov 8, 2016 | Presidential | Trump elected | $711.84 | +0.1% | +7.8% | +47.8% | +136.7% | +946.8% |
| Nov 6, 2018 | Midterm | Democrats win the House | $6,441 | −2.7% | −45.5% | −47.7% | −11.6% | +45.2% |
| Nov 3, 2020 | Presidential | Biden elected | $13,997 | +9.4% | +39.1% | +168.5% | +309.0% | +349.8% |
| Nov 8, 2022 | Midterm | Republicans win the House | $18,521 | −9.0% | −7.0% | +23.8% | +49.7% | +93.3% |
| Nov 5, 2024 | Presidential | Trump elected | $69,538 | +26.6% | +39.4% | +38.9% | +36.4% | +49.4% |
| Nov 3, 2026 | Midterm | Democrats win House and Senate | $77,656 | −5.1% | due Dec 3 | due Feb 3, 2027 | due May 3, 2027 | due Nov 3, 2027 |
Source: Coin Metrics community data (BTC reference rate, daily). Bitstamp closes agree with every cell to within 3 percentage points except the extreme 2012 and 2016 6–12 month windows, where the gap is a few points on gains of several hundred percent. Bitfinex closes (available from 2013) agree within 3 points except the 2018 6-month window (−7.6% vs −11.6%), when Bitfinex traded at a premium to other venues. The 2026 row runs through the November 11, 2026 close.
Three things stand out before any interpretation:
- Presidential years: 20 of 20 windows positive. Every window after every presidential vote ended higher.
- Midterms: weak first quarter, strong first year. After 3 months, two of three midterms were down by 30% or more. After 12 months, all three were up.
- 2026 has started like the weaker midterms. One week in, it is −5.1% (November 10 close): weaker than the first week after 2014 (+11.6%) and 2018 (−2.7%), better than 2022 (−9.0%).
Presidential vs Midterm Elections: Averages and Medians
| Window | Presidential average (n=4) | Presidential median | Positive | Midterm average (n=3) | Midterm median | Positive |
|---|---|---|---|---|---|---|
| 1 week | +9.3% | +5.3% | 4 of 4 | 0.0% | −2.7% | 1 of 3 |
| 1 month | +27.6% | +31.6% | 4 of 4 | −13.5% | −7.0% | 1 of 3 |
| 3 months | +87.6% | +71.4% | 4 of 4 | −18.4% | −31.2% | 1 of 3 |
| 6 months | +353.4% | +222.8% | 4 of 4 | +3.5% | −11.6% | 1 of 3 |
| 12 months | +917.0% | +648.3% | 4 of 4 | +53.8% | +45.2% | 3 of 3 |
Midterm figures exclude 2026, which has only a 1-week result so far. Including it, midterms were up in 1 of 4 first weeks.
Averages are almost useless with numbers this lopsided: the 2012 row alone, from a $10.87 base in a tiny market, pulls the presidential 12-month average above +900%. Medians are a better read, and even the median here rests on three or four observations.

Bitcoin After Midterm Elections: 2014, 2018 and 2022
Each of the last three midterms arrived late in a Bitcoin bear market, and each one was followed within weeks by that bear market's final low.
- 2014 (Republicans took the Senate). Bitcoin closed at $329.66 on November 4, about 71% below its December 2013 record close of $1,135. It rallied 28% to $422.59 within eight days, then slid to $175.64 on January 14, 2015, day 71 after the vote and −46.7% from Election Day. That was the low of the cycle. The market was still digesting the collapse of Mt. Gox earlier that year.
- 2018 (Democrats took the House). Bitcoin closed at $6,441, about 67% below its December 2017 record. In mid-November, around the Bitcoin Cash hard fork and hash war of November 15, Bitcoin broke below $6,000, and Bitcoin fell to $3,185 on December 15, 2018, day 39 and −50.6% from Election Day. Again, that was the cycle low.
- 2022 (Republicans took the House, Democrats kept the Senate). Election Day coincided with the collapse of FTX. Bitcoin fell 14.9% the next day to $15,758, the lowest close of the cycle on Coin Metrics data. Twelve months later it was up 93.3%.
In all three cases, the election was not the cause. The crashes in 2014 and 2022 were driven by exchange failures, and the 2018 leg by a fork dispute. What the three share is timing: each midterm landed between about 10½ and 12 months after a cycle top, the same point at which, as our one-year-after-the-peak study shows, every past Bitcoin bear market made its final low.
Bitcoin After Presidential Elections: 2012, 2016, 2020 and 2024
Presidential elections have fallen in the opposite part of the cycle: close to a halving and early in a bull market.
- 2012 (Obama). The vote came 22 days before the first halving (November 28, 2012). Bitcoin was $10.87; a year later it was $263.21. Treat this row as indicative only: 2012 was a thin market dominated by Mt. Gox, a venue that no longer exists, so the reconstructed daily series is less reliable. Coin Metrics ($10.87) and Bitstamp ($10.74) still agree to within about 1% on the base.
- 2016 (Trump). Bitcoin was flat in the first week (+0.1%) and only +7.8% after a month, but +946.8% after a year, at $7,451 on November 8, 2017, on the way to the December 2017 top.
- 2020 (Biden). Bitcoin was still about 29% below its 2017 record on Election Day. It reclaimed that record within weeks and was +168.5% after 3 months and +349.8% after a year.
- 2024 (Trump). The fastest start in the table: +8.9% the next day and +26.6% in a week, as markets priced a more crypto-friendly administration and Congress. The 3- and 6-month numbers (+38.9%, +36.4%) show the gains then stalled. Bitcoin went on to set its record close on October 6, 2025, 11 months after the vote, and was +49.4% after a year.
So the presidential record is 4 for 4 and the gains are large. Before treating that as a rule, look at where each vote sat in the halving cycle.
Why the Pattern Is Mostly the Halving Cycle
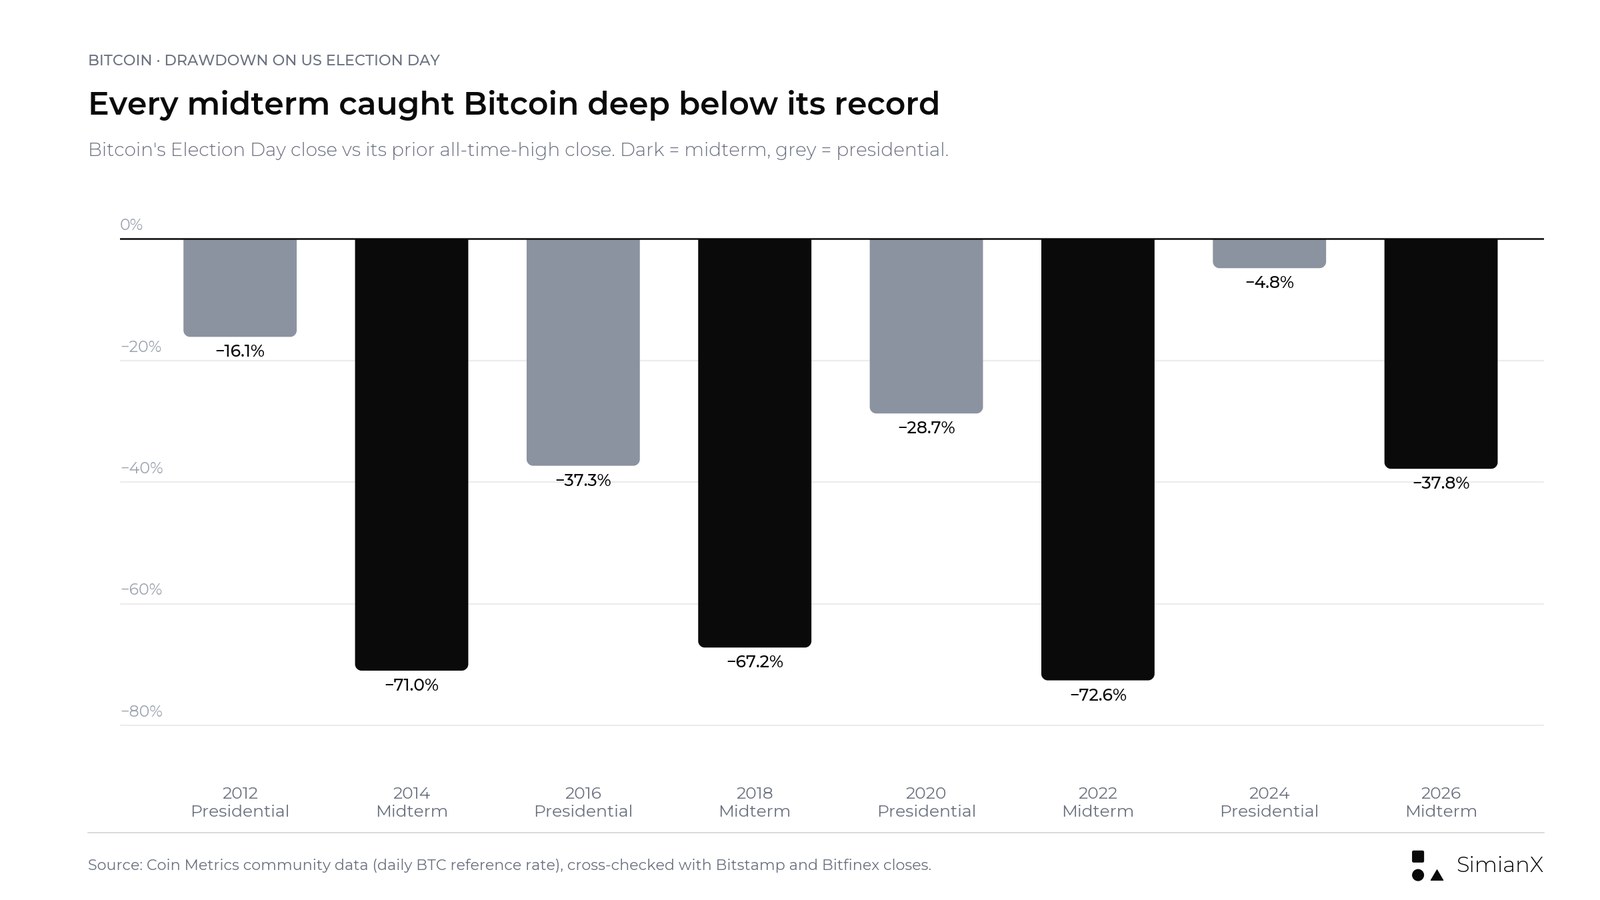
US elections run on a 2-year clock, and so, roughly, does each half of Bitcoin's 4-year halving cycle. Every presidential vote since 2012 has fallen within about 6½ months of a halving, and every midterm has fallen about 2 to 2½ years after one.
| Election | Type | Days since last halving | Days to next halving | BTC vs prior record close on Election Day |
|---|---|---|---|---|
| 2012 | Presidential | none yet (first halving 22 days later) | 22 | −16.1% |
| 2014 | Midterm | 706 | 613 | −71.0% |
| 2016 | Presidential | 122 | 1,280 | −37.3% |
| 2018 | Midterm | 850 | 552 | −67.2% |
| 2020 | Presidential | 176 | 1,264 | −28.7% |
| 2022 | Midterm | 911 | 529 | −72.6% |
| 2024 | Presidential | 199 | 1,251 | −4.8% |
| 2026 | Midterm | 927 | ~520 (est. April 2028) | −37.8% |
Halving dates: November 28, 2012; July 9, 2016; May 11, 2020; April 20, 2024. The 2028 date is an estimate from current block times; see Bitcoin Halving Cycles 2012–2028.
The calendar overlap is close to perfect. Presidential years caught Bitcoin early in a post-halving bull run. Midterms caught it 10½–12 months after a cycle top, with the price down 67% to 73% from the record. Put the same returns in a halving-cycle table and you get the same split without mentioning elections at all. That is why we call this a confounded pattern: with only seven completed elections, it is impossible to separate an election effect from the halving cycle, and the halving cycle is the simpler explanation.
There is also a reason to expect the overlap to fade. The halving's supply effect shrinks every cycle, spot Bitcoin ETFs have changed who owns the asset, and the 2025 peak came with a much shallower drawdown than in the past. Bitcoin's yearly record (Bitcoin Returns by Year) already shows smaller swings in both directions since 2022.
The 2026 Midterm So Far (as of November 11, 2026)
Democrats won control of both the House and the Senate on November 3, 2026, as called by AP and NBC News early on November 4 (details in our day-after stock market recap). Bitcoin went into the vote weak: its Election Day close of $77,656 was 10.2% lower than 30 days earlier and 37.8% below the October 6, 2025 record close.
| Date (UTC close) | BTC close | Change vs Election Day |
|---|---|---|
| Nov 2, 2026 | $76,681 | −1.3% |
| Nov 3, 2026 (Election Day) | $77,656 | — |
| Nov 4, 2026 | $80,488 | +3.6% |
| Nov 5, 2026 | $75,803 | −2.4% |
| Nov 6, 2026 | $75,827 | −2.4% |
| Nov 7, 2026 | $75,724 | −2.5% |
| Nov 8, 2026 | $74,968 | −3.5% |
| Nov 9, 2026 | $75,161 | −3.2% |
| Nov 10, 2026 (1 week) | $73,661 | −5.1% |
| Nov 11, 2026 | $73,806 | −5.0% |
Coin Metrics. Bitfinex closed November 10 at $73,797 (−4.8%) and November 11 at $74,029; Bitstamp at $73,698 (−4.7%) and $73,915.
The one-day bounce on November 4 was the second-best day-after move of the eight elections, behind only 2024 (+8.9%). It reversed the next day, when US stocks had their worst session since April 2025 (S&P 500 −4.36%) and Bitcoin fell 5.8% in a day. By November 11, Bitcoin was about 41% below its record close ($124,824 on Coin Metrics; $124,680 on Bitfinex, the figure used in our cycle tracker).
What history says about the next few months, stated plainly:
- The 2026 midterm sits at the same point in the halving cycle as 2014, 2018 and 2022 (927 days after the last halving), and the vote came 393 days after the cycle's peak close.
- In those three cycles, the bear-market low came 1 to 71 days after the vote, and Bitcoin was higher 12 months later every time.
- But the 2025–26 decline has been much shallower than those bears (−37.8% on Election Day versus −67% to −73% at the past three midterms), so the cycle may not repeat on schedule, or at all.
We will fill in the 1-month cell after the December 3, 2026 close and the others as they come due.
How Small the Sample Is
This is the most important caveat on the page, so here it is in numbers:
- Seven completed elections. Four presidential, three midterm. No statistical test can tell an effect from noise with three observations.
- One in a tiny market. The 2012 row starts at $10.87, when Bitcoin's total market value was about $110 million. It inflates every presidential average.
- Each midterm had its own shock. Mt. Gox's aftermath in 2014, the Bitcoin Cash split in 2018, FTX in 2022. Remove the shock and you have no idea what the midterm "did."
- Elections are one input among many. Fed policy, liquidity and crypto-specific events often matter more; compare Bitcoin After Every Fed Rate Cut.
The stock market has a much longer record (20 midterms since 1950 in our S&P 500 midterm study), and even there the pattern is a tendency, not a rule. Bitcoin's version is far thinner.
What the Election Result Can Change for Crypto
Where elections do matter for Bitcoin is policy, not seasonality. The clearest example is the CLARITY Act, the crypto market-structure bill. The House passed it in July 2025, but the Senate failed to advance it on September 15, 2026. Republicans keep their majorities through the lame-duck session, and the bill expires if it is not enacted before the 119th Congress ends on January 3, 2027. After that, Democrats will chair the committees that write any new version.
For the full lame-duck record across asset classes, see Stocks in the Lame-Duck Session, Nasdaq After Midterm Elections and Treasury Yields and the Dollar After Midterms. Rates and the dollar feed into Bitcoin more directly than the seat count does.
If you want to watch how AI models read Bitcoin day to day rather than every two years, the SimianX crypto leaderboard tracks model calls on BTC, ETH and other coins, and SimianX live analysis lets you run one yourself.
Data and Method
- Primary series: Coin Metrics community data, metric PriceUSD (daily BTC reference rate, end of UTC day), downloaded November 11, 2026.
- Cross-checks: Bitstamp BTC/USD daily closes for every election from 2012, and Bitfinex daily closes from 2013. Where the sources differ materially, the note under the main table says so.
- Windows: close on Election Day to close on the same calendar date 7 days, 1, 3, 6 and 12 months later. No intraday highs or lows.
- Record close and drawdown: highest Coin Metrics daily close up to Election Day.
- Results: chamber control as called by major news organizations; see 2026 US elections and the earlier cycles on Wikipedia.
FAQ
Does Bitcoin go up after US elections?
After all four presidential elections since 2012, yes, over every window from 1 week to 12 months. After midterms, it fell over 3 months in two of three cases but rose over 12 months in all three. Seven elections is too few to call it a rule.
How did Bitcoin do after the 2024 election?
From a $69,538 close on November 5, 2024, Bitcoin rose 8.9% the next day, 26.6% in a week and 39.4% in a month. It was 49.4% higher a year later, at $103,916.
How did Bitcoin do after the 2022 midterms?
It fell 14.9% the next day as FTX collapsed, then bottomed. It was +23.8% after 3 months and +93.3% after 12 months.
What has Bitcoin done since the 2026 midterm?
As of the November 11, 2026 close, Bitcoin was $73,806, down 5.0% from its $77,656 Election Day close. It rose 3.6% on November 4 and has fallen since.
Is the election cycle the same as the halving cycle?
Not by design, but the calendars line up: every presidential vote since 2012 came within about 6½ months of a halving, and every midterm about 2½ years after one. That overlap explains most of the presidential-vs-midterm gap.
Do Republicans or Democrats matter for Bitcoin?
The table does not show a party pattern: Bitcoin rose strongly after both Obama's and Biden's wins and after both of Trump's, and the three midterms produced three different outcomes. Specific policies, such as the CLARITY Act, matter more than the party label.
This page is historical data, not investment advice.
Related Reading
- Bitcoin Monthly Returns: Every Month 2013–2026 Heatmap
- Stock Market After Midterm Elections: 2026 vs Every Cycle
- Stock Market Reaction to 2026 Midterms: Day After vs History
- Stock Market Drop After the 2026 Midterms: What Comes Next
- Stocks in the Lame-Duck Session: 25 Midterms, 1926-2022
- Nasdaq After Midterm Elections: Every Midterm 1974-2022
- Treasury Yields and the Dollar After Midterms, 1962-2022
- Bitcoin Returns by Year: Every Year 2011–2026 Table
- Bitcoin Halving Cycles: Complete Returns Reference 2012-2028
- Bitcoin One Year After Its $126K Peak vs Every Past Cycle
- CLARITY Act Tracker: Latest Status, Senate Vote & Timeline
- Bitcoin After Every Fed Rate Cut: 2019-2026 Reference
- Crypto cycles: all SimianX reference pages
References
- Coin Metrics — Community network data (BTC PriceUSD)
- Bitstamp — BTC/USD market
- Bitfinex — BTC/USD
- Investopedia — Bitcoin halving
- Wikipedia — Mt. Gox
- Wikipedia — Bitcoin Cash
- Wikipedia — Bankruptcy of FTX
- Wikipedia — 2014 United States elections
- Wikipedia — 2018 United States elections
- Wikipedia — 2022 United States elections
- Wikipedia — 2026 United States elections
- Congress.gov — H.R. 3633, CLARITY Act