
 By Marcus Reeve
Stocks in the Lame-Duck Session: 25 Midterms, 1926-2022
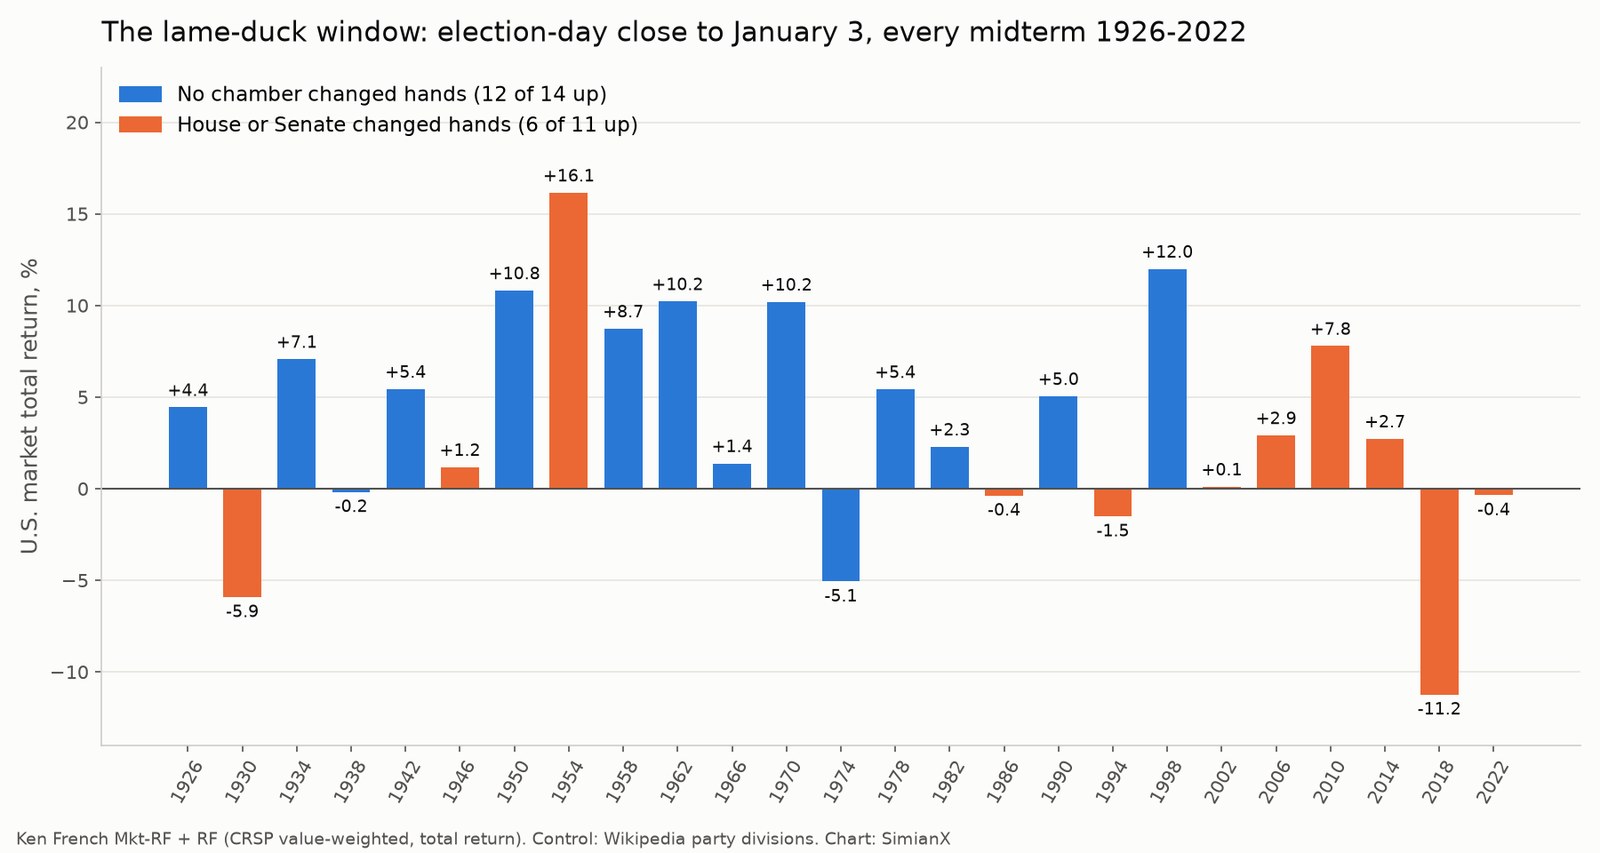
Quick answer. Usually up, but no more than any other year. From the close on midterm election day to January 3, when the new Congress is seated, the U.S. stock market rose in 18 of the 25 midterms from 1926 to 2022, with a median total return of +2.9% and an average of +3.6%. The same calendar window rose in 75 of 100 years from 1926 to 2025, with a median of +3.2%, so the lame-duck period after a midterm looks like an ordinary November and December. When the House or Senate was about to change hands, the window rose only 6 times in 11; when neither chamber changed hands, 12 times in 14. The worst lame duck on record was 2018 (−11.2%).
Result (as of 1:50 a.m. ET, November 4, 2026): Democrats won control of both the Senate and the House, calls made by AP and NBC News. By AP's count at 1:30 a.m. ET, Democrats had flipped seven Republican-held Senate seats and 16 House seats. Congress will be split from the White House from January 3, 2027.
A lame-duck session is any meeting of the outgoing Congress after an election and before its successor takes office. Since the 20th Amendment took effect in 1935, congressional terms end and begin on January 3 of odd-numbered years, so every midterm opens a window of about two months in which the old majority still holds the gavel while the new one waits. For 2026 that window runs from November 3, 2026 to January 3, 2027, and it carries real deadlines: federal funding runs out on December 11, and the Federal Reserve meets on December 8-9.
This page measures how the stock market has behaved in exactly that window, and lists the dated milestones between now and the seating of the 120th Congress. It is narrower than our other midterm research: the twelve-month record after the vote is in the S&P 500 after midterm elections, 1950-2026, returns by who controls Washington are in is gridlock good for stocks?, and funding lapses are in government shutdowns and the stock market.
How this was measured
Market data. The long sample is the Kenneth R. French Data Library daily market factor. Adding the market excess return to the risk-free rate (Mkt-RF + RF) gives the daily total return of the CRSP value-weighted index of all U.S. listed stocks, dividends included, from July 1926 to September 2026. That covers all 25 midterms from 1926 to 2022.
S&P 500 price. We did not find a free daily S&P 500 price history back to 1950 that downloads with a plain request, so the price check starts later: Cboe delayed daily closes for the S&P 500 index (_SPX) begin in January 1975 (the 12 midterms from 1978 to 2022), and closes for the SPDR S&P 500 ETF SPY begin in January 2004 (the 5 midterms from 2006 to 2022). These are price returns without dividends.
Dates. Election day is the first Tuesday after the first Monday in November. The base is the last close on or before election day. The NYSE did not trade on election day through the 1960s, so in those years the base is the Monday close. The end point is the last close on or before January 3 of the next year. In many years January 3 fell on a weekend or holiday, so the window often ends on December 31 or January 2. We also split the window at the last close on or before November 30, and show the next-day move and the deepest point below the base inside the window.
Control of Congress. Whether the House or Senate majority changed hands comes from Wikipedia's table of party divisions of United States Congresses. The Senate in 2001-2003 is counted as Democratic after the June 2001 party switch, and the 50-50 Senate of 2021-2023 as Democratic through the Vice President's tie-breaking vote.
One caveat about 1926 and 1930. Before the 20th Amendment, the outgoing Congress sat until March 4, so for those two elections the January 3 end point is only a calendar match, not the start of a new Congress. They are included for completeness; leaving them out barely changes the summary (23 midterms from 1934 to 2022: 17 up, median +2.9%).
The scoreboard: election day to January 3
| Window | Midterms up | Average | Median | Worst | Best |
|---|---|---|---|---|---|
| Election day to next trading day | 18 of 25 | +0.4% | +0.5% | −3.7% (1946) | +3.6% (1982) |
| Election day to November 30 | 18 of 25 | +1.8% | +2.3% | −5.5% (1974) | +8.9% (1954) |
| November 30 to January 3 | 18 of 25 | +1.7% | +1.2% | −11.4% (2018) | +8.1% (2010) |
| Election day to January 3 | 18 of 25 | +3.6% | +2.9% | −11.2% (2018) | +16.1% (1954) |
(Ken French Mkt-RF + RF, value-weighted total return, 1926-2022.)
Three points stand out.
The window is usually positive. Seven of every ten lame-duck windows ended higher. Only three of the 25 fell by more than 2%: 1930, 1974 and 2018.
The typical path is calm. The median deepest point below the election-day close was only −1.5%. Five windows saw a dip of more than 5% at some point: 1930 (−15.5%), 2018 (−15.0%), 1974 (−12.2%), 1946 (−7.5%) and 1938 (−5.7%).
December carries the big losses. The two halves of the window are equally likely to rise, but the largest single drop came after November 30: in 2018 the market fell 11.4% between November 30 and January 3, and in 2022 it fell 6.4% over the same stretch after a strong November.
Every midterm lame duck since 1926
| Midterm | Base close | End close | Election day to Jan 3 | Next day | To Nov 30 | Nov 30 to Jan 3 | Deepest point | Chamber changed hands |
|---|---|---|---|---|---|---|---|---|
| 1926 | Nov 1 | Jan 3 | +4.4% | +0.2% | +2.3% | +2.1% | 0.0% | none |
| 1930 | Nov 3 | Jan 3 | −5.9% | −2.6% | −3.4% | −2.7% | −15.5% | House |
| 1934 | Nov 5 | Jan 3 | +7.1% | +1.5% | +5.8% | +1.2% | 0.0% | none |
| 1938 | Nov 7 | Jan 3 | −0.2% | +2.4% | −3.5% | +3.4% | −5.7% | none |
| 1942 | Nov 2 | Jan 2 | +5.4% | −0.3% | −0.5% | +6.0% | −0.8% | none |
| 1946 | Nov 4 | Jan 3 | +1.2% | −3.7% | −3.2% | +4.5% | −7.5% | House and Senate |
| 1950 | Nov 6 | Jan 3 | +10.8% | +1.5% | +3.7% | +6.9% | 0.0% | none |
| 1954 | Nov 1 | Jan 3 | +16.1% | +2.0% | +8.9% | +6.6% | 0.0% | House and Senate |
| 1958 | Nov 3 | Jan 2 | +8.7% | +1.0% | +2.8% | +5.8% | −0.3% | none |
| 1962 | Nov 5 | Jan 3 | +10.2% | +0.7% | +7.7% | +2.4% | 0.0% | none |
| 1966 | Nov 7 | Jan 3 | +1.4% | +0.8% | +0.7% | +0.7% | −0.7% | none |
| 1970 | Nov 3 | Dec 31 | +10.2% | +0.2% | +3.8% | +6.2% | −1.7% | none |
| 1974 | Nov 5 | Jan 3 | −5.1% | −0.1% | −5.5% | +0.4% | −12.2% | none |
| 1978 | Nov 7 | Jan 3 | +5.4% | +0.4% | +1.9% | +3.5% | −1.5% | none |
| 1982 | Nov 2 | Jan 3 | +2.3% | +3.6% | +2.5% | −0.2% | −1.4% | none |
| 1986 | Nov 4 | Jan 2 | −0.4% | +0.2% | +0.7% | −1.1% | −3.4% | Senate |
| 1990 | Nov 6 | Jan 3 | +5.0% | −1.6% | +4.2% | +0.9% | −1.6% | none |
| 1994 | Nov 8 | Jan 3 | −1.5% | −0.1% | −2.5% | +1.0% | −4.7% | House and Senate |
| 1998 | Nov 3 | Dec 31 | +12.0% | +0.9% | +5.1% | +6.6% | 0.0% | none |
| 2002 | Nov 5 | Jan 3 | +0.1% | +1.0% | +2.9% | −2.7% | −4.2% | Senate |
| 2006 | Nov 7 | Jan 3 | +2.9% | +0.3% | +1.7% | +1.2% | −0.3% | House and Senate |
| 2010 | Nov 2 | Jan 3 | +7.8% | +0.4% | −0.3% | +8.1% | −1.0% | House |
| 2014 | Nov 4 | Jan 2 | +2.7% | +0.5% | +2.9% | −0.2% | −1.8% | Senate |
| 2018 | Nov 6 | Jan 3 | −11.2% | +2.1% | +0.1% | −11.4% | −15.0% | House |
| 2022 | Nov 8 | Jan 3 | −0.4% | −2.2% | +6.4% | −6.4% | −2.2% | House |
| 2026 | Nov 3 | to be added | to be added | Nov 4, 2026: to be added after the close | to be added | to be added | to be added | House and Senate |
(Total return of the U.S. market, Ken French Mkt-RF + RF. "Base close" is the last close on or before election day; "End close" is the last close on or before January 3 of the following year. "Deepest point" is the lowest close inside the window relative to the base. 2026 base: S&P 500 7,568.92 and SPY 754.35 at the November 3, 2026 close.)
Is the lame duck special, or is it just the calendar?
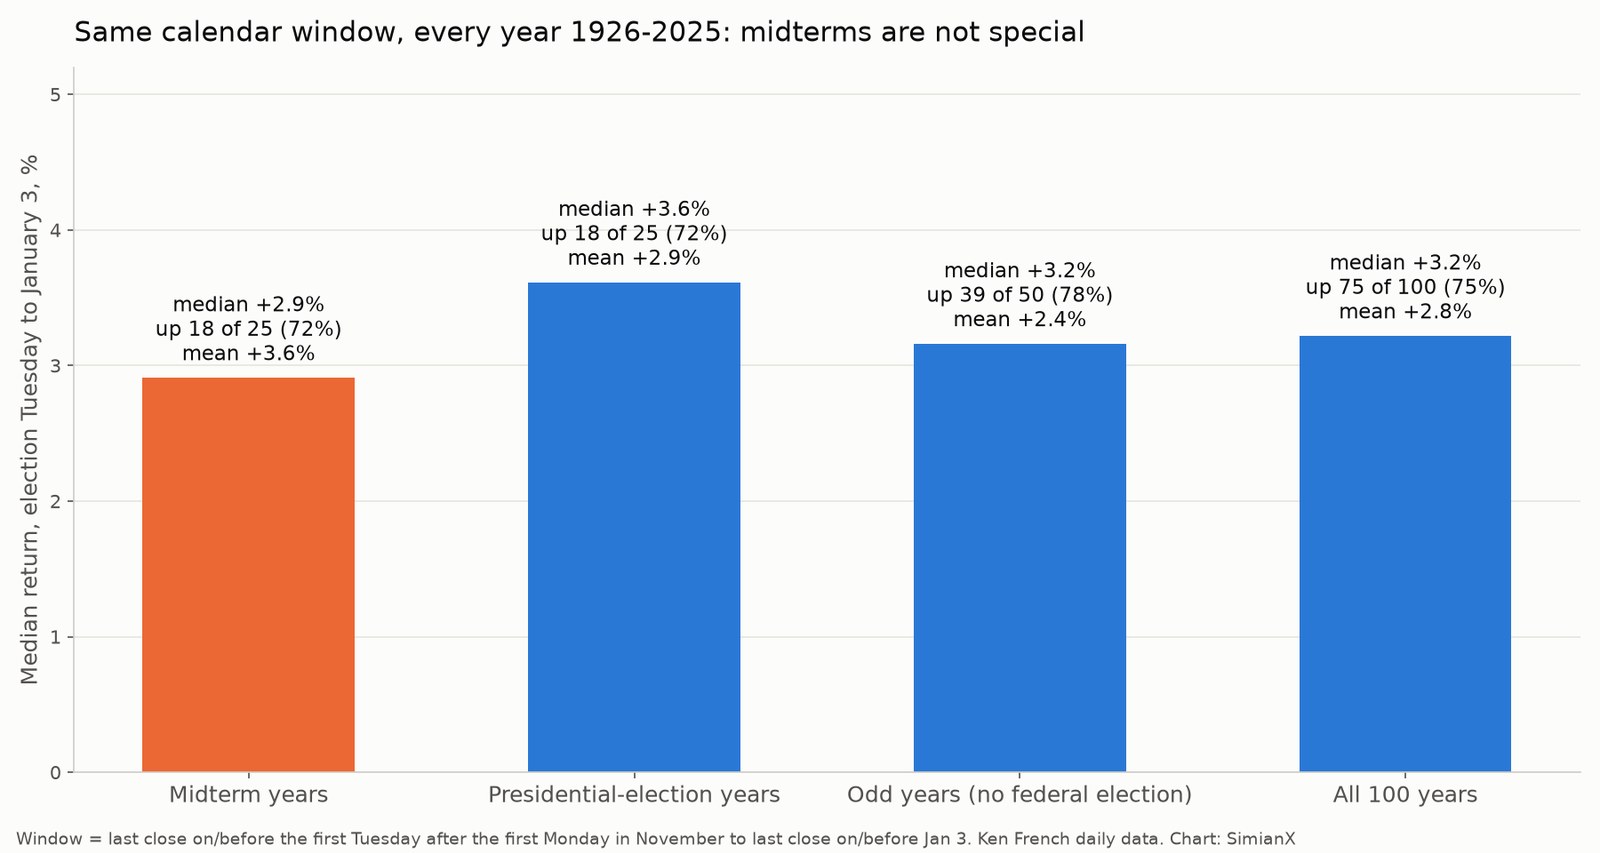
November and December are historically among the stronger months for U.S. stocks, so a positive lame-duck window could simply be the season. To check, we ran the identical window, from the first Tuesday after the first Monday in November to January 3, in every year from 1926 to 2025.
| Year type | Windows up | Average | Median | Worst |
|---|---|---|---|---|
| Midterm years (25) | 18 (72%) | +3.6% | +2.9% | −11.2% (2018) |
| Presidential-election years (25) | 18 (72%) | +2.9% | +3.6% | −8.4% |
| Odd years, no federal election (50) | 39 (78%) | +2.4% | +3.2% | −23.8% |
| All 100 years | 75 (75%) | +2.8% | +3.2% | −23.8% |
(Same window and data in every year. The −23.8% odd-year low is 1931, in the Depression.)
The midterm windows are indistinguishable from the rest. Their average is a little higher, carried by 1954, 1950 and 1998; their median is a little lower; and 12 of the 25 midterm windows beat the 100-year median, almost exactly half. In this data the lame-duck session does not add a measurable effect of its own. The positive drift is the normal year-end season, and a midterm simply sits at its start every cycle.
The S&P 500 price check from 1975 says the same, and if anything the recent midterm windows have lagged the season. From 1978 to 2022 the index rose in 8 of 12 midterm lame-duck windows with a median of +1.5%, against 31 of 39 non-midterm years and a median of +3.8% over the same 1975-2025 span. Twelve windows is a small sample, and one year (2018) does much of the work, so treat the gap as a description, not a pattern you can trade.
When control of Congress changes hands
The 2026 lame duck is a handover: both chambers are moving from Republican to Democratic control. How have lame ducks gone when a majority was about to change?
| Outcome at the midterm | Midterms | Windows up | Average | Median |
|---|---|---|---|---|
| Neither chamber changed hands | 14 | 12 (86%) | +5.6% | +5.4% |
| At least one chamber changed hands | 11 | 6 (55%) | +1.0% | +0.1% |
| House changed hands | 8 | 4 (50%) | +1.1% | +0.4% |
| Both chambers changed hands | 4 | 3 (75%) | +4.7% | +2.0% |
The headline split looks large: lame ducks with no change of control rose 12 times in 14, while handovers rose only 6 times in 11. But the comparison mixes eras. Twelve of the 14 "no change" midterms came before 1986, much of it a period in which Democrats held the House continuously (1955 to 1995) and control rarely moved. Eight of the 11 handovers came in 1986 or later, when the market's lame-duck windows were weaker in general (6 of 10 up since 1986, median +1.4%). Era and control are tangled together, and the samples are small.
The closest precedents for 2026, years in which both chambers changed hands, are only four:
- 1946 (+1.2%): Republicans took both chambers. The market fell 3.7% the day after the vote and was 7.5% under its election-day close at the low, then recovered in December.
- 1954 (+16.1%): Democrats took both chambers. This is the best lame-duck window in the data, part of the strong 1954 bull market.
- 1994 (−1.5%): Republicans took both chambers, winning the House for the first time in 40 years. The market drifted down in November and recovered part of the loss in December.
- 2006 (+2.9%): Democrats took both chambers. A quiet window, never more than 0.3% under the base.
Three of four rose, and the one decline was small. Four cases cannot tell you what a fifth will do; they only show that a full handover has not, by itself, produced a bad lame-duck market.
The bad lame ducks: what actually happened
The three large declines all had causes well beyond the transfer of power.
- 2018 (−11.2%). The market was flat through November, then fell 11.4% in December. The Federal Reserve raised its target range to 2.25-2.50% on December 19, 2018, and a partial government shutdown began on December 22, when the outgoing Congress and the President failed to agree on funding. The House had just changed hands. It is the clearest example of a lame duck colliding with both a Fed decision and a funding deadline. The shutdown record is covered in full in our shutdown study.
- 1930 (−5.9%). A Depression-era window, falling as much as 15.5% below the election-day close. The House Republican majority narrowly survived the vote but was lost before the new Congress first met in December 1931.
- 1974 (−5.1%). The lame duck after the Watergate resignation, in the last weeks of the 1973-74 bear market, with a low 12.2% under the base.
2022 (−0.4%) is a milder version of 2018. The market rose 6.4% through November 30, then gave all of it back in December, a month in which the Fed raised its target range to 4.25-4.50% on December 14, 2022. For how rate expectations and the midterms interact, see 2026 midterms meet the Fed and Treasury yields and the dollar after midterms.
The S&P 500 and SPY check
| Midterm | S&P 500 at base | S&P 500 at end | S&P 500 price | SPY price | U.S. market total return |
|---|---|---|---|---|---|
| 1978 | 93.85 | 97.80 | +4.2% | – | +5.4% |
| 1982 | 137.49 | 138.34 | +0.6% | – | +2.3% |
| 1986 | 246.20 | 246.45 | +0.1% | – | −0.4% |
| 1990 | 311.62 | 321.91 | +3.3% | – | +5.0% |
| 1994 | 465.65 | 459.11 | −1.4% | – | −1.5% |
| 1998 | 1,110.84 | 1,229.23 | +10.7% | – | +12.0% |
| 2002 | 915.39 | 908.59 | −0.7% | – | +0.1% |
| 2006 | 1,382.84 | 1,416.63 | +2.4% | +2.0% | +2.9% |
| 2010 | 1,193.57 | 1,271.89 | +6.6% | +6.3% | +7.8% |
| 2014 | 2,012.10 | 2,058.20 | +2.3% | +2.2% | +2.7% |
| 2018 | 2,755.45 | 2,447.89 | −11.2% | −11.0% | −11.2% |
| 2022 | 3,828.11 | 3,824.14 | −0.1% | −0.3% | −0.4% |
| 2026 | 7,568.92 | to be added | to be added | to be added | to be added |
(Cboe daily closes for _SPX and SPY, price only; total return from Ken French. Same base and end dates as the main table.)
The price series and the total-return series agree in sign in 10 of 12 cycles. The two exceptions are 1986 and 2002, where the S&P 500 and the broad market finished on opposite sides of zero by less than one point. SPY rose in 3 of the 5 lame ducks since 2006, with a median of +2.0%; its average is slightly negative (−0.2%) because of 2018.
The 2026-27 lame-duck calendar
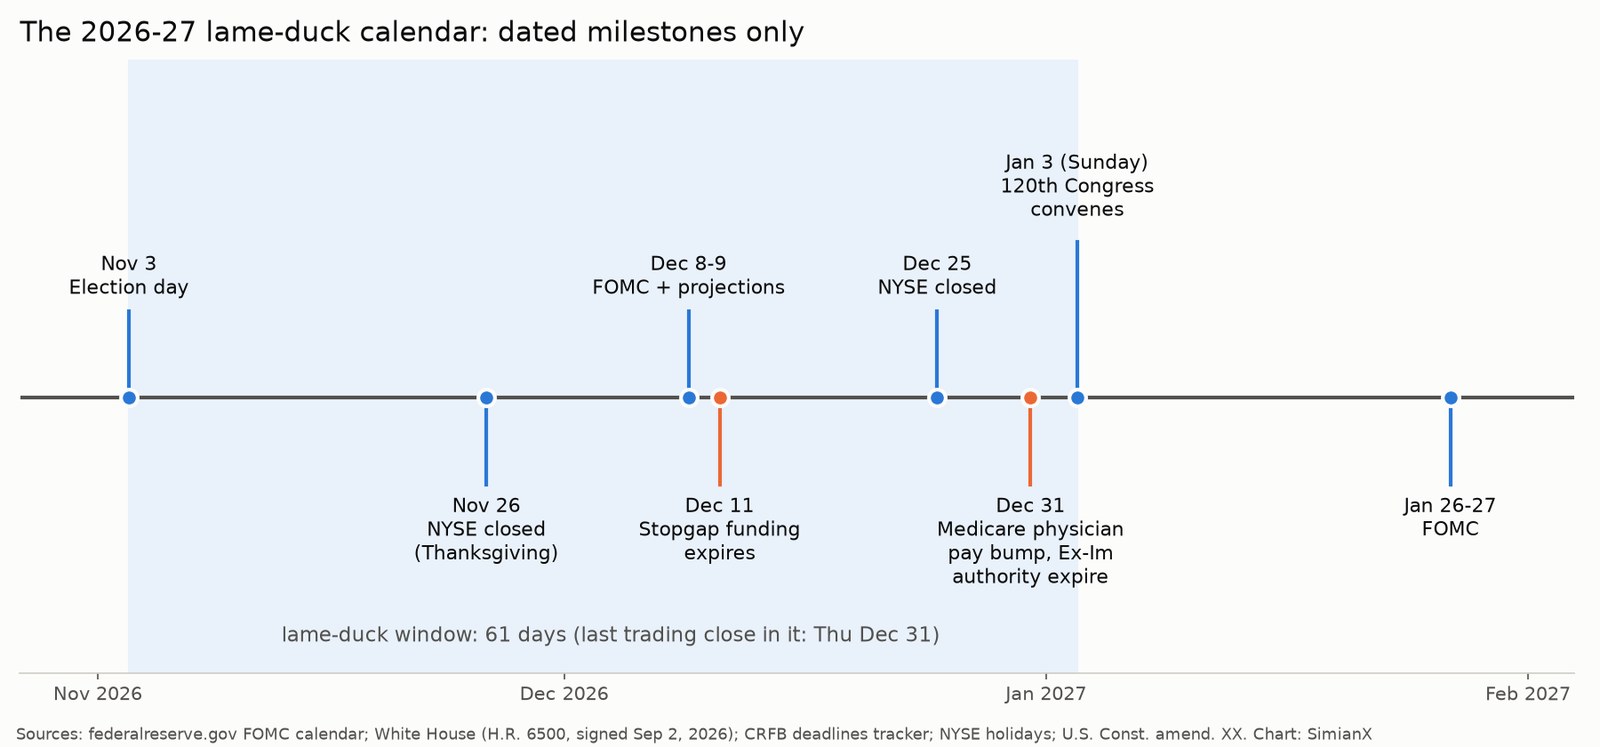
These are the fixed, dated milestones from election day to the first weeks of the new Congress, each from a primary or reputable published source. Anything we could not date from such a source is left out (see the notes below the table).
| Date | Milestone | Why markets watch it | Source |
|---|---|---|---|
| Tue Nov 3, 2026 | Midterm election day | Base close: S&P 500 7,568.92, SPY 754.35 | Federal statute; Cboe |
| Thu Nov 26, 2026 | NYSE closed (Thanksgiving) | Holiday | NYSE |
| Fri Nov 27, 2026 | NYSE early close, 1:00 p.m. ET | Thin holiday session | NYSE |
| Tue-Wed Dec 8-9, 2026 | FOMC meeting, with a Summary of Economic Projections | Last rate decision of 2026 | Federal Reserve |
| Fri Dec 11, 2026 | Stopgap government funding expires | Shutdown risk if not extended | White House, H.R. 6500 |
| Fri Dec 11, 2026 | Certain VA health care extenders, farm bill provisions and the surface transportation authorization expire | Riders for the same funding vehicle | CRFB |
| Thu Dec 24, 2026 | NYSE early close, 1:00 p.m. ET | Thin holiday session | NYSE |
| Fri Dec 25, 2026 | NYSE closed (Christmas) | Holiday | NYSE |
| Thu Dec 31, 2026 | Medicare physician payment increase and Export-Import Bank authorization expire | Year-end extenders; also the last trading day of the window | CRFB |
| Fri Jan 1, 2027 | NYSE closed (New Year's Day) | Holiday | NYSE |
| Sun Jan 3, 2027 | Terms of the 119th Congress end; the 120th Congress convenes | End of the lame-duck window | 20th Amendment |
| Tue-Wed Jan 26-27, 2027 | First FOMC meeting of 2027 | First rate decision under the new Congress | Federal Reserve |
Notes on the calendar.
- December 11 is the end date in the stopgap law the President signed on September 2, 2026 (H.R. 6500, the Continuing Appropriations and Extensions Act, 2027), which funds federal agencies at fiscal 2026 levels. Congress can move the date with new legislation at any time; check the latest status before relying on it.
- January 3, 2027 is a Sunday. The 20th Amendment sets noon on January 3 as the start of the new terms and the default date for Congress to assemble "unless they shall by law appoint a different day." Congresses have sometimes chosen a later day; we use January 3 because that is the constitutional date. The last trading close inside the window is Thursday, December 31.
- Left out because we could not date them from a fetchable primary or reputable source: state certification and canvass deadlines (these differ by state), the debt-limit "X-date" (the Committee for a Responsible Federal Budget lists the debt ceiling only as being reached in "2027 (estimated)", citing a Bipartisan Policy Center projection of sometime between winter and mid-summer), and the date on which the outgoing Congress adjourns for good.
What is different about the 2026 lame duck
Two features set this window apart from the typical one in the table.
It is a full handover with a funding deadline inside the window. Republicans hold the White House, the Senate and the House until January 3. Democrats take both chambers on that day. The outgoing majority has until December 11 to extend or replace the stopgap law, or the deadline lands on the new Congress. Of the 25 past midterms, only four saw both chambers change hands (1946, 1954, 1994 and 2006), and the worst lame duck in the record, 2018, ended in a partial shutdown that began on December 22. Even so, the bigger moves in the table came from the economy and the Fed rather than from Congress.
The Fed meets two days before the deadline. The December 8-9 FOMC meeting comes with new economic projections. In both of the weak December stretches in recent lame ducks, 2018 and 2022, the Fed raised rates in mid-December. That is a description of two years, not a forecast for this one.
None of this tells you which way the market will go between now and January. The record says that the lame-duck window has risen about seven times in ten, about the same as any November-to-January stretch, and that its worst outcomes came when a December policy shock arrived on top of a weak market. For how company size and rates have behaved over the longer post-midterm horizon, see small caps vs large caps after midterms and bank stocks after midterm elections.
How to use this table
- Don't treat the lame duck as a seasonal trade of its own. It rises about as often as the same window in non-election years (72% vs 76%), and its median is slightly lower.
- Separate the calendar from the politics. The big lame-duck moves came from rate decisions, recessions and a shutdown, not from the vote count.
- Mark the dated risks. For 2026-27 those are the December 8-9 FOMC meeting, the December 11 funding deadline and the December 31 expirations, all before the new Congress sits.
- Respect the sample size. Twenty-five windows overall, eleven handovers and four full handovers are too few to separate a political effect from noise.
To follow how the market trades through the handover, you can start a live AI analysis of SPY on SimianX and track it against these dates.
FAQ
How does the stock market do during a lame-duck session?
From the midterm election-day close to January 3, the U.S. market rose in 18 of 25 midterms from 1926 to 2022, with a median total return of +2.9% and an average of +3.6%. That is in line with the same window in all years, which rose 75 times in 100 with a median of +3.2%.
What was the worst lame-duck period for stocks?
- From the November 6, 2018 close to January 3, 2019, the U.S. market lost 11.2% and the S&P 500 fell from 2,755.45 to 2,447.89. Most of the loss came in December, when the Fed raised rates on December 19 and a partial government shutdown began on December 22.
Do stocks fall when Congress changes hands?
Not consistently. When the House or Senate was about to change hands, the lame-duck window rose 6 times in 11, compared with 12 times in 14 when neither chamber changed hands. In the four midterms where both chambers changed hands (1946, 1954, 1994, 2006) the window rose three times. The samples are small and mixed with era effects.
When does the new Congress start in 2027?
The 20th Amendment sets January 3, 2027 as the end of the 119th Congress and the start of the 120th. January 3, 2027 is a Sunday; Congress can set a different meeting day by law.
When does government funding run out in 2026?
The stopgap law signed on September 2, 2026 (H.R. 6500) funds federal agencies through December 11, 2026, unless Congress passes new legislation first.
When is the next Fed meeting after the 2026 midterms?
The FOMC meets on December 8-9, 2026, with a Summary of Economic Projections, and then on January 26-27, 2027, according to the Federal Reserve's calendar.
Is this S&P 500 data since 1950?
No. The long sample (1926-2022) is the total return of the whole U.S. market from the Ken French data library, which tracks the S&P 500 closely. The S&P 500 price check starts with the 1978 midterm, the first in the Cboe daily history we could download, and the SPY check with 2006.
Bottom line
The lame-duck window after a midterm has been a good stretch for stocks most of the time, rising after 18 of 25 elections since 1926, but it has done no better than the same weeks in any other year. Handovers of control have been a bit weaker than status-quo years, a pattern muddied by era and small samples, and the four full handovers before 2026 produced three gains. The worst lame duck, 2018, came when a December rate hike and a funding lapse hit at the same time. In 2026 both of those dates sit inside the window again: the FOMC meets on December 8-9 and funding expires on December 11.
This article is historical research, not investment advice. Past patterns, especially from samples of 25 elections or fewer, do not predict future returns.
Sources. Kenneth R. French Data Library, Fama/French 3 Factors (daily), Mkt-RF and RF, July 1926 to September 2026 (CRSP data via the Tuck School of Business). Cboe delayed daily price history for the S&P 500 index (_SPX, from January 1975) and SPY (from January 2004), through the November 3, 2026 close. Party control: Wikipedia, "Party divisions of United States Congresses." Calendar: Federal Reserve FOMC meeting calendar (last updated October 28, 2026); White House statement on H.R. 6500 (September 2, 2026); Committee for a Responsible Federal Budget, "Upcoming Congressional Fiscal Policy Deadlines" (October 26, 2026); NYSE holidays and trading hours; U.S. Constitution, 20th Amendment. Election dates follow the federal rule (first Tuesday after the first Monday in November). Calculations and charts by SimianX.
Related reading
- Stock Market After Midterm Elections: Every Cycle 1950–2026: the twelve-month S&P 500 record after each midterm
- Is Gridlock Good for Stocks? 49 Congresses, 1927-2025: returns by who controls Washington over a full Congress
- Government Shutdowns and the Stock Market: 1976–2026: every funding lapse and how stocks reacted
- 2026 Midterms Meet the Fed: how the election and rate decisions interact
- Treasury Yields and the Dollar After Midterms, 1962-2022: the bond and currency side of the same windows
- Do Small Caps Beat Large Caps After Midterms? 1926-2022: company size after 25 midterms