
 By Marcus Reeve
What the Bond Market and the Dollar Do After a Midterm Election
Data through the November 2, 2026 close for the 10-year Treasury yield and the October 30, 2026 fixing for the broad dollar index. Every figure below is recomputed from public Federal Reserve data.
Quick answer: In the 16 midterm elections from 1962 to 2022, the 10-year Treasury yield barely reacted to the vote itself: the next trading day it moved a median of −0.5 basis points, and never more than 10 bp. Three months later it was lower after 11 of the 16 midterms (median −20.5 bp), against a 52% chance of a rise over any three-month window in the same years. Twelve months later it was higher 9 times out of 16, which is roughly what the rate trend of each era would predict. The trade-weighted U.S. dollar showed no reliable midterm pattern at all: it was higher a year later after 7 of 12 midterms on the major-currency index (1974–2018) and 3 of 5 on the broad index (2006–2022).
Result (as of 1:50 a.m. ET, November 4, 2026): Democrats won control of both the Senate and the House, calls made by AP and NBC News. By AP's count at 1:30 a.m. ET, Democrats had flipped seven Republican-held Senate seats and 16 House seats. Congress will be split from the White House from January 3, 2027.
Most midterm research is about stocks. Our stock market after midterm elections reference covers the S&P 500 in every cycle since 1950, and is gridlock good for stocks covers divided government term by term. The bond market and the currency get much less attention, even though the 10-year Treasury yield sets the price of mortgages, corporate debt and every discounted cash flow on Wall Street. This page fills that gap: the 10-year Treasury yield and the U.S. dollar around every midterm election, measured the same way each time, with the years when the result changed who controls Congress labeled.
How the numbers were built
- Yields: the daily 10-year Treasury constant-maturity yield (FRED series DGS10), which starts on January 2, 1962. That gives 16 midterms, 1962 to 2022. For 1954 and 1958 we show monthly averages from GS10 in a separate, clearly labeled table, because monthly averages are not comparable with daily closes.
- Dollar: the Federal Reserve's trade-weighted dollar indexes from the H.10 release. The older nominal major-currency index (DTWEXM) runs from 1973 to 2019 and covers the 1974–2018 midterms. The current nominal broad index (DTWEXBGS) starts in 2006 and covers 2006–2022. Each dollar row says which index it uses.
- Base: the last close on or before election day (the first Tuesday after the first Monday in November). FRED has no 10-year observation on election day for any midterm through 1982 (the market was closed), so for those years the base is the Monday close.
- Windows: election day (the close on election day against the previous close, 1986 onward only), the next trading day, three months and twelve months after the base date. Yield changes are in basis points (1 bp = 0.01 percentage point); dollar changes are in percent.
- Government after the vote: who held the White House, House and Senate once the new Congress was seated, from the public record of party divisions of U.S. Congresses.
Sixteen elections is a small sample. Treat every count below as a description of what happened, not a probability.
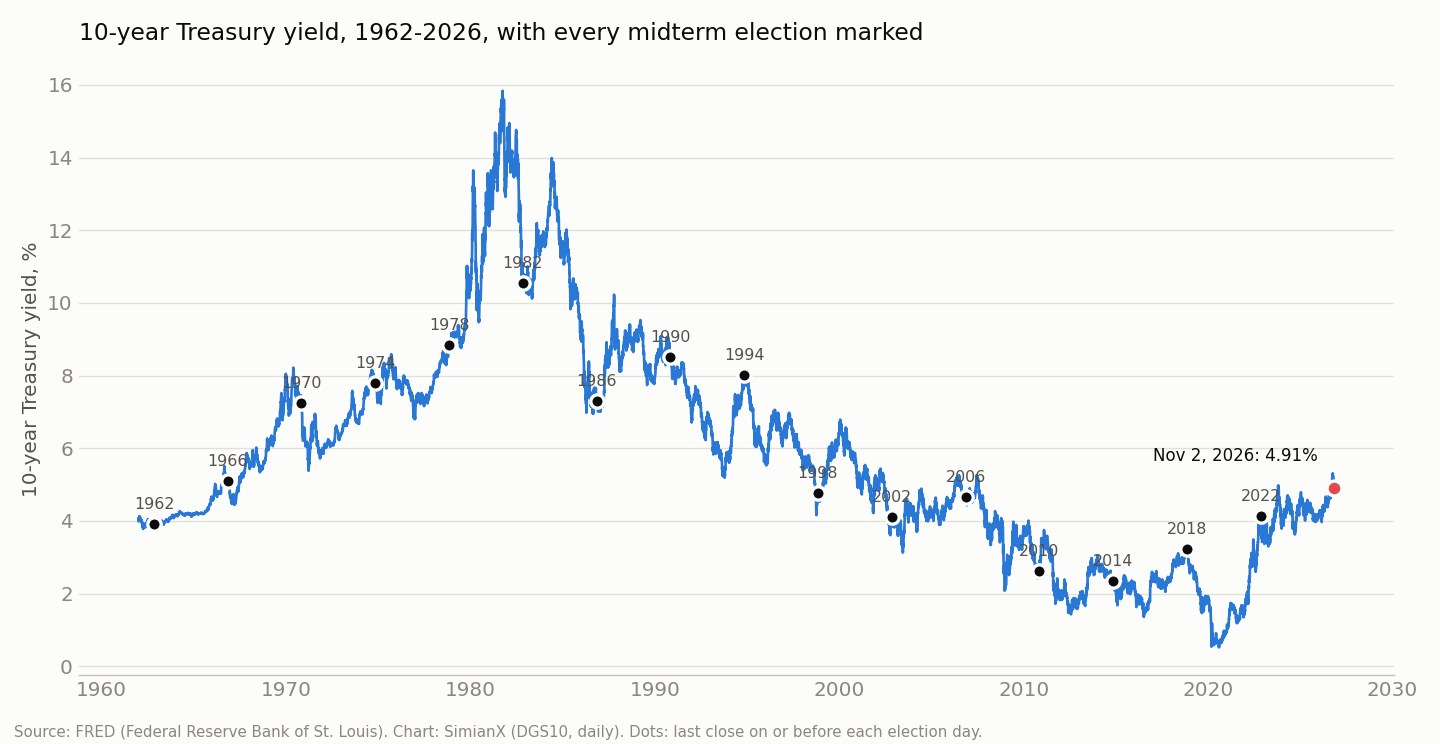
The 10-year Treasury yield around every midterm, 1962–2022
| Year | Base close (date) | Election day | Next day | +3 months | +12 months | Level 12 months later | Government after the vote |
|---|---|---|---|---|---|---|---|
| 1962 | 3.91% (Nov 5) | closed | 0 | −1 | +24 | 4.15% | Unified (D), unchanged |
| 1966 | 5.11% (Nov 7) | closed | +1 | −57 | +66 | 5.77% | Unified (D), unchanged |
| 1970 | 7.24% (Nov 2) | closed | −1 | −113 | −144 | 5.80% | Divided, unchanged |
| 1974 | 7.80% (Nov 4) | closed | −4 | −33 | +17 | 7.97% | Divided, unchanged |
| 1978 | 8.85% (Nov 6) | closed | +1 | +15 | +200 | 10.85% | Unified (D), unchanged |
| 1982 | 10.56% (Nov 1) | closed | −10 | +22 | +113 | 11.69% | Divided, unchanged |
| 1986 | 7.31% (Nov 4) | +2 | −7 | −8 | +154 | 8.85% | Divided; Senate flipped to D |
| 1990 | 8.52% (Nov 6) | +2 | +5 | −73 | −101 | 7.51% | Divided, unchanged |
| 1994 | 8.01% (Nov 8) | −4 | −7 | −48 | −209 | 5.92% | Unified → divided (both chambers to R) |
| 1998 | 4.78% (Nov 3) | +1 | +5 | +5 | +123 | 6.01% | Divided, unchanged |
| 2002 | 4.10% (Nov 5) | +3 | −1 | −8 | +28 | 4.38% | Divided → unified (Senate to R) |
| 2006 | 4.66% (Nov 7) | −5 | −2 | +8 | −32 | 4.34% | Unified → divided (both chambers to D) |
| 2010 | 2.63% (Nov 2) | −3 | +4 | +89 | −60 | 2.03% | Unified → divided (House to R) |
| 2014 | 2.35% (Nov 4) | −1 | +1 | −54 | −10 | 2.25% | Divided; Senate flipped to R |
| 2018 | 3.22% (Nov 6) | +2 | 0 | −52 | −141 | 1.81% | Unified → divided (House to D) |
| 2022 | 4.14% (Nov 8) | −8 | −2 | −51 | +35 | 4.49% | Unified → divided (House to R) |
Changes in basis points. "Closed" means no DGS10 observation on election day. Source: FRED DGS10; SimianX calculations.
| Window | Midterms | Yield rose | Yield fell | Unchanged | Mean | Median |
|---|---|---|---|---|---|---|
| Election day (1986–2022) | 10 | 5 | 5 | 0 | −1.1 bp | 0 bp |
| Next trading day | 16 | 6 | 8 | 2 | −1.1 bp | −0.5 bp |
| +3 months | 16 | 5 | 11 | 0 | −22.4 bp | −20.5 bp |
| +12 months | 16 | 9 | 7 | 0 | +3.9 bp | +20.5 bp |
Election day and the morning after: the bond market shrugs
The first thing the table shows is how little the vote itself moves Treasuries. On the ten midterm election days when the market was open (1986–2022), the 10-year yield rose five times and fell five times, by between −8 bp (2022) and +3 bp (2002). On the next trading day, when the results are known, the median move was −0.5 bp. The three largest next-day moves were −10 bp in 1982, −7 bp in 1986 and −7 bp in 1994. Even the 1994 "Republican Revolution", which gave Republicans the House for the first time in 40 years, moved the 10-year by just 7 bp the next day.
That is not surprising once you look at what a midterm can change. A new Congress does not set the federal funds rate; the Federal Reserve does. It cannot change the stock of outstanding debt on day one. What it can change is the path of future tax and spending law, and markets usually price the likely result in the weeks before the vote, as polls converge. By the time the results arrive, most of the information is already in the price.
For equity volatility around the same votes, see the VIX after midterm elections: the VIX was lower one month later after only 5 of the 9 midterms since 1990.
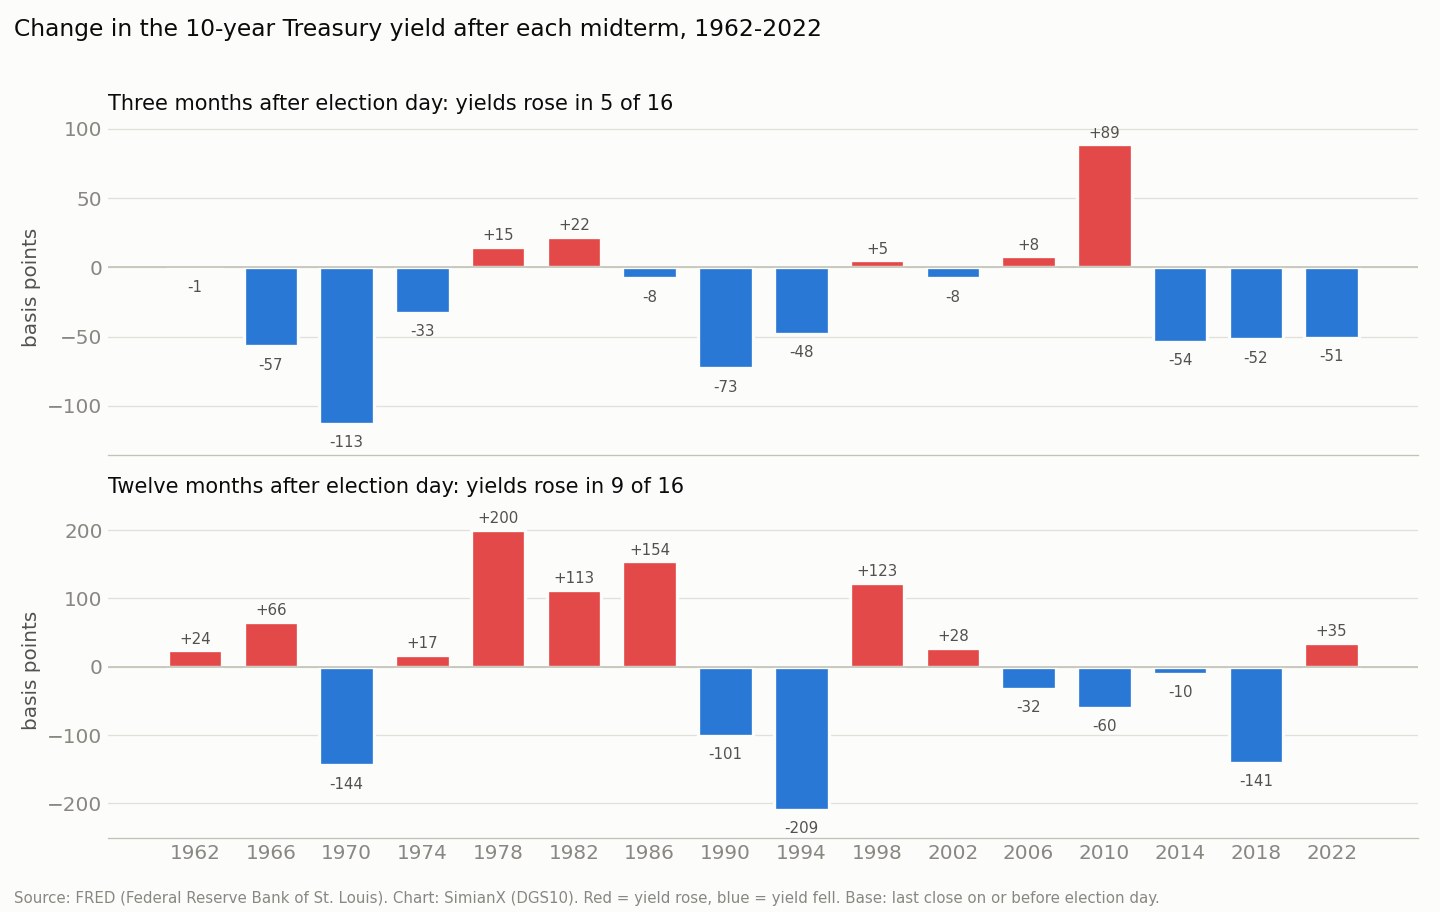
Three months later: yields fell after 11 of 16 midterms
The more interesting pattern sits in the three months after the vote. The 10-year yield was lower three months later in 11 of the 16 midterms, by a median of 20.5 bp and a mean of 22.4 bp. The declines include −113 bp after 1970, −73 bp after 1990, −57 bp after 1966, and a run of four straight drops of 48 bp or more in 1994 (−48), 2014 (−54), 2018 (−52) and 2022 (−51).
To judge whether that is unusual, compare it with every three-month window in the same years, not just the ones after elections. Across all trading days from 1962 to 2022, the 10-year yield was higher three months later 52.2% of the time, with an average change of −0.3 bp. The midterm count, 5 rises in 16 (31%), is well below that base rate.
The comparison holds up when split by era, which matters because U.S. rates rose for two decades and then fell for four:
| Era | Midterms with a 3-month rise | All 3-month windows that rose | Midterms with a 12-month rise | All 12-month windows that rose |
|---|---|---|---|---|
| Rising-rate era: 1962–1978 midterms vs all days 1962–1981 | 1 of 5 | 63.4% | 4 of 5 | 76.2% |
| Falling-rate era: 1982–2018 midterms vs all days 1982–2020 | 4 of 10 | 45.5% | 4 of 10 | 38.0% |
| All: 1962–2022 | 5 of 16 | 52.2% | 9 of 16 | 52.5% |
In the rising-rate era, yields climbed in almost two out of three three-month windows, yet they rose in only one of the five post-midterm windows. In the falling-rate era the gap is smaller (40% against 45.5%). With five and ten observations, the honest summary is that the post-election quarter has leaned toward lower yields, most strongly in the 1960s and 1970s, and that the lean is too small a sample to trade on alone.
Part of the reason is the calendar rather than the election. The November-to-February window also contains the year-end and the first Fed meetings of a new year, and several of the declines line up with obvious macro events: the 1970 recession, the 1990–91 recession and Gulf War, the late-2018 growth scare that ended the Fed's hiking cycle, and the 2022 peak in inflation. The one big exception, +89 bp after 2010, came as the market priced a stronger 2011 recovery and the December 2010 tax-cut extension.
Twelve months later: the rate regime decides
Over a full year, the midterm signal disappears into the trend. The 10-year yield was higher 12 months later after 9 of the 16 midterms, with a median change of +20.5 bp, almost exactly the 52.5% base rate for any 12-month window since 1962. In the rising-rate era the 12-month change was positive after four of five midterms, including +200 bp after 1978, as inflation took the yield from 8.85% to 10.85%. In the falling-rate era it was positive after only four of ten, including −209 bp after 1994 and −141 bp after 2018, a window that ended in November 2019 after the Fed had cut rates three times.
The practical lesson: if you want to know where the 10-year yield will be a year after a midterm, the election result is a much weaker input than inflation, the Fed's policy path and the global demand for duration. Our every Fed rate-cut cycle since 1980 and every Fed rate-hike cycle since 1983 references show how much larger those forces are.
The 30-year mortgage rate was lower a year after 9 of the 13 midterms since 1974, yet construction stocks beat the market in only two of those years (homebuilder stocks after midterms).
Before 1962: two monthly data points
Daily 10-year data in FRED start in 1962. For the two earlier postwar midterms, the monthly average 10-year yield (GS10) gives a rough read. These are averages of a whole month, not closes, so they belong in a separate table:
| Midterm | October average | January average | October average, next year | Oct → Jan | Oct → Oct |
|---|---|---|---|---|---|
| 1954 | 2.43% | 2.61% | 2.88% | +18 bp | +45 bp |
| 1958 | 3.80% | 4.02% | 4.53% | +22 bp | +73 bp |
Source: FRED GS10 (monthly averages). Both fall in the long postwar rise in rates, and in both the yield climbed after the vote.
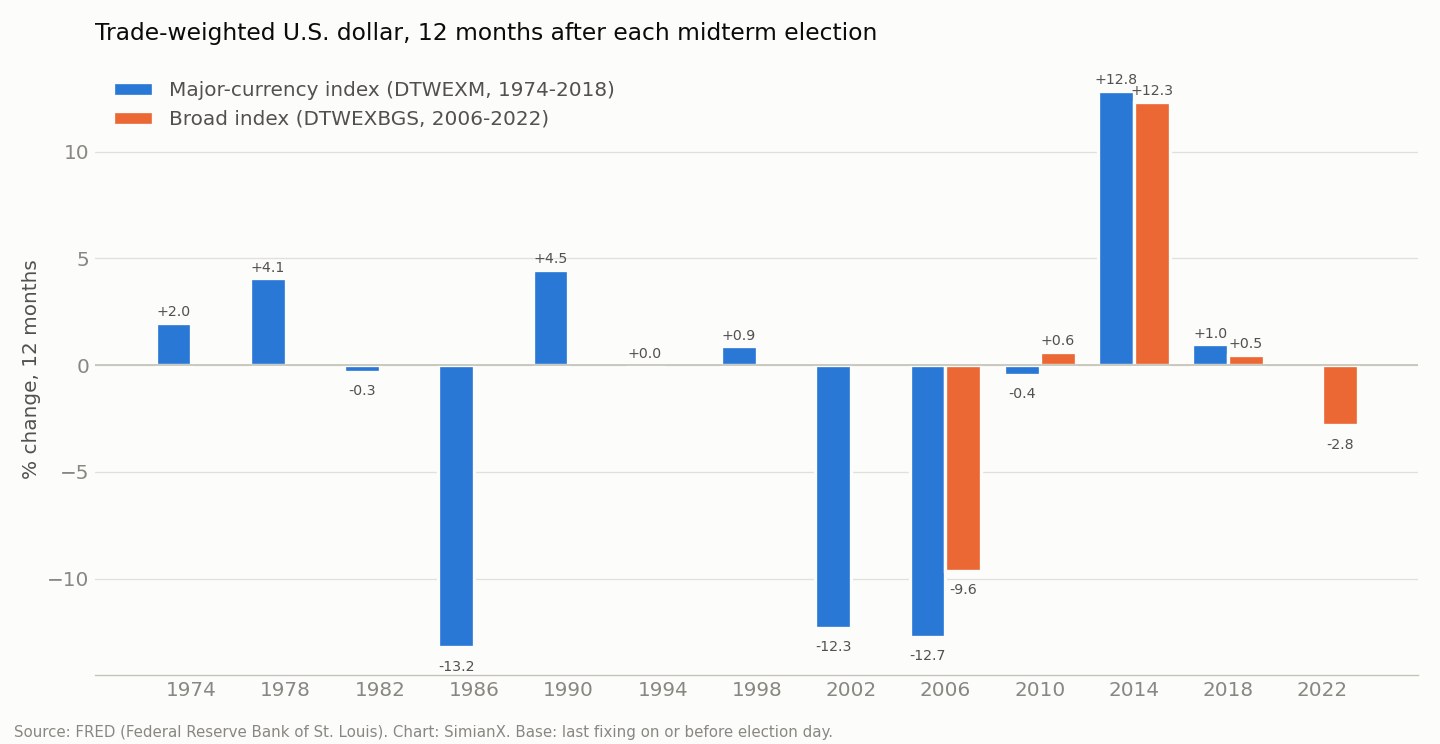
The U.S. dollar around every midterm, 1974–2022
| Year | Index | Base level | Election day | Next day | +3 months | +12 months |
|---|---|---|---|---|---|---|
| 1974 | Major currencies (DTWEXM) | 102.65 | no fixing | −0.03% | −2.19% | +1.99% |
| 1978 | Major currencies (DTWEXM) | 93.76 | no fixing | −0.71% | +1.28% | +4.07% |
| 1982 | Major currencies (DTWEXM) | 122.56 | no fixing | −0.02% | −3.49% | −0.32% |
| 1986 | Major currencies (DTWEXM) | 108.02 | −0.14% | +0.11% | −7.52% | −13.22% |
| 1990 | Major currencies (DTWEXM) | 83.27 | +0.11% | +0.13% | −0.64% | +4.47% |
| 1994 | Major currencies (DTWEXM) | 84.58 | −0.21% | +0.70% | +2.60% | +0.03% |
| 1998 | Major currencies (DTWEXM) | 94.56 | +0.22% | +0.37% | +0.59% | +0.88% |
| 2002 | Major currencies (DTWEXM) | 102.50 | −0.30% | +0.20% | −4.67% | −12.29% |
| 2006 | Major currencies (DTWEXM) | 81.65 | −0.55% | +0.17% | +1.15% | −12.72% |
| 2006 | Broad (DTWEXBGS) | 97.45 | −0.37% | +0.14% | +0.29% | −9.63% |
| 2010 | Major currencies (DTWEXM) | 71.69 | −0.52% | +0.11% | −0.11% | −0.44% |
| 2010 | Broad (DTWEXBGS) | 89.68 | −0.38% | +0.03% | −0.68% | +0.62% |
| 2014 | Major currencies (DTWEXM) | 82.21 | −0.11% | +0.38% | +8.05% | +12.85% |
| 2014 | Broad (DTWEXBGS) | 98.56 | +0.02% | +0.25% | +6.32% | +12.33% |
| 2018 | Major currencies (DTWEXM) | 91.31 | −0.02% | −0.32% | −0.14% | +0.98% |
| 2018 | Broad (DTWEXBGS) | 115.56 | −0.12% | −0.27% | −1.15% | +0.47% |
| 2022 | Broad (DTWEXBGS) | 125.63 | −0.53% | +0.28% | −4.37% | −2.82% |
A higher index means a stronger dollar. The two indexes use different currency baskets and base periods, so compare changes, not levels. Sources: FRED DTWEXM, DTWEXBGS; SimianX calculations.
| Window | Major-currency index, 1974–2018 | Broad index, 2006–2022 |
|---|---|---|
| Election day | down 7 of 9 (mean −0.2%) | down 4 of 5 (mean −0.3%) |
| Next trading day | up 8 of 12 (mean +0.1%) | up 4 of 5 (mean +0.1%) |
| +3 months | up 5 of 12 (median −0.1%) | up 2 of 5 (median −0.7%) |
| +12 months | up 7 of 12 (median +0.5%, mean −1.1%) | up 3 of 5 (median +0.5%, mean +0.2%) |
| All 12-month windows in the index's history | up 54.1% | up 57.7% |
The dollar has two small quirks around the vote. It slipped on election day in 7 of 9 cycles on the major-currency index and 4 of 5 on the broad index, and it bounced the next day in most cycles. The moves are tiny (the largest election-day drop was −0.55% in 2006), and with so few observations they could easily be noise.
Over a year, there is no midterm pattern. The three largest falls, about 12% to 13% after 1986, 2002 and 2006, came during broad dollar bear markets: the unwinding of the mid-1980s dollar peak after the 1985 Plaza Accord, and the long slide of 2002–2008. The largest rise, almost 13% after 2014, came when the Federal Reserve was preparing to raise rates while Europe and Japan were easing. Those are monetary and global stories, not congressional ones. For the year-by-year record of the dollar against 14 individual currencies, see our US dollar exchange rate by year table.
Does divided government push yields down? What the data supports
A familiar argument says that when a midterm splits Washington, gridlock restrains new spending, deficits shrink and long-term yields fall. The yield table lets us test the first and last parts of that chain.
| Government change at the midterm | Midterms | 10-year yield, +3 months (median) | 10-year yield, +12 months (median) | Yield higher after 12 months |
|---|---|---|---|---|
| Unified → divided (1994, 2006, 2010, 2018, 2022) | 5 | −48 bp | −60 bp | 1 of 5 |
| Stayed divided (1970, 1974, 1982, 1986, 1990, 1998, 2014) | 7 | −33 bp | +17 bp | 4 of 7 |
| Stayed unified (1962, 1966, 1978) | 3 | −1 bp | +66 bp | 3 of 3 |
| Divided → unified (2002) | 1 | −8 bp | +28 bp | 1 of 1 |
On its face, this looks like support for the gridlock theory: the five midterms that broke up a one-party government were followed by lower yields a year later four times, with a median drop of 60 bp. But the fiscal link in the middle does not hold. Using the federal surplus or deficit as a share of GDP (FRED FYFSGDA188S), we compared the fiscal year of each election with the fiscal year two years later:
- After the five unified → divided midterms, the deficit narrowed only twice (1994, by 1.46 percentage points of GDP, and 2010, by 1.98) and widened three times. The average change was −1.94 points, dominated by the pandemic year after 2018 (−10.88 points); without 2018 the average is +0.29 points, essentially flat.
- After the seven midterms where government stayed divided, the deficit narrowed only twice (1986 and 1998), with an average change of −0.51 points.
So in this sample, the yield declines after a midterm that split Washington were not driven by visibly smaller deficits. They line up with recessions, Fed easing or global shocks: the 1995 soft landing after the Fed's 1994 hikes, the 2007 credit crisis, the 2011 euro-area crisis, and the 2019 Fed cuts. Five cases is not enough to separate "divided government" from "what the economy happened to be doing", so the fair statement is that divided government has coincided with lower yields, but the deficit channel that is supposed to explain it does not show up in the data. Our gridlock study reaches a similarly sceptical verdict for stocks.
One more split, by the president's party: after the eight midterms under a Democratic president, the 10-year yield was higher 12 months later five times (mean +21.1 bp); under a Republican president, four times out of eight (mean −13.2 bp). Here too the era dominates: the Democratic list includes 1966 and 1978, both in the inflationary 1960s and 1970s.
The 2026 setup: the 10-year near a 24-year high
The 2026 midterm is on Tuesday, November 3. Going in, the government is unified under the Republicans, the same configuration that preceded the 2006 and 2018 midterms, both of which handed at least one chamber to the opposition. Here is where rates and the dollar stood on the eve of the vote:
| Measure | Latest | Comparison |
|---|---|---|
| 10-year Treasury yield (DGS10) | 4.91% on November 2, 2026 | 4.11% on October 31, 2025 (+80 bp in a year); 4.18% on December 31, 2025 (+73 bp year to date) |
| 2026 peak in the 10-year | 5.31% on October 5, 2026 | the highest close since 5.32% on May 14, 2002 |
| Move since the end of September | −38 bp | from 5.29% on September 30, 2026 |
| 2-year Treasury yield (DGS2) | 4.59% on November 2, 2026 | 10-year minus 2-year spread: +32 bp |
| Broad trade-weighted dollar (DTWEXBGS) | 121.67 on October 30, 2026 | +0.3% in a year; +1.6% year to date; 6.4% below its series high of 130.04 on January 13, 2025 |
| Where the broad dollar sits | 90.8th percentile | of all daily readings since January 2006 |
| Federal deficit, FY2025 | 5.75% of GDP | 3.77% in FY2018 and 1.80% in FY2006, the last two times a unified Republican government faced a midterm |
Three things stand out against the historical table.
Yields are high going in. A 4.91% 10-year would be the highest midterm-eve level since 1994's 8.01%, above the 4.66% of 2006 and the 4.14% of 2022. The October peak came after a global selloff in long-dated bonds, covered in our global bond selloff 2026 report, and after the Federal Reserve raised rates in September 2026 to 3.75%–4.00% and then held in October (see the always-updated Fed interest rate decision page). The Treasury also expanded its long-bond buybacks through November 4, a program examined in Trump Treasury bond buybacks. For how the Fed's own calendar intersects with the election, see 2026 midterms meet the Fed.
The deficit is much larger than in past unified-to-divided setups. At 5.75% of GDP in FY2025, the deficit is above the FY2018 (3.77%) and FY2006 (1.80%) starting points. That does not tell you which way yields will go, but it does mean the fiscal argument for higher term premiums is louder than in most past cycles.
The curve is positively sloped. The 10-year minus 2-year spread is +32 bp, compared with an inverted curve on the eve of the 2006 (−11 bp) and 2022 (−53 bp) midterms. Our yield curve inversions and US recessions reference explains why the shape matters more than the level for the economic outlook.
None of this is a forecast. The historical record says the vote itself is a small event for Treasuries and the dollar, and that what follows depends mostly on inflation, the Fed and the rest of the world.
How to use this table
- For the next day: history says to expect a move of a few basis points in either direction. A double-digit move on November 4 would be unusual for a midterm.
- For the next quarter: the post-midterm quarter has leaned toward lower 10-year yields (11 of 16), but with a strong macro explanation in most cases. Check what the Fed and inflation are doing before giving the election credit.
- For the next year: use the rate regime, not the election. A rising-rate era produced higher yields after most midterms; a falling-rate era produced lower ones.
- For the dollar: there is no reliable midterm signal. Global rate differentials and risk appetite drive it.
If you want to watch how these macro inputs feed into individual stocks after the vote, you can open a live AI analysis of SPY or any ticker in SimianX live sessions. For the stock-side companions to this page, see the best sectors after midterm elections scoreboard and the presidential cycle table.
FAQ
Do bond yields go up or down after midterm elections?
Over the next three months the 10-year Treasury yield fell after 11 of the 16 midterms from 1962 to 2022, by a median of 20.5 bp. Over twelve months it rose after 9 of 16, in line with the long-run trend of each era.
How much does the 10-year yield move the day after a midterm?
Very little. The median next-day move was −0.5 bp, and the largest was −10 bp in 1982.
Is divided government good for bonds?
After the five midterms that turned a unified government into a divided one (1994, 2006, 2010, 2018, 2022), the 10-year yield was lower a year later four times, by a median of 60 bp. But the federal deficit did not reliably shrink afterwards, so the decline is better explained by the economy and the Fed than by gridlock.
Does the dollar rise or fall after midterms?
Neither reliably. A year after the vote the dollar was higher after 7 of 12 midterms on the major-currency index and 3 of 5 on the broad index, close to its normal odds.
Why is there no election-day data before 1986?
FRED has no 10-year Treasury observation on election day for the midterms of 1962 through 1982, when the market was closed for the vote, and the dollar index has no fixing on those dates either.
Where is the 10-year yield before the 2026 midterm?
4.91% at the November 2, 2026 close, down from a 2026 peak of 5.31% on October 5, which was the highest close since May 2002.
Related reading
- Stock Market After Midterm Elections: Every Cycle 1950–2026
- Is Gridlock Good for Stocks? 49 Congresses, 1927-2025
- Best Sectors After Midterm Elections: 100 Years of Data
- 2026 Midterms Meet the Fed: Is a September Rate Cut Dead?
- Trump Treasury Bond Buybacks: Midterm Ploy or Market Fix?
- Global Bond Selloff 2026: 30-Year Yields at 19-Year Highs
- Yield Curve Inversions and US Recessions: A Reference Table
- Every Fed Rate-Cut Cycle Since 1980: Stocks, Bonds & Gold
- Fed Interest Rate Decision: Latest FOMC Result and History
- US Dollar Rate History by Year: 14 Currencies Since 1971
- Presidential Cycle: S&P 500 Returns by Term Year, 1928–2025
- VIX After Midterm Elections: Every Midterm Since 1990
- Stocks in the Lame-Duck Session: 25 Midterms, 1926-2022
- Nasdaq After Midterm Elections: Every Midterm 1974-2022
- Oil Prices After Midterm Elections: WTI and Brent, 1986-2022
Sources
- FRED: 10-Year Treasury Constant Maturity Rate (DGS10)
- FRED: 10-Year Treasury Constant Maturity Rate, monthly (GS10)
- FRED: 2-Year Treasury Constant Maturity Rate (DGS2)
- FRED: Nominal Broad U.S. Dollar Index (DTWEXBGS)
- FRED: Nominal Major Currencies U.S. Dollar Index (DTWEXM, discontinued)
- FRED: Federal Surplus or Deficit as Percent of GDP (FYFSGDA188S)
- Federal Reserve: H.10 Foreign Exchange Rates release
- Wikipedia: Party divisions of United States Congresses
- Wikipedia: Election Day in the United States
This page is a historical reference, not investment advice. Past patterns across 16 elections do not predict future results.