
 By Marcus Reeve
Tech Selloff 2026: What Is Priced In, What Is Not, and What Comes Next
Quick answer: Not fully. As of the November 2, 2026 close, the selloff has priced in lower multiples for the companies spending and borrowing most on AI, but it has not priced in lower earnings: Wall Street's estimates for most of these 10 stocks are still flat or rising, and the VIX is only 21. Ending the US-Iran war would probably bring a sharp bounce and could lift the S&P 500 back to a record, but a V-shaped Nasdaq-100 recovery is not the base case, because the war did not cause this selloff and only 2 of 18 war endings since 1945 produced a V in the S&P 500. The midterm outcome looks mostly priced in, though historically that has not cancelled the rally that tends to follow. Our base case is a choppy repair that depends on Nvidia's November 17 report and on AI financing.
Updated November 2, 2026 (U.S. Pacific), after the U.S. close and before the November 3 midterm election. Election update, 1:50 a.m. ET November 4: Democrats won both the Senate and the House (AP and NBC News calls). Prices below are still November 2 closes unless dated otherwise. Every price is a closing price and every figure is dated.
The question behind this page is simple: has the tech selloff priced in the bad news, and what happens if the war ends or the election surprises? We tested two popular answers rather than assuming them. One says stocks will V-reverse once the fighting stops. The other says the midterm is already in the price. We ran 10 stock deep analyses on SimianX, then checked each price, multiple and earnings figure against independent data. Where a report and the data disagreed, we used the data.
Which War, and Where It Stands
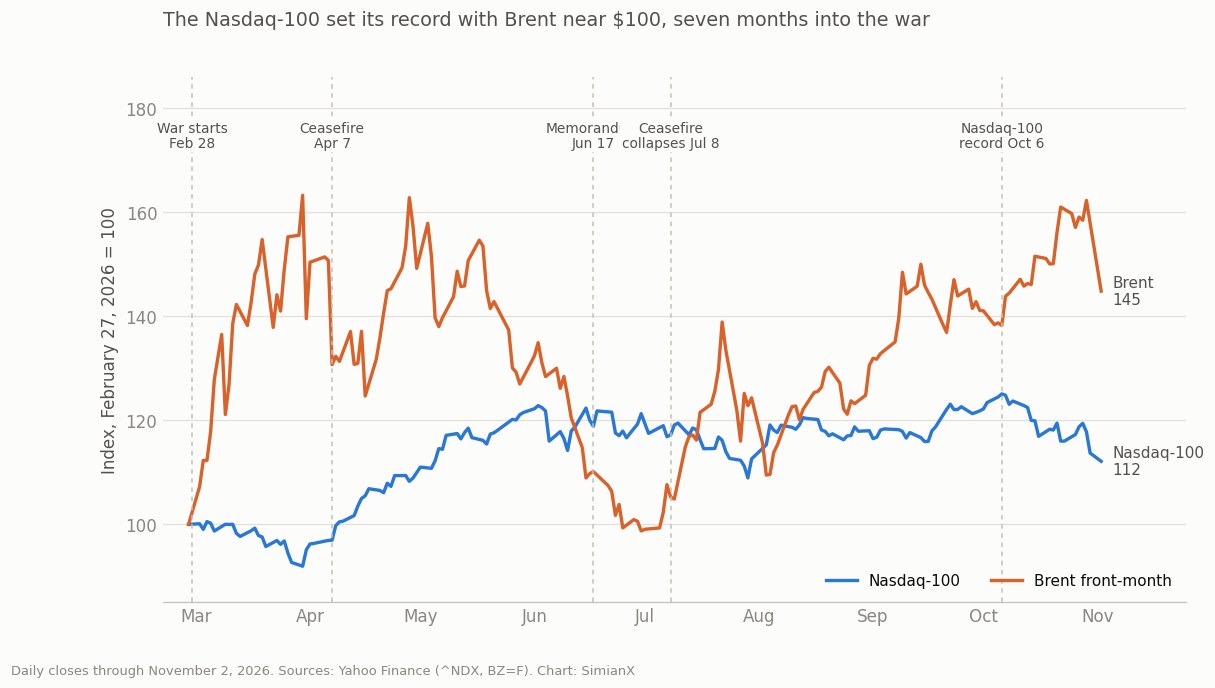
The war is the 2026 Iran war, which began on February 28 with US and Israeli strikes on Iran. It is not over. The April ceasefire led to the Islamabad Memorandum on June 17, then collapsed on July 8, and the 60-day window ran out in mid-August. As of November 2, there is no agreed ceasefire. Trump says a deal is "coming together", Iran says its offer to reopen the Strait of Hormuz could be carried out in two days if its conditions are met, and Vice President Vance says no deadline has been set.
| Date | Event | Nasdaq-100 | Brent | 10-yr yield |
|---|---|---|---|---|
| 2026-02-27 | Last close before the US and Israel strike Iran (Feb 28) | 24,960 | $72.48 | 3.96% |
| 2026-03-30 | War low for stocks, oil high, with Hormuz blocked | 22,953 | $118.35 | 4.34% |
| 2026-04-07 | Two-week ceasefire announced after the close | 24,202 | $94.75 | 4.34% |
| 2026-06-17 | Islamabad Memorandum signed; 60 days to negotiate | 29,671 | $79.85 | 4.46% |
| 2026-07-08 | Ceasefire collapses; fighting resumes | 29,253 | $76.30 | 4.57% |
| 2026-08-17 | 60-day window runs out with no deal | 29,995 | $91.02 | 4.72% |
| 2026-10-06 | Nasdaq-100 closing record, in the middle of the war | 31,224 | $100.20 | 5.27% |
| 2026-11-02 | No agreed ceasefire; Trump says a deal is "coming together" | 27,990 | $105.00 | 4.89% |
Closes from Yahoo Finance (^NDX, BZ=F, ^TNX). Brent is the front-month future, so contract rolls add small jumps. Our earlier coverage of this war: Iran War Impact on Stocks.
Is the War Driving This Selloff? Four Tests Say No
If the war were the cause, ending it would remove the cause. The data points elsewhere.
1. The timing is wrong. The Nasdaq-100 hit its record on October 6, three months after the ceasefire collapsed, with Brent at $100.20 and the 10-year yield at 5.27%. Between July 8 and October 6, Brent rose about 31% and the index rose about 7%. Investors were looking past the war at the top.
2. The wrong stocks are falling. A war shock hits airlines and consumers and lifts energy. That is what happened from February 27 to April 7. This selloff looks nothing like it: equal-weight S&P 500 stocks rose while chips fell by almost a fifth.
| Group | War shock: Feb 27 to Apr 7 | This selloff: Oct 6 to Nov 2 | Peace-headline day: Nov 2 |
|---|---|---|---|
| Nasdaq-100 (QQQ) | −3.1% | −10.3% | −1.4% |
| Semiconductors (SMH) | −1.6% | −19.6% | −2.7% |
| Technology sector (XLK) | −1.0% | −13.8% | −2.9% |
| S&P 500 (SPY) | −3.9% | −3.5% | −0.5% |
| Equal-weight S&P 500 (RSP) | −5.6% | +3.6% | +0.8% |
| Airlines (JETS) | −12.9% | −0.2% | +4.2% |
| Consumer staples (XLP) | −9.7% | +11.0% | +1.6% |
| Health care (XLV) | −8.5% | +10.5% | −0.1% |
| Financials (XLF) | −3.0% | +6.6% | +1.9% |
| Energy (XLE) | +7.6% | +5.5% | −4.0% |
| Long Treasuries (TLT) | −4.6% | +5.8% | −0.1% |
Polygon.io closes for each ETF, cross-checked against Yahoo Finance where available. Price return.
3. Rates fell, not rose. The 10-year yield dropped from 5.27% to 4.89% during the decline. StoneX noted the same break by mid-October: in the March, June and July drops, yields rose as stocks fell; this time, bonds rallied. The correlation between daily Nasdaq-100 and Brent moves went from −0.43 in the hot phase of the war to +0.55 since October 7, on just 15 paired sessions, so treat that as a hint and not a measurement.
4. Peace headlines did not help. November 2 was a natural experiment. Oil tumbled on deal hopes (the USO oil fund fell 7.1%, airlines rose 4.2%), yet the Nasdaq-100 lost 1.39% and the SOX 3.4%. Oracle fell 8.8% after filing to raise $20 billion in stock and bonds, Intel 8.8% and AMD 7.5%. Before October, this was not the pattern: on the 16 days between February 28 and October 6 when Brent fell 4% or more, the Nasdaq-100 rose 11 times and gained 0.84% on average, with a best day of +3.73% on June 15. It is one day, but it is the day that tested the hypothesis.
One more signal, with a caveat: across the 10 deep reports (about 424,000 characters), Iran, Hormuz and oil do not appear once, and the midterm appears once. Those reports are built around company news, so this proves nothing alone, but what their news agents surfaced was financing, guidance and capex.
So what is driving it? AI spending has outrun internal cash, and investors now care how the gap gets funded. The Magnificent 7 paid $647.2 billion for property and equipment in four quarters, up 82%. Alphabet's free cash flow was −$9.07 billion and the stock fell 12.6%. Meta posted its first negative quarter since 2012, S&P moved its outlook to negative, and it launched an equity plan that could reach about $97.5 billion. CoreWeave fell 15.5% on October 14 as a hot inflation report met debt worries, and Oracle lost 8.8% the same day. Intel's outlook on October 29 then set off the −3.46% session of October 30. The four worst sessions (October 14, 16, 22 and 30) add up to about the whole 10.4% decline. Chips peaked on June 22, months before the index, as our SOX crash history and AI momentum study would lead you to look for.
The war still matters. Brent is 45% above its pre-war $72.48 and the 10-year yield is 93 basis points higher, a drag covered in how the S&P 500 performs during oil shocks. Peace would remove that drag. It would not remove the AI funding question.
What Happened After 18 War Endings
Here is the base rate behind the V-reversal idea. We took every major war ending we could date since 1945 and measured from the last close before the news. By our rule, a V means a gain of 8% or more within 21 sessions plus a new 52-week closing high within 63 sessions. A grind means higher after 63 sessions without a V.
| War ending | Last close before news | S&P 500 vs 52-week high | S&P +1 session | S&P +21 | S&P +63 | S&P pattern | Nasdaq +21 | Nasdaq pattern |
|---|---|---|---|---|---|---|---|---|
| V-E Day, WWII in Europe | 1945-05-07 | 0.0% | +0.2% | +0.2% | −1.4% | Flat or down | — | — |
| V-J Day, WWII in the Pacific | 1945-08-14 | −4.4% | −0.5% | +5.5% | +16.9% | V | — | — |
| Korean War armistice | 1953-07-24 | −9.1% | −0.7% | −0.6% | +0.5% | Flat or down | — | — |
| Paris Peace Accords announced (Vietnam) | 1973-01-23 | −1.7% | −1.3% | −4.3% | −8.4% | Flat or down | −7.6% | Flat or down |
| Yom Kippur War ceasefire | 1973-10-24 | −8.3% | +0.2% | −9.8% | −12.2% | Flat or down | −13.2% | Flat or down |
| Fall of Saigon | 1975-04-29 | −8.0% | +1.9% | +4.7% | +3.0% | Grind | +5.1% | Grind |
| Falklands surrender | 1982-06-11 | −16.9% | −1.2% | −1.6% | +8.7% | Grind | −2.4% | Grind |
| Iran-Iraq ceasefire announced | 1988-08-05 | −19.5% | −0.4% | −2.1% | +3.0% | Grind | −2.7% | Flat or down |
| Gulf War ceasefire | 1991-02-27 | −0.4% | −0.2% | +2.0% | +4.1% | Grind | +7.0% | Grind |
| Kosovo: NATO halts bombing | 1999-06-09 | −3.6% | −1.2% | +6.4% | +1.9% | Grind | +10.9% | V |
| Iraq: "major combat" declared over | 2003-05-01 | −17.2% | +1.5% | +5.5% | +8.1% | Grind | +8.0% | V |
| Israel-Lebanon ceasefire | 2006-08-11 | −4.5% | +0.1% | +3.7% | +8.8% | Grind | +7.7% | Grind |
| Afghanistan withdrawal complete | 2021-08-30 | 0.0% | −0.1% | −3.7% | +2.8% | Grind | −4.9% | Grind |
| Gaza ceasefire announced | 2025-01-14 | −4.1% | +1.8% | +4.7% | −7.6% | Flat or down | +4.7% | Flat or down |
| Israel-Iran 12-day war ceasefire | 2025-06-23 | −1.9% | +1.1% | +5.5% | +11.1% | Grind | +7.1% | Grind |
| Gaza ceasefire agreed | 2025-10-08 | 0.0% | −0.3% | −0.5% | +2.5% | Grind | 0.0% | Grind |
| US-Iran two-week ceasefire | 2026-04-07 | −5.2% | +2.5% | +11.3% | +13.1% | V | +17.4% | V |
| Islamabad Memorandum signed | 2026-06-16 | −1.3% | −1.2% | −0.7% | +0.5% | Flat or down | −3.2% | Flat or down |
S&P 500 and Nasdaq Composite price returns from Yahoo Finance; the five rows since 2025 match a second vendor (CNBC) to the cent. The Nasdaq Composite begins in 1971. Dates are judgment calls where a war ended in stages. Small sample, with hand-picked events: read this as a guide, not a law.
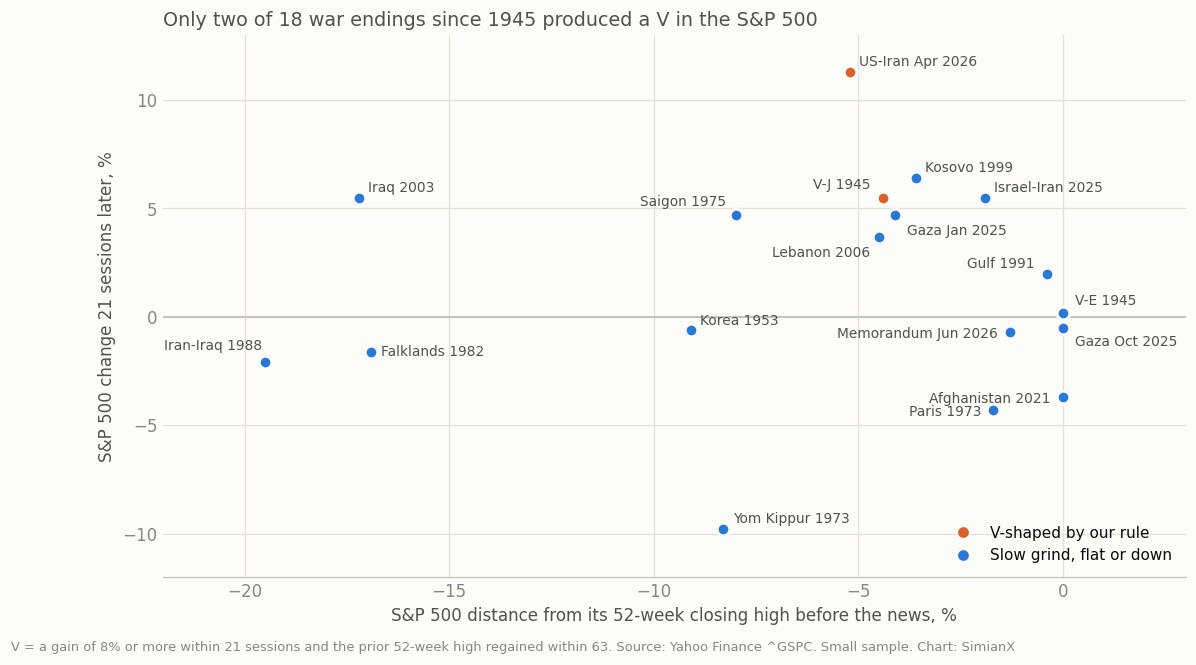
- V-shaped recoveries were rare. S&P 500: 2 of 18 (V-J Day 1945 and April 2026), with 10 grinds and 6 flat or down. Nasdaq Composite: 3 of 15.
- The typical ending looks like an ordinary month. The median S&P 500 change after 21 sessions was +1.1%, higher in 10 of 18, against +1.1% and 61% for all days since 1945. After 63 sessions it was +2.9%, against +2.7%.
- A hole did not guarantee a rebound. Of the seven endings with the S&P 500 at least 5% below its high, only April 2026 produced a V.
- Big rallies came when the fog lifted, often well before the end. In 1990–91 the S&P 500 fell 19.9% into October and had gained 24.5% by the day before the Gulf War ceasefire, including +3.7% on the first day of the air war. In 2003 it rose 11.9% from March 11 to March 21, as the Iraq invasion began, then only 5.5% in the 21 sessions after "major combat" was declared over. See also Buy the Invasion.
Which episodes fit? April 2026 is the best evidence for the V idea and the strongest counterpoint to this article: the Nasdaq-100 fell 8.0% in the first month of the war, then gained 13.4% from April 7 to April 30. Two things limit it. That hole was made by the war, and this one was not. And the April rally overlapped a strong earnings season (Alphabet +10.0% and Intel +23.6% after their April reports) while Brent rose from $94.75 to $108.17, so it was never just an oil-relief trade. The June memorandum, signed with the index near its highs, produced nothing. The warning case is Yom Kippur 1973: fighting stopped, the oil shock did not, and the S&P 500 fell another 9.8% in 21 sessions. If a deal leaves Hormuz half-open, that is the relevant memory.
What Is Priced In: The Market Gauges
| Gauge | Latest | Context | What it says |
|---|---|---|---|
| S&P 500, from Oct 6 record | −3.55% (7,541.40) | Needs +3.7% to regain the record | Broad market has priced very little |
| Nasdaq-100, from Oct 6 record | −10.36% (27,989.82) | Needs +11.6%; first close 10% down | A normal correction so far |
| SOX chip index, from Jun 22 record | −29.43% | Peak came 15 weeks before the Nasdaq-100 record | Chips have priced the most |
| Equal-weight S&P 500 (RSP), since Oct 6 | +3.6% | Staples +11.0%, health care +10.5% | Rotation, not panic |
| S&P 500 forward P/E vs 5-year average | 18.7 / 19.8 | FactSet, Oct 30; 10-year average 19.1 | Index multiple is already below average |
| S&P 500 Q3 earnings growth | +30.2% | 82% beat EPS; FactSet, Oct 30 | Earnings cuts are not in the numbers |
| VIX, Nov 2 | 21.15 | 15.01 on Oct 6; 31.05 peak on Mar 27; 19.8 median at similar Nasdaq-100 drawdowns | Concern, not capitulation |
| VIX9D / VIX / VIX3M | 22.46 / 21.15 / 21.60 | 9-day above 30-day; 3-month still above 30-day | Event risk near term, no broad stress curve |
| High-yield spread, Oct 30 | 3.44% | 3.03% on Oct 6; 3.46% war high on Mar 30 | Credit is the gauge that has moved |
| 10-year Treasury yield | 4.89% | 5.27% on Oct 6; 3.96% before the war | Falling yields did not stop the selloff |
Sources: Yahoo Finance; FactSet Earnings Insight, October 30; FRED high-yield spread and 10-year yield; Cboe VIX. Longer context: VIX spike history.
This is the core finding. Prices fell and estimates did not, so the damage so far is multiple compression. S&P 500 forward earnings at 18.7 times sit below the five-year average of 19.8, yet Q3 earnings growth is running at 30.2%. A market that had priced in an AI bust would show estimates rolling over, a VIX well above 21 and a stressed volatility curve. The one gauge that has moved meaningfully is credit, which is back near its March war high. That is where to watch.
The 10 Stocks: Priced In or Not
We chose the 10 by how far they fell and how much they matter to the indexes. We left out Apple (−3.0% from its October 29 high), Tesla (+6.1% since October 6) and Palantir (−14.7%) as less central to the AI-funding question, and added Intel, which started the October 30 rout.
| Stock | 52-week high | Drawdown | Nov 2 close | Nov 2 move | Forward P/E | Trailing P/E / 5-yr median / percentile | Latest report: next-session move | Consensus EPS, 1-month change | Option-implied move to Nov 20 |
|---|---|---|---|---|---|---|---|---|---|
| ORCL | 2025-11-03 | −53.8% | $119.22 | −8.8% | 16.9 | 18.7 / 33.0 / P0 | 2026-09-10: −1.7% | +0.1% | ±11.4% |
| INTC | 2026-06-22 | −57.4% | $59.97 | −8.8% | 43.5† | n/m / 11.0 / — | 2026-10-29: −28.6% | +2.9% | ±12.5% |
| AVGO | 2026-06-02 | −33.1% | $322.23 | −1.2% | 20.6 | 41.1 / 46.1 / P44 | 2026-09-02: −2.7% | 0.0% | ±9.1% |
| MU | 2026-06-25 | −31.3% | $833.59 | −5.8% | 4.7 | 11.2 / 21.6 / P26 | 2026-09-30: +3.0% | +7.8% | ±11.8% |
| GOOGL | 2026-05-13 | −30.7% | $278.99 | −0.3% | 20.6 | 14.6 / 25.2 / P0‡ | 2026-10-28: −12.6% | −2.4% | ±6.1% |
| AMD | 2026-10-06 | −28.1% | $466.84 | −7.5% | 48.3 | 120.0 / 108.8 / P58 | 2026-08-04: −7.0% | +0.2% | ±14.0% |
| META | 2026-09-24 | −22.0% | $606.73 | −1.3% | 19.5 | 20.7 / 27.2 / P22 | 2026-10-21: −7.0% | +2.5% | ±7.7% |
| NVDA | 2026-10-06 | −15.5% | $202.06 | −1.3% | 16.8 | 25.5 / 57.1 / P0 | 2026-08-26: +8.7% | +0.5% | ±9.8% |
| AMZN | 2026-08-03 | −13.5% | $245.63 | +2.2% | 23.9 | 19.9 / 49.5 / P1‡ | 2026-10-29: −1.4% | −0.4% | ±6.3% |
| MSFT | 2026-10-13 | −6.7% | $507.12 | −2.8% | 24.7 | 26.5 / 34.0 / P16 | 2026-10-28: −0.2% | +0.9% | ±5.7% |
Closes: Polygon.io, matched against Yahoo Finance. Forward P/E: price over the next four unreported quarters of consensus EPS from Nasdaq's analyst data, snapshot November 2. Trailing P/E: GAAP EPS from SEC filings, against its own daily five-year range (P0 = lowest). We could not source a verified history of forward P/E, so history uses trailing P/E. ‡Alphabet and Amazon trailing EPS is inflated by non-operating investment gains, which flatters both P/Es. †Intel's consensus lags its October 29 guidance, so its forward P/E is understated. Report dates are from SEC 8-K Item 2.02 filings; all came after the close, so the move is the next session. AMD reports November 3 and Nvidia November 17. The implied move is the at-the-money November 20 straddle over the close, not a forecast. The Consensus EPS column is the current fiscal year.
| Stock | Why it is here | Committee rating | What the deep analysis flagged | Priced-in verdict |
|---|---|---|---|---|
| ORCL | Biggest AI-debt story | Hold | Negative free cash flow of $28.7B and the new $20B raise | Mostly priced. Open risk: credit |
| INTC | Set off the Oct 30 rout | Sell | Lower Q4 guidance and weak PC demand | Partly. Guidance is in; the multiple is still high |
| AVGO | Custom AI chips, Anthropic exposure | Hold | Contingent Anthropic financing backstops; 41x trailing EPS | Partly. Mid-range multiple, risk still unsized |
| MU | Memory-cycle peak risk | Hold | Whether an 86.8% gross margin is the peak | Partly. 4.7x says peak; no cuts yet |
| GOOGL | Largest earnings shock among the seven | Hold | Second straight quarter of negative free cash flow | Mostly priced for 2026; 2027 capex is open |
| AMD | Up most in 2026 before the fall | Hold | Reported Nov 3: revenue $13.4B (+45%), Q4 guide ~$17B (+66%) | Not priced before the report. Guidance raised the bar; the Nov 4 move decides it |
| META | Capex paid partly with new equity | Sell | Capex-driven cash-flow collapse and financing | Partly. Cheap on earnings, not on cash |
| NVDA | Largest index weight | Sell | The November 17 report if results merely meet hopes | Not priced: an AI spending cut |
| AMZN | Largest capex bill | Hold | Capex above operating cash flow | Not priced. Small fall, largest cash gap |
| MSFT | The control: smallest fall | Hold | Falling free cash flow despite strong Azure | Not priced, with the least stress |
Verdict rule. Mostly priced: down 30% or more, trailing P/E in the lower third of its own range, and estimates no longer rising. Not priced: down less than 20%, or forward P/E above 40 with estimates still rising. Partly: everything in between. These are our judgments from public data. "Not priced" means the price has not discounted a bad outcome. It does not mean the stock will fall.
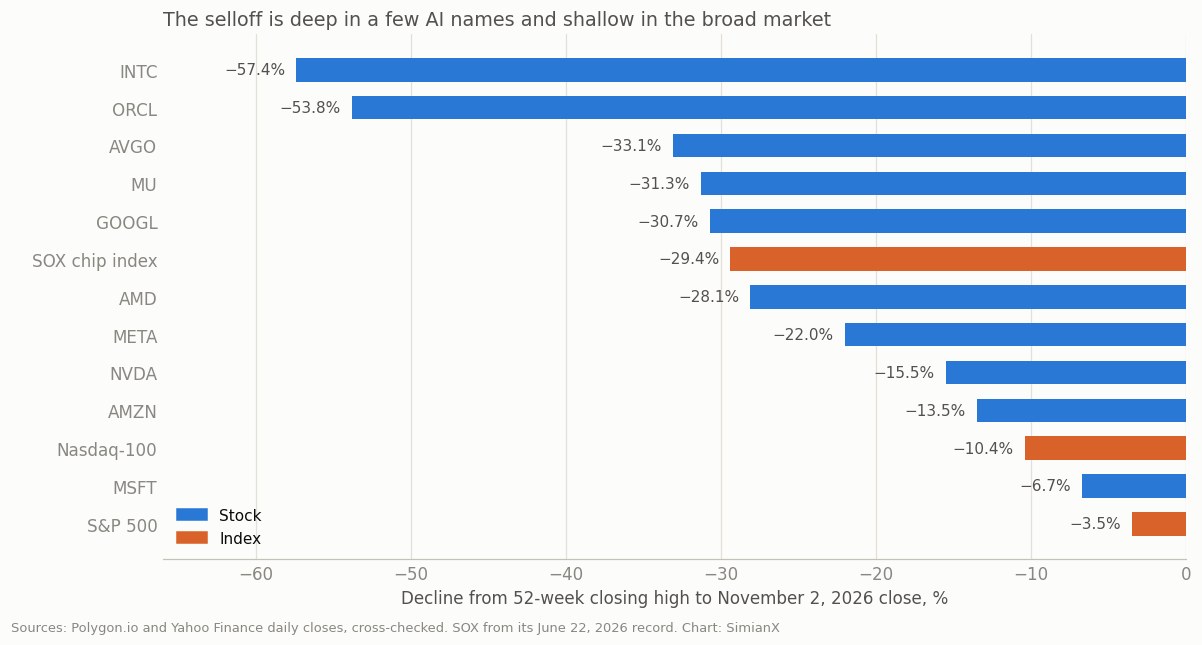
Three patterns stand out. The spenders were hit on cash. Alphabet, Meta and Oracle have negative or collapsing free cash flow, and each is down 22% or more. Amazon has the same gap and has fallen far less. The suppliers were hit on multiple alone. Micron at 4.7 times forward earnings shows a market that refuses to capitalize an 86.8% gross margin, yet its estimates rose 7.8% in a month. Nvidia's trailing P/E of 25.5 is the lowest of its five-year range. A real cut in AI spending has not been priced into either one. Oracle shows the credit link. With $125.34 billion of debt and a BBB− rating, it is down 53.8%, and the next question for it is about ratings.
A note on the deep analyses. The 10 runs used the swing (2–8 week) horizon and returned three sells (Nvidia, Meta, Intel), seven holds and no buys. The committee rarely says buy, so that split is weak evidence by itself. Its useful output was the list of flagged risks. Several reports contained errors we corrected, listed under Methodology.
Is the Midterm Priced In?
Mostly, in the sense of the outcome. Prediction markets gave Democrats about 85% to 92% odds on the House in October, with the Senate near a coin flip, so a split result would not be news. History also says election results move the market less than their reputation suggests: the median absolute next-session move since 1950 is 0.70%, and it beat the prior 60-session average in only 7 of 19 cases. Update, November 4: Democrats won both the Senate and the House, a better result for them than the coin-flip Senate odds implied. How much of that was priced in shows up in the November 4 session.
| Window from election day | S&P 500 median | Higher | Nasdaq median | Higher |
|---|---|---|---|---|
| Next session | +0.6% | 15/19 | +0.2% | 9/13 |
| +21 sessions | +2.3% | 15/19 | +2.2% | 10/13 |
| +63 sessions | +6.6% | 17/19 | +8.5% | 11/13 |
| +126 sessions | +15.6% | 19/19 | +15.5% | 13/13 |
| 12 months | +14.5% | 19/19 | +20.2% | 12/13 |
| Same calendar spot in non-midterm years, +63 | +3.6% | 40/57 | — | — |
S&P 500 from 1950 (19 midterms), Nasdaq Composite from 1974 (13). Windows are trading sessions, except the S&P 500's 12-month row, which is calendar-based and comes from our midterm reference table, and the Nasdaq's, which is 252 sessions. Overlapping cycles and a small N: 19 is not many.
| Midterm | Outcome | Next session | +21 sessions | +63 sessions |
|---|---|---|---|---|
| 2006 | Democrats take both chambers | +0.21% | +1.8% | +4.0% |
| 2010 | Republicans take the House | +0.37% | +2.3% | +9.3% |
| 2014 | Republicans take the Senate | +0.57% | +3.0% | +2.5% |
| 2018 | Democrats take the House | +2.12% | −4.4% | −1.7% |
| 2022 | Republicans narrowly take the House | −2.08% | +3.5% | +6.6% |
But "priced in" and "no rally" are different claims. The next 63 sessions have beaten the same calendar spot in other years, and the S&P 500 has been higher a year after all 19 midterms. Technology has an especially good record, as our 100-year sector scoreboard shows, and split government has not hurt. That is a tailwind, not a catalyst. 2018 is the closest parallel, a tech-led correction in a midterm year: the S&P 500 gained 2.1% the day after the vote, then fell further, and a year later was up 12%. An election rally does not repair a sector problem on schedule. For names and policy angles see 12 midterm stocks and three scenarios and the presidential cycle table.
What Happens Next: Scenarios and Tests
November 2 was the Nasdaq-100's first close 10% below this record. Since 1990 there have been 32 earlier such episodes with a completed month. A month later the index was higher in 22, with a median of +3.3%; after three months, 25, with a median of +10.2%. Along the way the median further low was −5.6%, and the worst cases (2000, 2022) kept falling for many months. Those odds beat an ordinary day, as our Nasdaq worst-days table sets out, but the sample leans on the 1990s and history is not a forecast. Of the 32, 25 ended before reaching −20%; the rest became full bear markets.
| Scenario | Conditions | What the evidence points to | What would prove this wrong |
|---|---|---|---|
| War ends | Signed deal, Hormuz reopens, blockade lifted, Brent keeps falling from $105 | A sharp bounce led by oil-sensitive and broad-market stocks. The S&P 500 is 3.7% from its record and could get there first. The Nasdaq-100 needs 11.6%, so it lags unless AI financing fears also ease. | The Nasdaq-100 gains 8% or more within 21 sessions and regains its record within 63, with no change in capex plans or credit spreads |
| War drags on | No deal, Brent stays above $100, or new strikes | Not decisive alone. The index set its record with Brent at $100 and the ceasefire dead. The danger is a yield rebound above the 5.27% of Oct 6, added to AI funding costs. | The Nasdaq-100 falls in step with rising oil and yields while AI credit spreads stay calm: that would make this a war selloff after all |
| Midterm surprise | Republicans hold the House, or Democrats also win the Senate clearly | A day or two of repricing, roughly the ±2% of 2018 and 2022, then back to AI earnings and financing. | A move of more than 3% that persists for five sessions and is clearly tied to the result, or tech-specific policy news from the outcome |
| AI financing (the real driver) | AMD on Nov 3, Nvidia on Nov 17, new bond and equity deals, credit spreads | This decides the path. Good guidance plus orderly funding gives a choppy repair. A guidance cut would put earnings cuts into prices for the first time. AMD's Nov 3 guidance (~$17B for Q4, +66%) was the good-guidance case; Nvidia on Nov 17 is next. | Estimates for the chip names fall while the stocks rise, or spreads keep widening while the stocks rise |
As of 1:50 a.m. ET on November 4, the second half of the surprise case happened: Democrats won the Senate as well as the House. Whether it becomes a market surprise depends on the next five sessions.
What would break our conclusion overall? Three things. First, estimate cuts arriving in the chip names while the stocks hold, which would mean more was priced than we think. Second, a fast Nasdaq-100 recovery on a peace deal alone, which would mean the war mattered more than these tests suggest. Third, a VIX spike above its March high of 31 with spreads through 3.46%, which would mean the selling has moved from AI to everything.
You can follow large moves on Market Pulse, run a live AI analysis or a deep analysis on a ticker to test a view, and check our AI capex reference. None of these tell you what the market will do next.
Methodology and Limits
- Prices. Closing prices through November 2, 2026, from Polygon.io and Yahoo Finance; split-adjusted; price return. FRED's index and spread series run one or two days behind, and we date each figure.
- Drawdown. From the 52-week closing high, ignoring intraday moves. Oracle's all-time closing high was $328.33 on September 10, 2025, so measured from there its drop is larger.
- Deep analysis corrections. Reports used October 30 prices for valuation in several cases, after the November 2 close was available. Alphabet's report repeated a press line that shares rose 1.85% on November 2; the close was −0.30%. AMD's and Broadcom's reports dated the October 30 falls to October 31. Intel's quoted a Q3 EPS of $0.41 against a company figure of $0.52 on a non-GAAP basis. Broadcom's cited a $43 billion maximum backstop liability; the filed figure we could confirm is about $29 billion, and the larger number traces to unnamed sources. Nvidia's called the valuation stretched at 25.6 times earnings, which is the bottom of its own five-year range; it was reading free cash flow. Microsoft's run used no web search, unlike the other nine.
- Weakest claims. The verdicts are judgment. The V rule is our own and a different threshold would change the count. War endings are few and hand-dated. Nasdaq's consensus feed can lag new guidance. The October correlation uses 15 sessions and one contract roll.
- What this is not. No price targets are ours, and analyst or model ratings are reported only as data.
Frequently Asked Questions
Is the tech selloff priced in?
Partly. Lower multiples are priced for the heaviest AI spenders and borrowers, especially Oracle and Alphabet. Lower earnings are not: consensus estimates for most of the 10 stocks are flat or rising, S&P 500 Q3 earnings growth is 30.2%, and the VIX is 21.
Will stocks V-reverse if the Iran war ends?
A sharp bounce is plausible and the S&P 500 is only 3.7% from its record. A V in the Nasdaq-100 is not the base case, because it needs 11.6% and the selloff is about AI funding. Only 2 of 18 war endings since 1945 produced a V in the S&P 500.
Did the war cause the October 2026 selloff?
The evidence says no. The Nasdaq-100 set its record on October 6, months into the war with Brent at $100. Since then equal-weight stocks rose, airlines were flat, yields fell, and the index dropped on a day of peace headlines.
How much further could the Nasdaq fall?
Nobody knows. After 32 earlier first closes 10% below a record since 1990, the median further low was −5.6%, but the 2000 and 2022 cases went much deeper. The option-implied range for November 20 runs from about ±6% for Microsoft to ±14% for AMD.
Is the midterm election priced in?
Democrats won both the Senate and the House, so the result leaned further toward Democrats than the most likely split. The outcome mostly is, since a Democratic House was heavily favored and the Senate was close. The historical tendency to rise afterward has persisted anyway: the S&P 500 was higher a year later after all 19 midterms since 1950. That is a small sample and not a promise.
Which of these AI stocks look most and least priced in?
By our rule, Oracle and Alphabet are mostly priced. Meta, Broadcom, Micron and Intel are partly priced. Nvidia, AMD, Amazon and Microsoft are not priced for a bad outcome. That is a description of risk in the price and not a recommendation.
What are the next dates to watch?
AMD reported on November 3 (Q3 revenue $13.4B, Q4 guide about $17B); Nvidia reports November 17. Credit spreads and new AI bond or stock sales matter between those dates.
Related Reading
- Nasdaq's Worst Days: Every Major Drop and What Came Next
- Magnificent 7 Earnings Dates and Results: Q3 2026 Tracker
- Stock Market After Midterm Elections: Every Cycle 1950–2026
- Best Sectors After Midterm Elections: 100 Years of Data
- Is Gridlock Good for Stocks? 49 Congresses, 1927-2025
- 2026 Midterm Election Stocks: 12 Tickers, 3 Scenarios
- Presidential Cycle: S&P 500 Returns by Term Year, 1928–2025
- 2026 Midterms and Energy Stocks: XOM, CVX, FSLR Outlook
- Do Defense Stocks Rise After Midterms? LMT, RTX, NOC 2026
- Iran War Impact: Stocks Risk-Off, Oil $100-$120, VIX Spike
- How the S&P 500 Performs During Oil Shocks: 1973–2026
- AI Capex 2026: Big Tech Now Spends 96% of Its Cash Flow
- Semiconductor Bear Markets: Every SOX Crash, 1995–2026
References
- Wikipedia — 2026 Iran war and 2026 Iran war ceasefire
- Al Jazeera — Trump signals progress on Iran deal, November 2, 2026
- CNBC — Iran ceasefire ends, August 17, 2026
- FactSet — Earnings Insight, October 30, 2026
- StoneX — Nasdaq 100 selloff has a twist, October 15, 2026
- Quartz — Oracle is raising $20 billion in bonds and stock, November 2, 2026
- The Next Web — S&P turns negative on Meta
- The Globe and Mail — Meta's planned equity offering
- Intel — third-quarter 2026 results (SEC filing)
- DeFi Rate — midterm prediction-market odds
- FRED — high-yield spread, 10-year yield
- Yahoo Finance — Nasdaq-100 daily history and S&P 500 daily history
This is general market analysis for education, based on public data as of the dates shown. It is not personalized advice and it is not investment advice.