
 By Marcus Reeve
The Gridlock Trade Has It Exactly Backwards
Every two years, as the midterm campaign reaches its last stretch, the same line goes around the desks and the cable panels: gridlock is good for stocks. A divided Washington cannot pass anything, the argument goes, so it cannot raise your taxes, cannot re-regulate your sector, cannot spring a surprise on your model. Markets like boredom. Split the government and you buy yourself two years of quiet.
It is a tidy story. It is repeated with total confidence. And almost nobody who repeats it has checked it.
So we checked it. We took every Congress seated since January 1927 — 49 complete two-year terms, ending with the 118th — classified each one by who actually controlled the House, the Senate and the White House, and measured the total return of the US stock market across the full term. The answer is not ambiguous, and it is not the answer you have been told.
Unified government won. Across all 49 Congresses, terms in which one party held all three levers returned an average of +30.6% over the two years, against +22.5% when Washington was divided — a gap of roughly eight percentage points per term, or 13.4% a year against 9.5%. Narrow the sample to the postwar era and the gap survives: +31.1% versus +25.5%. Exclude the pre-1935 Congresses, which convened in March under the old calendar, and it survives. Reclassify the messiest Senate in the sample and it survives.
The gridlock trade, measured over a century, has the sign backwards.
What follows is the full reference table — all 49 Congresses, the configuration of each, and the return that followed — plus the two findings that complicate the headline. Because the honest version of this story is not "gridlock is bad." It is that divided government turns out to be two completely different regimes wearing the same name, and that the last twenty years have run the other way.
Where "is gridlock good for stocks?" comes from
The claim has a real intellectual ancestor. The reasoning is that policy uncertainty is itself a risk premium: if a single party can move tax, spending and regulatory law at will, the range of outcomes a business must plan around is wider, and investors discount that. Split the legislature and the policy distribution narrows toward the status quo. There is genuine academic work on economic policy uncertainty that makes this case seriously.
The trouble is the leap from the mechanism to the market statistic. "Uncertainty is priced" does not imply "divided Congresses produce higher returns." A narrower policy distribution can just as easily mean a smaller fiscal response when the economy needs one — and the record of the last century contains several occasions when Washington's ability to act quickly was worth a great deal more to equity holders than its inability to surprise them.
There is also a survivorship problem in how the cliché is usually evidenced. The canonical example is the 104th Congress — the 1994 Republican sweep against Bill Clinton — followed by a booming market. It is a real data point. It is also one data point, drawn from the middle of the largest bull market in modern history, and the people who cite it rarely go on to mention the 110th Congress, seated after the 2006 midterms, which delivered −33.0%.
How this was measured
Everything below rests on one return series and one classification, both stated plainly so you can check them.
Returns. The market series is the CRSP value-weighted total return of the entire US stock market, dividends reinvested, taken from the Kenneth R. French Data Library at Dartmouth — the same source used in our sector scoreboard for the 100 years after midterms. It is broader than the S&P 500 and it is total return, not price return, which matters over two-year windows.
Windows. Each Congress is measured over the 24 calendar months from January of the odd-numbered year through December of the following even-numbered year. Since the Twentieth Amendment took effect in 1935, Congress has been seated on January 3, so the window is nearly exact. The four Congresses before that convened in March, so their windows are approximations; excluding them entirely leaves the result unchanged (+29.9% unified against +25.5% divided).
Classification. Party control of each chamber comes from the official Senate party division records and the corresponding House party divisions. Every term falls into one of three buckets:
- Unified government — the president's party holds both the House and the Senate. 24 of the 49.
- Split Congress — the House and the Senate are held by different parties. 9 of the 49.
- Opposition Congress — the president's party holds neither chamber. 16 of the 49.
The last two are what people mean when they say "divided government." Keeping them apart turns out to be the single most important choice in this analysis.
Two terms need a note. The 107th Congress (2001–2003) began 50–50 with a Republican vice-presidential tiebreak, went Democratic in June 2001 when Senator Jim Jeffords left the party, and returned to Republican control after November 2002; we classify it by the majority that held for most of the term, which makes it a Split Congress. The 117th (2021–2023) was also 50–50, with the tiebreak the other way, and counts as Democratic and therefore unified. Reclassifying the 107th as a Republican trifecta moves the unified average to +28.2% and the divided average to +24.7% — the ranking does not change.
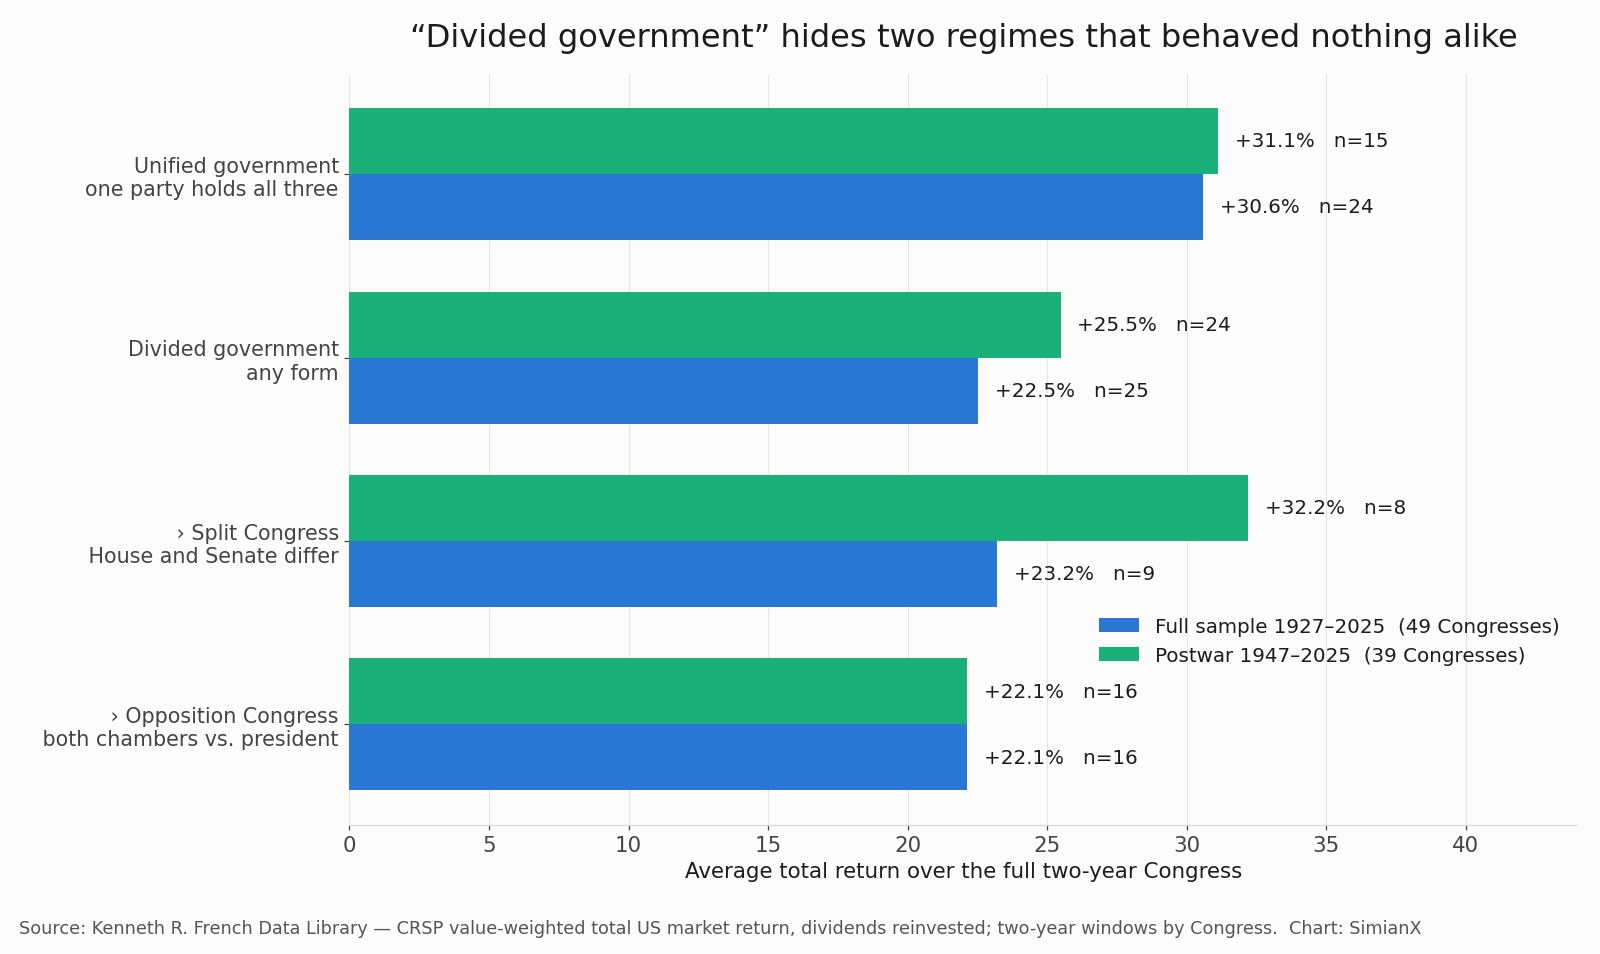
The scoreboard: 49 Congresses, 1927–2025
Here is the headline result in one table.
| Configuration | Terms | Avg 2-yr return | Median | Annualized | Positive terms |
|---|---|---|---|---|---|
| Unified government | 24 | +30.6% | +33.4% | 13.4% | 20 of 24 (83%) |
| Divided government (all) | 25 | +22.5% | +21.1% | 9.5% | 20 of 25 (80%) |
| — Split Congress | 9 | +23.2% | +27.3% | 9.4% | 7 of 9 (78%) |
| — Opposition Congress | 16 | +22.1% | +20.5% | 9.5% | 13 of 16 (81%) |
| All 49 Congresses | 49 | +26.5% | +27.3% | 11.4% | 40 of 49 (82%) |
Three things deserve to be said out loud before anyone builds a position on this.
The first is that the hit rate barely moves. Unified terms were positive 83% of the time, divided terms 80%. Whatever is going on, it is not that gridlock makes losses more likely. The gap is in the size of the winners, not the frequency of them.
The second is that 40 of 49 terms were positive regardless of who ran Washington. That is the single most useful number on this page. The base rate for "the US stock market rises over any given two-year stretch" is 82%, and no political configuration in a century pushed it below 78%.
The third is that a sample of 49 non-independent two-year windows, spanning the Depression, a world war, the inflation of the 1970s and two technology booms, cannot carry a strong causal claim. An eight-point spread across 24 versus 25 observations is not a factor. It is a fact about history that happens to point the opposite way from the cliché.
"Divided government" is two regimes wearing one name
This is where the story gets genuinely interesting, and where the postwar sample says something the full sample hides.
A Congress in which the House and the Senate are held by opposing parties is not remotely the same animal as a Congress in which both chambers are lined up against the president. In the first case the legislature is deadlocked and the president still holds the veto plus a working relationship with one chamber. In the second, a coherent opposition majority controls the entire legislative agenda, subpoena power, appropriations and the confirmation calendar, and the only tool left to the White House is the veto.
Postwar, those two regimes produced very different results:
| Postwar configuration, 1947–2025 | Terms | Avg 2-yr return | Median | Annualized |
|---|---|---|---|---|
| Split Congress | 8 | +32.2% | +39.2% | 14.2% |
| Unified government | 15 | +31.1% | +37.0% | 14.1% |
| Opposition Congress | 16 | +22.1% | +20.5% | 9.5% |
Read that table carefully, because it is the most defensible finding in this article. In the postwar era the best-performing configuration was not unified government at all — it was a split Congress, the one form of gridlock almost nobody has in mind when they use the word. And the worst was an opposition Congress, which is precisely the outcome most people are picturing when they say the midterms will deliver "gridlock."
So "gridlock is good for stocks" is not simply wrong. It is right about a narrow case and wrong about the common one, and it uses a single word for both. Every one of the 16 opposition Congresses in the sample came after 1947, which is why the full-sample and postwar figures for that bucket are identical.
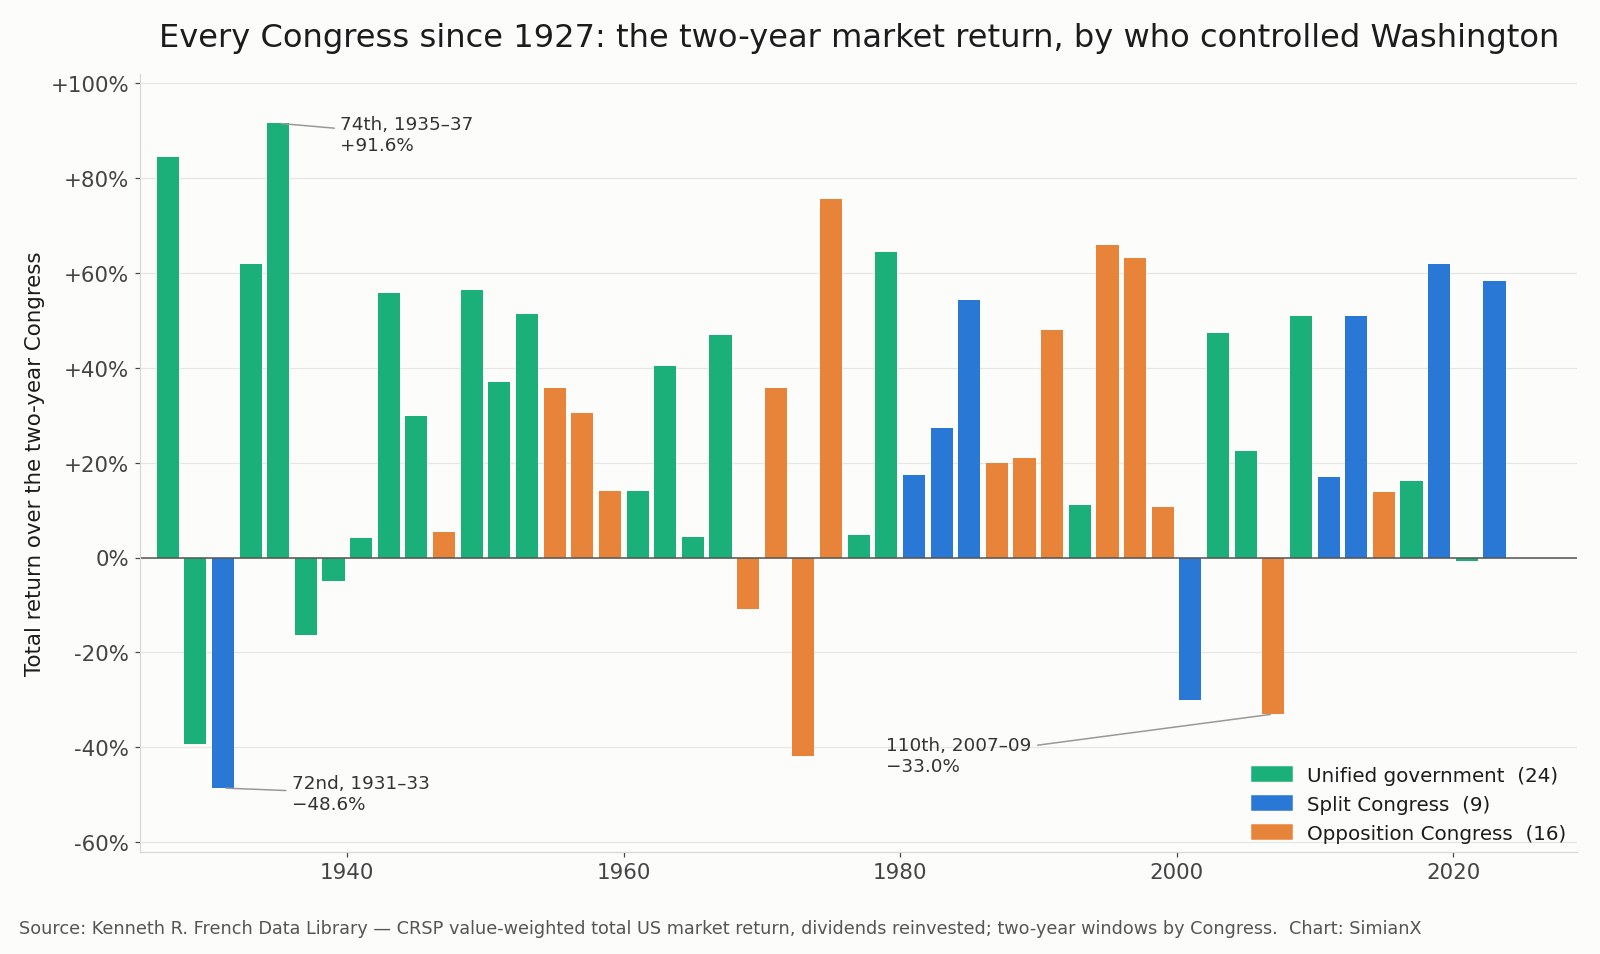
Every Congress since 1927: the reference table
The complete record. President's party in parentheses; Senate and House columns give the majority party for the term; return is the total return of the US market across the full 24 months.
| Congress | Years | President | Senate | House | Configuration | Two-year total return |
|---|---|---|---|---|---|---|
| 70th | 1927–1929 | Coolidge (R) | R | R | Unified | +84.4% |
| 71st | 1929–1931 | Hoover (R) | R | R | Unified | -39.3% |
| 72nd | 1931–1933 | Hoover (R) | R | D | Split Congress | -48.6% |
| 73rd | 1933–1935 | F. Roosevelt (D) | D | D | Unified | +61.9% |
| 74th | 1935–1937 | F. Roosevelt (D) | D | D | Unified | +91.6% |
| 75th | 1937–1939 | F. Roosevelt (D) | D | D | Unified | -16.3% |
| 76th | 1939–1941 | F. Roosevelt (D) | D | D | Unified | -4.9% |
| 77th | 1941–1943 | F. Roosevelt (D) | D | D | Unified | +4.2% |
| 78th | 1943–1945 | F. Roosevelt (D) | D | D | Unified | +55.7% |
| 79th | 1945–1947 | Roosevelt / Truman (D) | D | D | Unified | +29.9% |
| 80th | 1947–1949 | Truman (D) | R | R | Opposition Congress | +5.4% |
| 81st | 1949–1951 | Truman (D) | D | D | Unified | +56.3% |
| 82nd | 1951–1953 | Truman (D) | D | D | Unified | +37.0% |
| 83rd | 1953–1955 | Eisenhower (R) | R | R | Unified | +51.4% |
| 84th | 1955–1957 | Eisenhower (R) | D | D | Opposition Congress | +35.8% |
| 85th | 1957–1959 | Eisenhower (R) | D | D | Opposition Congress | +30.5% |
| 86th | 1959–1961 | Eisenhower (R) | D | D | Opposition Congress | +14.1% |
| 87th | 1961–1963 | Kennedy (D) | D | D | Unified | +14.0% |
| 88th | 1963–1965 | Kennedy / Johnson (D) | D | D | Unified | +40.4% |
| 89th | 1965–1967 | Johnson (D) | D | D | Unified | +4.4% |
| 90th | 1967–1969 | Johnson (D) | D | D | Unified | +46.9% |
| 91st | 1969–1971 | Nixon (R) | D | D | Opposition Congress | -10.9% |
| 92nd | 1971–1973 | Nixon (R) | D | D | Opposition Congress | +35.8% |
| 93rd | 1973–1975 | Nixon / Ford (R) | D | D | Opposition Congress | -41.7% |
| 94th | 1975–1977 | Ford (R) | D | D | Opposition Congress | +75.7% |
| 95th | 1977–1979 | Carter (D) | D | D | Unified | +4.9% |
| 96th | 1979–1981 | Carter (D) | D | D | Unified | +64.5% |
| 97th | 1981–1983 | Reagan (R) | R | D | Split Congress | +17.5% |
| 98th | 1983–1985 | Reagan (R) | R | D | Split Congress | +27.3% |
| 99th | 1985–1987 | Reagan (R) | R | D | Split Congress | +54.4% |
| 100th | 1987–1989 | Reagan (R) | D | D | Opposition Congress | +19.9% |
| 101st | 1989–1991 | G.H.W. Bush (R) | D | D | Opposition Congress | +21.1% |
| 102nd | 1991–1993 | G.H.W. Bush (R) | D | D | Opposition Congress | +48.0% |
| 103rd | 1993–1995 | Clinton (D) | D | D | Unified | +11.0% |
| 104th | 1995–1997 | Clinton (D) | R | R | Opposition Congress | +65.9% |
| 105th | 1997–1999 | Clinton (D) | R | R | Opposition Congress | +63.1% |
| 106th | 1999–2001 | Clinton (D) | R | R | Opposition Congress | +10.7% |
| 107th | 2001–2003 | G.W. Bush (R) | D | R | Split Congress \* | -30.0% |
| 108th | 2003–2005 | G.W. Bush (R) | R | R | Unified | +47.4% |
| 109th | 2005–2007 | G.W. Bush (R) | R | R | Unified | +22.4% |
| 110th | 2007–2009 | G.W. Bush (R) | D | D | Opposition Congress | -33.0% |
| 111th | 2009–2011 | Obama (D) | D | D | Unified | +51.0% |
| 112th | 2011–2013 | Obama (D) | D | R | Split Congress | +16.9% |
| 113th | 2013–2015 | Obama (D) | D | R | Split Congress | +51.0% |
| 114th | 2015–2017 | Obama (D) | R | R | Opposition Congress | +13.8% |
| 115th | 2017–2019 | Trump (R) | R | R | Unified | +16.2% |
| 116th | 2019–2021 | Trump (R) | R | D | Split Congress | +62.0% |
| 117th | 2021–2023 | Biden (D) | D | D | Unified | -0.8% |
| 118th | 2023–2025 | Biden (D) | D | R | Split Congress | +58.4% |
\* The 107th Senate changed hands twice; see the methodology note above.
Two entries carry most of the drama. The best term in the sample is the 74th Congress (1935–1937), a Roosevelt trifecta that returned +91.6% as the market climbed out of the Depression. The worst is the 72nd Congress (1931–1933), a Split Congress under Hoover, at −48.6%. Neither return had much to do with the seating chart, which is the honest frame for everything on this page: the configuration is one small input into a two-year window that also contains the business cycle, the Federal Reserve, and whatever crisis happens to arrive.
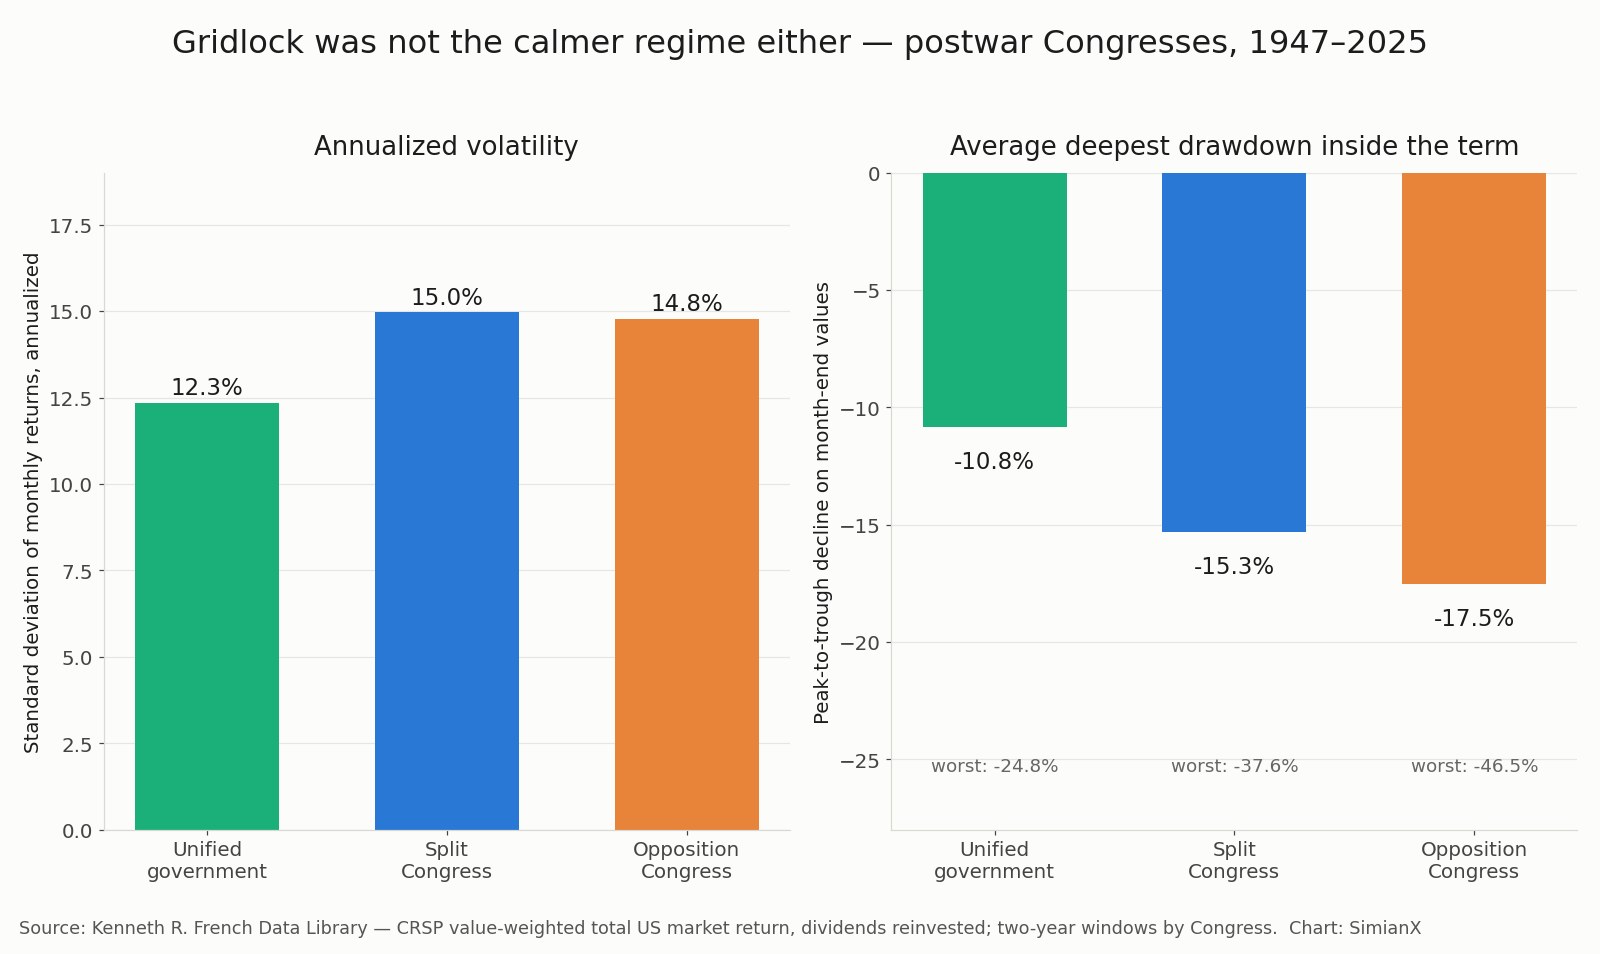
Was gridlock at least the calmer regime?
If divided government does not deliver higher returns, perhaps it delivers a smoother ride. That is arguably the real claim buried inside the cliché: not that gridlock pays more, but that it removes tail risk from policy.
It does not hold either. Across postwar Congresses, unified government produced 12.3% annualized volatility against 15.0% under a Split Congress and 14.8% under an Opposition Congress. The average deepest drawdown inside a term was −10.8% under unified control, −15.3% under a Split Congress and −17.5% under an Opposition Congress. The worst single drawdown in each bucket tells the same story: −24.8% for unified terms, −37.6% for split ones, −46.5% for opposition ones.
Across the full 1927–2025 sample the volatility gap narrows to 15.8% against 16.3%, because the unified bucket has to absorb the Depression, but the direction never reverses. On every risk measure we ran, the periods when one party controlled Washington were the quieter ones.
There is no mystery in this once you stop treating the political variable as the cause. Unified government tends to follow decisive elections, and decisive elections tend to happen in periods that are not already in crisis. Meanwhile some of the sharpest drawdowns in modern history — 1973–74, 2000–02, 2008 — happened to fall inside terms in which Washington was divided. The configuration did not create those markets. It was standing next to them.
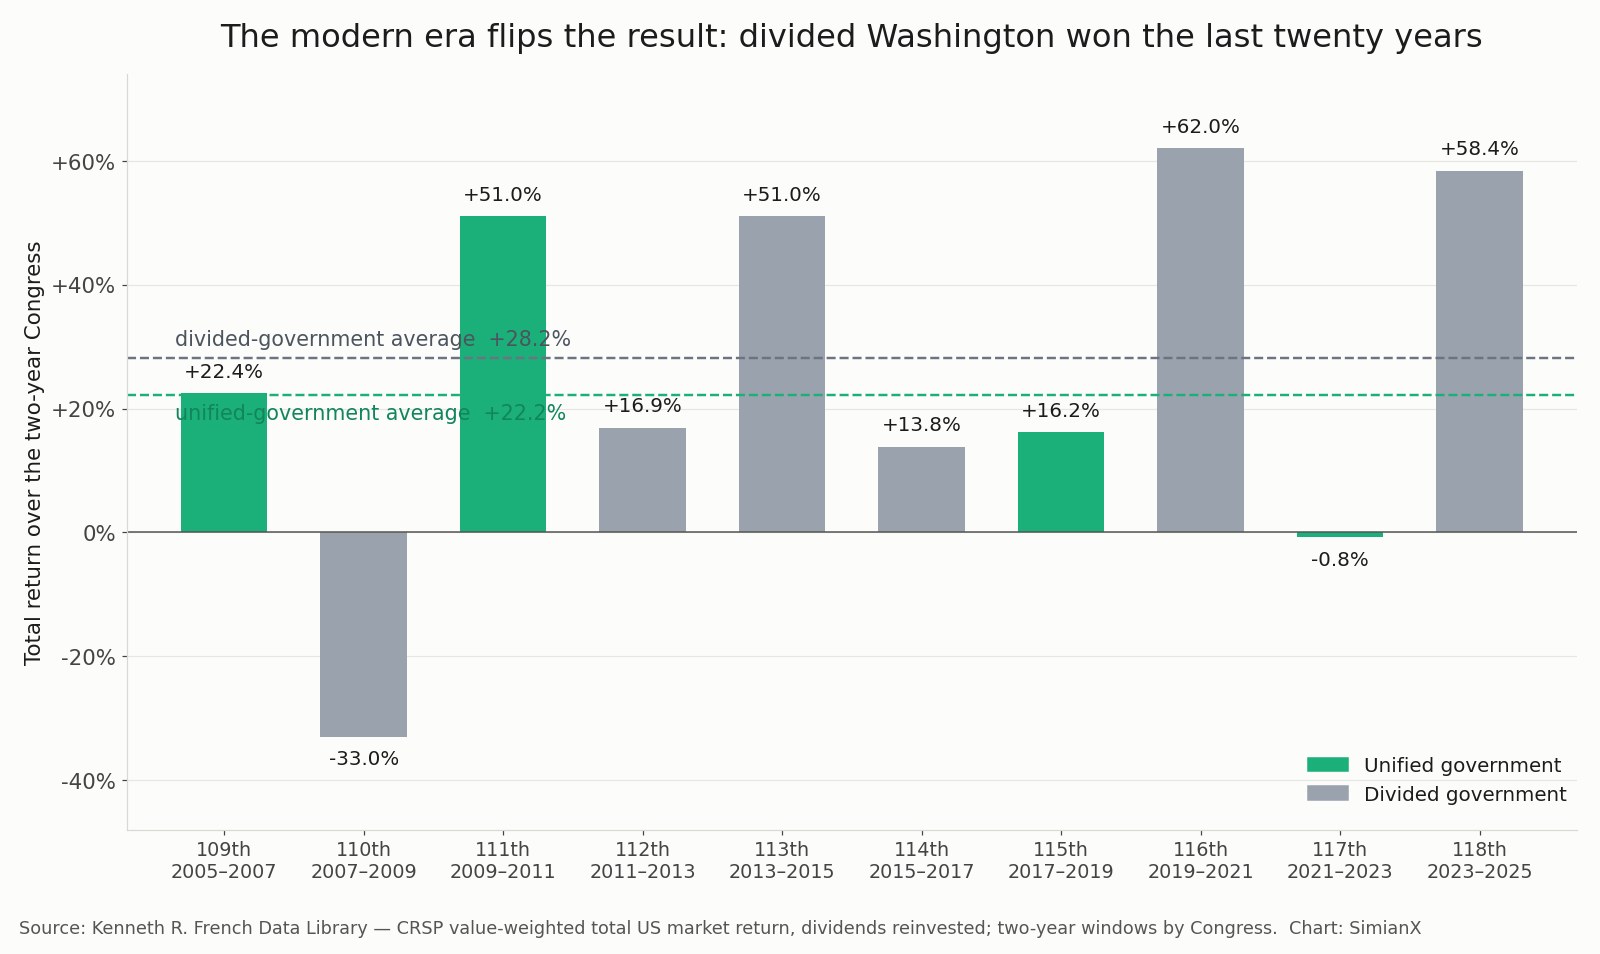
The modern era runs the other way
Here is the finding that should stop anyone from turning this into a trade.
Take the last ten complete Congresses — the 109th through the 118th, covering January 2005 to January 2025. Over that span, divided government beat unified government: +28.2% per term against +22.2%. The century-long edge does not merely shrink in the modern data. It inverts.
A cross-check with an instrument you could actually have owned says the same thing. Using SPY price returns over the identical ten windows, divided terms averaged +22.2% and unified terms +17.7%. Different instrument, different return definition, same reversal.
The four unified terms in that window were the 109th (+22.4%), the 111th (+51.0%), the 115th (+16.2%) and the 117th (−0.8%). The six divided terms include the two strongest results of the whole modern era — the 116th Congress at +62.0% and the 118th at +58.4% — alongside the worst, the 110th at −33.0%.
An effect that reverses sign over the most recent twenty years of a 98-year sample is not a signal you can act on. It is a historical pattern with a wide confidence interval, and the modern half of the record is the half that most resembles the market you are actually trading.
What is actually at stake on November 3, 2026
The 119th Congress is a Republican trifecta: the White House, a narrow Senate majority and a single-digit House majority. On November 3 voters elect the 120th Congress, seated January 3, 2027, and the live question is whether that trifecta survives.
History has run this exact experiment 15 times. Since 1930, a sitting trifecta has been on the ballot at 15 midterms. Voters kept it 7 times and broke it 8.
| Midterm outcome | Times | Avg 2-yr return | Median | Positive |
|---|---|---|---|---|
| Trifecta kept | 7 | +47.3% | +46.9% | 6 of 7 |
| Trifecta broken | 8 | +20.3% | +26.4% | 6 of 8 |
At face value that looks like a decisive edge for the status quo. It is not, for three reasons worth taking seriously.
The averages are dominated by crises that had nothing to do with the ballot. The trifecta-broken bucket contains the 72nd Congress (−48.6%, the depths of the Depression) and the 110th (−33.0%, the global financial crisis). Strip those two and the remaining six average +40.7%. The median for the broken group is +26.4%, not +20.3%, and the hit rate — 6 of 8 — is effectively identical to the 6 of 7 for trifectas that survived.
The recent record runs the other way. The two most recent times voters broke a trifecta, in 2018 and 2022, the following two years returned +62.0% and +58.4% — the second- and third-best results in the entire broken group. The 2010 midterm, the third-most-recent break, returned +16.9%.
And seven versus eight observations is not evidence. It is an anecdote with a decimal point.
For what it is worth, the current term is tracking well ahead of both groups: the 119th Congress has returned about +28.9% through its first 19 months, from January 2025 to July 2026 — a pace that, if it held, would land near the top of the unified-government distribution. Whether that continues has far more to do with the Federal Reserve's path than with the seating chart, which is the subject of our note on the September rate decision and the midterms.
What did hold up regardless of who won
Strip out the configuration entirely and two patterns in this dataset are considerably more robust than anything above.
The first year of a Congress beat the second. Across all 49 terms, year one averaged +14.9% and year two +9.4%, with 39 of 49 first years positive against 35 of 49 second years. That is the presidential cycle showing through the congressional calendar, and it lines up with the seasonality we documented in midterm election years and the stock market since 1950 and in the presidential-cycle returns by year.
Being invested beat being clever about Washington. 40 of 49 terms were positive. An investor who sat out every divided Congress since 1927 would have missed 20 positive two-year stretches to avoid 5 negative ones. The dominant term in the two-year return equation is not who holds the gavel; it is whether you were in the market at all.
If there is a tradable idea anywhere in this data, it is not at the index level. It is at the sector level, where the dispersion is far wider and the patterns are considerably more persistent — which is why we measured all twelve industries across 25 midterms in the sector scoreboard, and why the 2026 midterm winners-and-losers map works by scenario rather than by average.
The limits of this analysis
Stated plainly, because a reference page that hides its weaknesses is not a reference page.
- Small samples. 49 terms, split 24/25. The postwar sub-buckets run to 8, 15 and 16 observations. No result here would survive a demanding significance test, and none is presented as one.
- Overlapping regimes. Two-year windows across a single country are not independent draws. Long bull markets place several Congresses in the same economic regime.
- Confounding. The Federal Reserve, the business cycle, oil, war and technology cycles all move a two-year window far more than the composition of a chamber does. We have made no attempt to control for them, and any such attempt on 49 observations would be over-fitting.
- Classification edge cases. The 107th and 117th Senates are judgment calls, disclosed above. Caucusing independents are counted with the party they caucus with.
- Index scope. The CRSP total-market series is broader than the S&P 500 and includes small caps, so it will not match headline index figures exactly.
Watching the 2026 midterms with SimianX
None of the above is a position. What it is good for is knowing which questions are worth asking on election night, and having something better than a cliché when the configuration is finally settled.
That is the part SimianX is built for. In the live command room you can run a real-time analysis on SPY or any US ticker and watch competing AI models argue the setup out against live price action — the same models, on the same chart, disagreeing in public. If you would rather have a position monitored continuously through the volatility around an election, the autopilots run an entry, a stop and a target without you having to sit at the screen through a results night. Both run on the same points system, so you can test the workflow before committing to anything.
The useful frame for November is not "which party is good for stocks." It is: the market has risen through 82% of all two-year Congresses in a century, the configuration explains very little of the variance, and the last twenty years of data point the opposite way from the last hundred. Position for the business cycle. Let the seating chart be an input, not a thesis.
Frequently asked questions
Is gridlock good for stocks?
Not on the historical record. Across 49 Congresses since 1927 the US market returned +30.6% per two-year term under unified government against +22.5% under divided government, and unified terms were also less volatile with shallower drawdowns. The one genuine exception is a Split Congress — House and Senate held by different parties — which averaged +32.2% in the postwar era, the best of any configuration.
What is the difference between a split Congress and an opposition Congress?
A Split Congress means the House and Senate are controlled by different parties, so the legislature is deadlocked internally. An Opposition Congress means the president's party controls neither chamber. Postwar, the first averaged +32.2% per term and the second +22.1% — a ten-point gap between two things routinely called by the same name.
Does the stock market do better under Democrats or Republicans?
In this sample, terms under a Democratic president averaged +32.2% and terms under a Republican president +20.0%. The gap is real in the data and close to meaningless as a forecast: 26 versus 23 overlapping observations, with the Depression, two oil shocks and the 2008 crisis landing where they landed. Party of the president is not an investable variable.
What happens to stocks after a midterm election?
The twelve months after a midterm have been unusually strong historically, and the midterm year itself has been the weakest of the four-year cycle. We documented that pattern in full in our midterm-year reference table, and the sector version — which parts of the market captured the rebound — in the sector scoreboard.
If Republicans keep the trifecta in 2026, is that bullish?
On the century-long average, trifectas that survived a midterm were followed by +47.3% over two years against +20.3% for trifectas that were broken. But that is 7 observations against 8, the broken-group average is dragged down by 1931 and 2007, and the two most recent breaks returned +62.0% and +58.4%. Treat it as context, not as a signal.
What data is this built on?
Monthly CRSP value-weighted total US market returns with dividends reinvested, from the Kenneth R. French Data Library, over 24-month windows aligned to each Congress. Party control is from official Senate and House records. The SPY cross-check uses split-adjusted price returns and is labeled as such.
Sources and further reading
- Kenneth R. French Data Library — Dartmouth; monthly market returns from July 1926.
- US Senate, Party Division — official Senate majority records by Congress.
- US House of Representatives, Party Divisions — official House majority records by Congress.
- Party divisions of United States Congresses — consolidated seat counts and trifecta flags.
- Twentieth Amendment — the January 3 seating date, effective 1935.
- Divided government — definitions and historical frequency.