
Bagaimana pasar sebenarnya bergerak di tahun pemilu
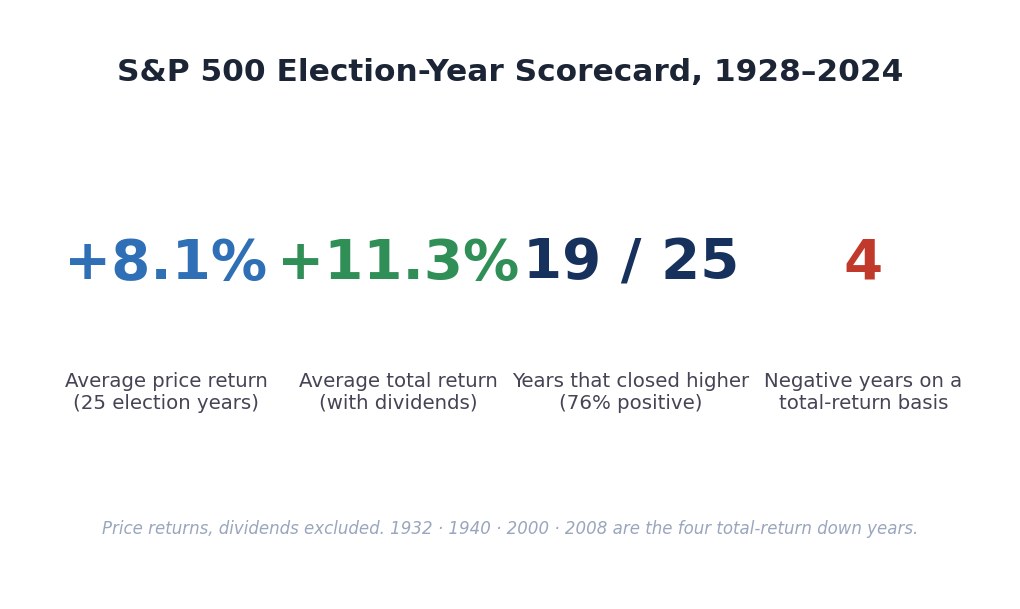
Setiap empat tahun, para investor AS diberi tahu bahwa sebuah pemilihan presiden akan menentukan nasib portofolio mereka. Data menceritakan sesuatu yang lebih menarik — dan lebih berguna. Sejak 1928, S&P 500 rata-rata mencatat imbal hasil total sekitar +11,3% selama tahun pemilihan presiden dan ditutup naik pada 21 dari 25 di antaranya. Tahun-tahun yang merugi tidak ada kaitannya dengan siapa yang menang; itu adalah krisis makroekonomi sepenuhnya. Dan pasar berperilaku sangat berbeda ketika seorang presiden petahana mempertahankan jabatannya dibandingkan ketika perebutannya terbuka.
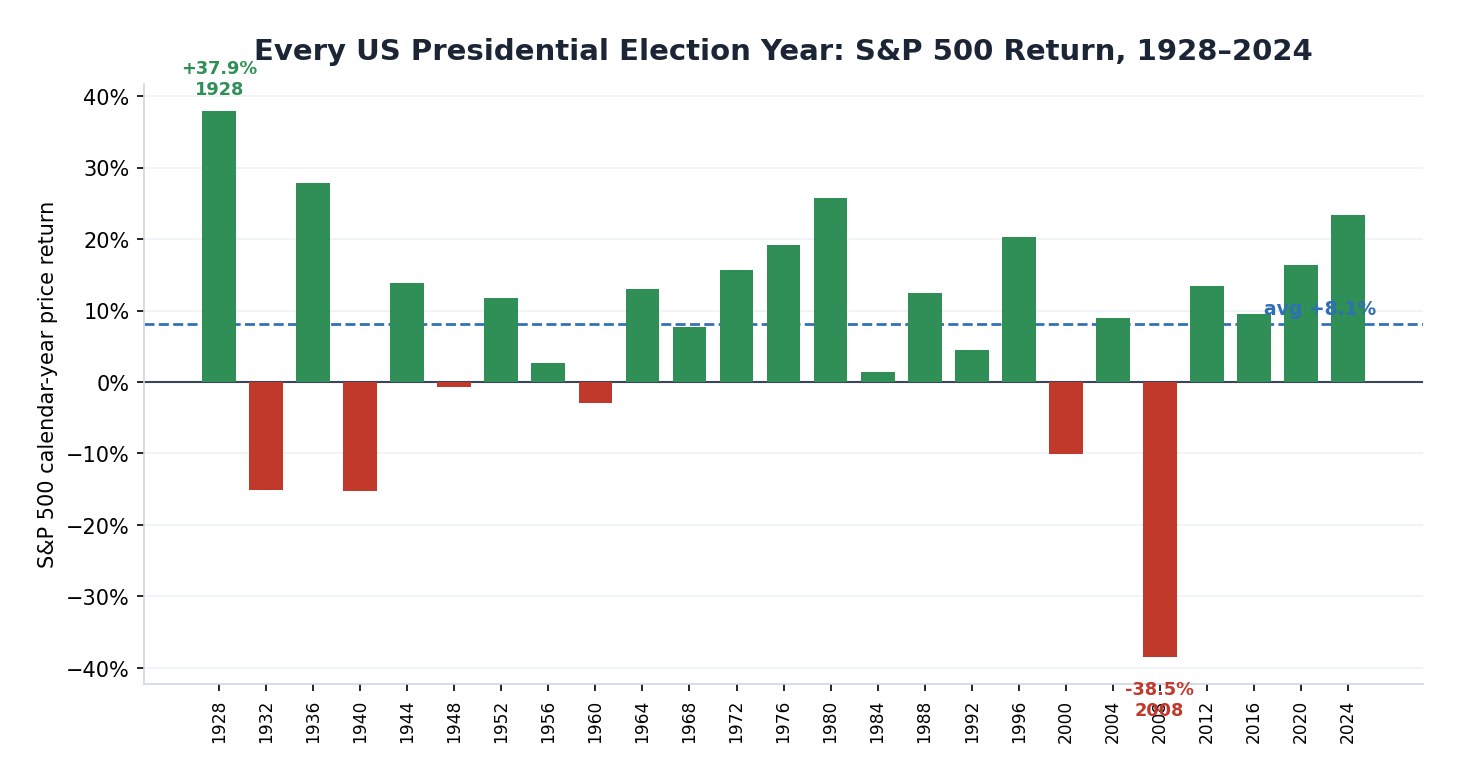
Inilah referensi lengkapnya: setiap tahun pemilihan presiden AS dari 1928 hingga 2024, imbal hasil tahun kalender S&P 500, ada atau tidaknya petahana di surat suara, satu-satunya empat tahun yang turun dan mengapa mereka jatuh, sinyal "pasar memprediksi pemenang", dan apa yang diisyaratkan siklus empat tahun untuk jalan menuju 2028.
Mengapa Tahun Pemilihan Biasanya Hijau
Dalam siklus kepresidenan empat tahun, tahun pemilihan adalah "Tahun 4". Sepanjang 25 pemilihan sejak 1928, imbal hasil harga rata-rata S&P 500 (tanpa dividen) sekitar +8,1%, dan imbal hasil total rata-rata (dengan dividen diinvestasikan kembali) sekitar +11,3% — mendekati, dan dalam sejumlah studi sedikit di atas, rata-rata jangka panjang seluruh tahun.
Tingkat keberhasilannya adalah inti beritanya. Sembilan belas dari 25 tahun pemilihan ditutup naik hanya berdasarkan harga; berdasarkan imbal hasil total, 21 dari 25 positif — sekitar 84%. Itu basis yang kuat untuk satu tahun kalender. Hanya empat tahun pemilihan yang merugi setelah dividen dihitung dan, seperti ditunjukkan bagian berikut, masing-masing adalah keadaan darurat ekonomi yang nyata, bukan cerita pemilihan.
Mengapa ada kecenderungan naik ini? Penjelasan yang paling sering dikutip adalah siklus insentif politik. Pemerintahan cenderung menanggung rasa sakit ekonomi di awal masa jabatan dan mengarah ke kondisi yang ramah pertumbuhan — belanja, kebijakan fiskal, Federal Reserve yang kooperatif bila memungkinkan — menjelang tahun pemilihan kembali. Apakah Anda percaya pada sebab-akibatnya atau tidak, pola ini selaras dengan sisa siklus: seperti ditunjukkan referensi pelengkap kami tentang tahun pemilihan paruh waktu dan pasar saham, tahun paruh waktu (Tahun 2) adalah yang terlemah dari keempatnya, sekitar +4,6% sejak 1950, dan tahun prapemilihan (Tahun 3) adalah yang terkuat, sekitar +17,2%. Tahun pemilihan berada dengan nyaman di atas tahun paruh waktu dan tepat di bawah puncak prapemilihan.
Setiap Tahun Pemilihan Presiden Sejak 1928: Tabel Referensi
| Tahun | Pemenang (partai) | Petahana di surat suara? | Imbal hasil S&P 500 | Konteks |
|---|---|---|---|---|
| 1928 | Hoover (R) | Perebutan terbuka | +37,9% | Puncak Roaring Twenties |
| 1932 | Roosevelt (D) | Ya — kalah | −15,1% | Depresi Besar |
| 1936 | Roosevelt (D) | Ya — menang | +27,9% | Pemulihan New Deal |
| 1940 | Roosevelt (D) | Ya — menang | −15,3% | Perang pecah di Eropa |
| 1944 | Roosevelt (D) | Ya — menang | +13,8% | Ekspansi masa perang |
| 1948 | Truman (D) | Ya — menang | −0,7% | Penyesuaian pascaperang |
| 1952 | Eisenhower (R) | Perebutan terbuka | +11,8% | Korea / pemerintahan baru |
| 1956 | Eisenhower (R) | Ya — menang | +2,6% | Krisis Suez |
| 1960 | Kennedy (D) | Perebutan terbuka | −3,0% | Resesi menuju pemungutan suara |
| 1964 | Johnson (D) | Ya — menang | +13,0% | Booming pertengahan 1960-an |
| 1968 | Nixon (R) | Perebutan terbuka | +7,7% | Gejolak Vietnam |
| 1972 | Nixon (R) | Ya — menang | +15,6% | Puncak sebelum guncangan minyak |
| 1976 | Carter (D) | Ya — kalah | +19,1% | Pemulihan dari bear market 1973–74 |
| 1980 | Reagan (R) | Ya — kalah | +25,8% | Volatilitas era Volcker |
| 1984 | Reagan (R) | Ya — menang | +1,4% | "Pagi di Amerika" |
| 1988 | G.H.W. Bush (R) | Perebutan terbuka | +12,4% | Rebound pascakrash 1987 |
| 1992 | Clinton (D) | Ya — kalah | +4,5% | Pertumbuhan lambat pascaresesi |
| 1996 | Clinton (D) | Ya — menang | +20,3% | Bull market dot-com dimulai |
| 2000 | G.W. Bush (R) | Perebutan terbuka | −10,1% | Gelembung dot-com pecah |
| 2004 | G.W. Bush (R) | Ya — menang | +9,0% | Ekspansi pertengahan siklus |
| 2008 | Obama (D) | Perebutan terbuka | −38,5% | Krisis keuangan global |
| 2012 | Obama (D) | Ya — menang | +13,4% | Pemulihan pascakrisis |
| 2016 | Trump (R) | Perebutan terbuka | +9,5% | Transaksi reflasi |
| 2020 | Biden (D) | Ya — kalah | +16,3% | Krash COVID dan pemulihan bentuk-V |
| 2024 | Trump (R) | Perebutan terbuka | +23,3% | Bull market yang digerakkan AI |
Imbal hasil harga S&P 500, tanpa dividen, dibulatkan. "Petahana di surat suara" berarti seorang presiden yang sedang menjabat mencalonkan diri untuk pemilihan kembali; 1976 (Ford) dan 2024 (Biden mundur; Harris maju) dijelaskan di bawah.
Dua ciri menonjol. Pertama, kenaikan mendominasi: sepuluh dari tahun-tahun ini naik lebih dari 13% dan hasil mediannya jelas positif. Kedua, penurunannya jarang tetapi brutal — dan terkonsentrasi. Setiap tahun negatif bertepatan dengan resesi, perang, atau krash. Dalam hampir satu abad, tidak ada satu pun tahun pemilihan di mana saham jatuh semata-mata karena politik.
Satu-satunya Tahun Pemilihan yang Turun Adalah Krisis
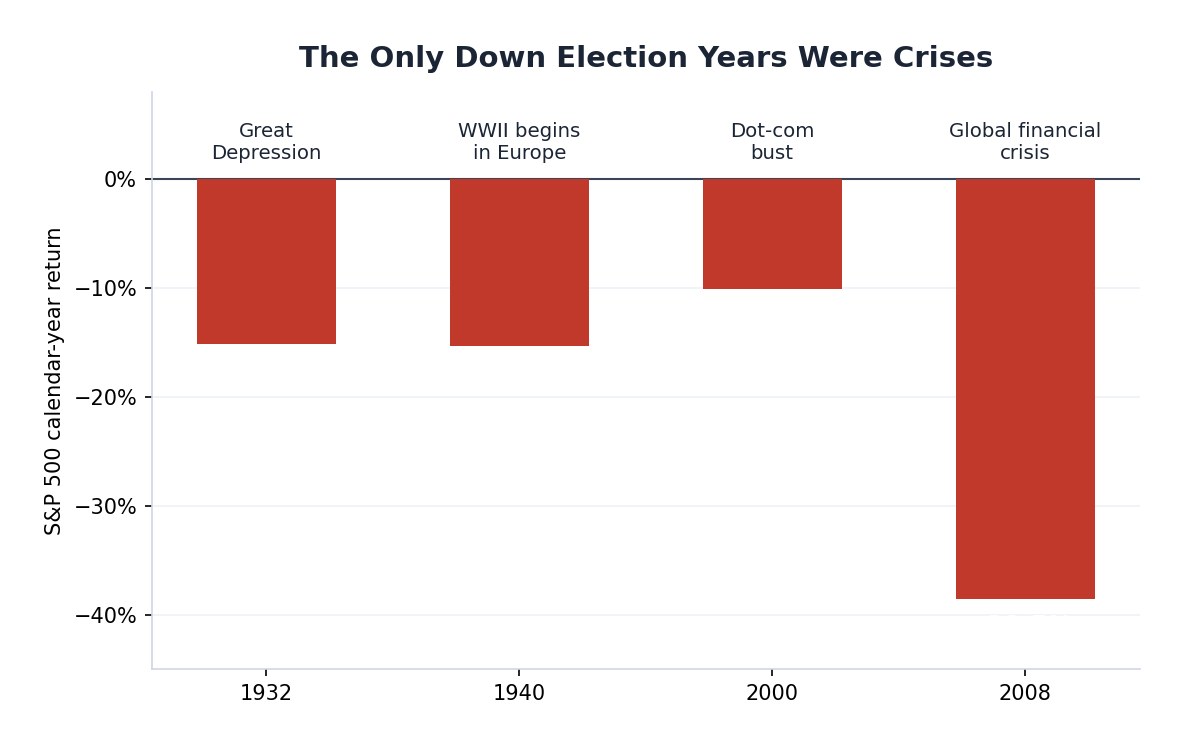
Berdasarkan imbal hasil total, hanya empat tahun pemilihan sejak 1928 yang merugi, dan penyebabnya sama setiap kali — guncangan makro, bukan kotak suara:
- 1932 (−15,1%): titik terdalam Depresi Besar, dengan pengangguran mendekati 25%.
- 1940 (−15,3%): invasi Jerman ke Eropa Barat dan runtuhnya ketenangan "perang pura-pura".
- 2000 (−10,1%): pecahnya gelembung dot-com, yang berlangsung hampir tiga tahun.
- 2008 (−38,5%): krisis keuangan global, tahun kalender terburuk bagi saham AS sejak 1931.
(Berdasarkan harga, dua tahun lagi turun tipis di bawah nol — 1948 di −0,7% dan 1960 di −3,0% — tetapi keduanya menjadi positif setelah dividen ditambahkan, itulah sebabnya penghitungan standar "empat tahun pemilihan yang turun" menggunakan imbal hasil total.)
Pelajaran praktisnya adalah yang berulang di setiap referensi sejarah pasar: kerugian tahun pemilihan adalah peristiwa makro, titik. Jika Anda ingin anatomi lengkap penurunan 2000 dan 2008, referensi kami tentang setiap bear market S&P 500 sejak 1929 menelusuri kedalaman dan waktu pemulihan masing-masing. Konsekuensinya penting untuk 2028 dan seterusnya: pertanyaan yang menentukan apakah tahun pemilihan naik atau turun bukanlah "siapa yang memimpin dalam jajak pendapat?" — melainkan "apakah ekonomi sedang menuju resesi?".
Petahana di Surat Suara vs. Perebutan Terbuka
Inilah pembedaan yang paling sering dilewatkan komentar pemilihan. Secara historis, pasar berkinerja jauh lebih baik ketika seorang presiden petahana mempertahankan jabatan dibandingkan ketika perebutannya terbuka, tanpa petahana di surat suara.
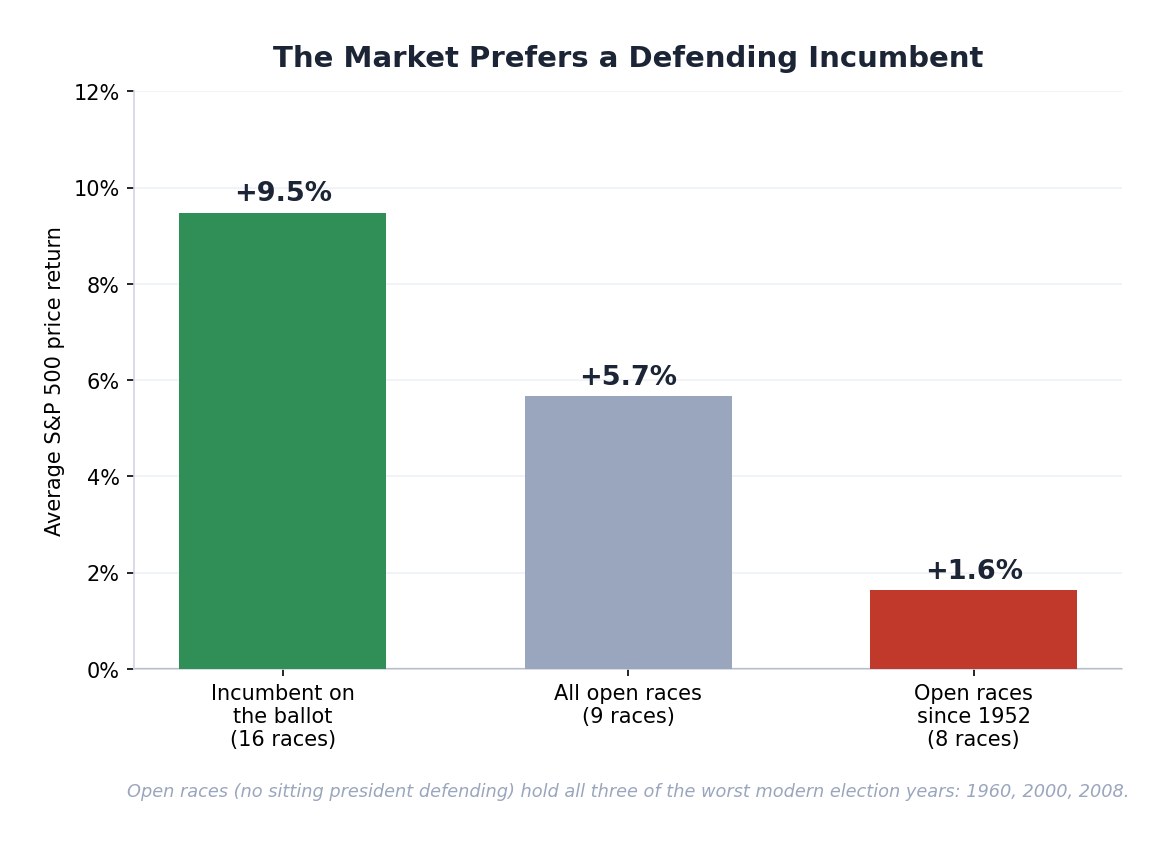
- Petahana di surat suara (16 perebutan): rata-rata +9,5%. Ketika seorang presiden mencalonkan diri untuk pemilihan kembali, insentif siklus untuk "mendorong pertumbuhan menuju pemungutan suara" berada pada kekuatan penuh.
- Perebutan terbuka (9 perebutan): rata-rata +5,7% — dan hanya +1,6% jika Anda mengecualikan pencilan 1928 dan melihat delapan perebutan terbuka sejak 1952.
Petunjuknya ada di ekor. Tiga tahun pemilihan terburuk era modern — 1960 (−3,0%), 2000 (−10,1%), dan 2008 (−38,5%) — semuanya merupakan perebutan terbuka tanpa presiden petahana yang mempertahankan Gedung Putih. Perebutan terbuka menumpuk dua ketidakpastian: pemenang yang tak diketahui dan pergantian pemerintahan yang pasti, dengan segala penilaian ulang kebijakan yang menyertainya.
Pola ini adalah kecenderungan, bukan hukum. 2024 adalah pengecualian yang menonjol: Joe Biden mundur, Wakil Presiden Harris menggantikannya, dan perebutannya secara efektif terbuka — namun S&P 500 mencatat +23,3%, didorong oleh ledakan belanja modal AI yang membawa Nvidia dan megacap lainnya ke rekor. Ketika ekonomi yang mendasari dan tren sekuler yang kuat cukup tangguh, keduanya mengalahkan templat pemilihan. Itulah benang merah seluruh referensi ini: latar belakang makro adalah variabel dominan, dan struktur pemilihan adalah pengubahnya.
Bisakah Pasar Memprediksi Pemenang?
Salah satu statistik folklor pemilihan paling awet di Wall Street membalik sebab-akibatnya: pasarlah yang memprediksi politik. Sinyalnya adalah arah S&P 500 dalam tiga bulan sebelum pemungutan suara (kira-kira Agustus hingga Oktober).
Rekam jejak historisnya mencolok. Sejak 1928, ketika S&P 500 naik dalam tiga bulan menjelang pemilihan, partai yang berkuasa biasanya mempertahankan Gedung Putih; ketika turun, penantang biasanya menang. Menurut sebagian besar penghitungan, indikator ini selaras dengan hasil pada sekitar 87% pemilihan (sekitar 20 dari 24), dengan kemelesetan yang menonjol pada 1956, 1968, 1980, dan 2016. Oktober adalah petunjuk paling tajam — Oktober yang turun secara tak proporsional dikaitkan dengan kekalahan partai yang berkuasa.
Logikanya intuitif: pasar yang naik mencerminkan pemilih yang merasa aman secara ekonomi dan cenderung mempertahankan status quo, sedangkan pasar yang turun memberi sinyal tekanan yang menguntungkan perubahan. Perlakukan ini sebagai folklor dengan rekam jejak nyata, bukan keunggulan trading — sampelnya kecil, dan segelintir kemelesetan dalam deret 24 observasi persis seperti yang diharapkan dari derau. Tetapi ini pengingat jelas bahwa pasar dan pemilihan membaca ekonomi mendasar yang sama.
Apakah Penting Partai Mana yang Menang?
Lebih kecil daripada yang diisyaratkan tajuk berita. Data imbal hasil selama beberapa dekade menunjukkan bahwa S&P 500 tumbuh secara majemuk di bawah presiden Demokrat maupun Republik, dan bahwa imbal hasil rata-rata di bawah pemerintahan terbelah serupa dengan — dan dalam beberapa studi sedikit lebih baik daripada — kendali tunggal. Preferensi pasar yang terungkap adalah terselesaikannya ketidakpastian dan, sering kali, kebuntuan legislatif yang menjauhkan ayunan kebijakan besar dari meja.
Yang benar-benar digerakkan oleh hasil pemilihan adalah komposisi sektor, bukan indeksnya. Partai mana yang menguasai Kongres dan Gedung Putih membentuk ulang ekspektasi atas pajak, energi, pertahanan, layanan kesehatan, dan antimonopoli — pertanyaan pemilihan saham, bukan indeks. Pembedaan itu lebih penting di era ini daripada siklus-siklus sebelumnya karena konsentrasi indeks sangat ekstrem: seperti ditunjukkan ulasan kami tentang bobot "Magnificent 7" di S&P 500, sekitar tujuh saham kini menggerakkan sekitar sepertiga indeks, sehingga segelintir nama yang terpapar AI dapat menelan rotasi apa pun yang dipicu hasil pemilihan.
Di Mana Siklus Berada Sekarang: Jalan Menuju 2028
Tahun pemilihan 2024 telah selesai di +23,3%. Inilah ke mana jam empat tahun menunjuk berikutnya:
- 2025 — Tahun pascapemilihan (Tahun 1). Secara historis tahun terlemah kedua dalam siklus, karena masa jabatan baru memajukan kebijakan yang kurang ramah pasar.
- 2026 — Tahun paruh waktu (Tahun 2). Tahun terlemah rata-rata (+4,6% sejak 1950) dengan penurunan tipikal terdalam. Tabel referensi paruh waktu kami menandai jendela September–Oktober sebagai zona dasar historis siklus — dan S&P 500 lebih tinggi 12 bulan setelah seluruh 19 pemilihan paruh waktu sejak 1950.
- 2027 — Tahun prapemilihan (Tahun 3). Tahun terkuat dalam siklus dengan selisih lebar (rata-rata +17,2%), saat insentif untuk menopang pertumbuhan menuju 2028 mulai bekerja.
- 2028 — Pemilihan presiden berikutnya. Berdasarkan tabel ini, skenario dasarnya adalah tahun yang positif — kecuali resesi tiba, satu-satunya kondisi yang secara andal mengubah tahun pemilihan menjadi merah.
Dua angin silang akan membentuk seberapa mulus templat itu berjalan. Pertama adalah apakah siklus belanja modal AI yang menggerakkan 2024 terus meluas melampaui cip ke daya, jaringan, dan memori, atau mandek. Kedua adalah peta musiman di dalam setiap tahun — referensi musiman S&P 500 kami berpadu alami dengan siklus pemilihan untuk menentukan waktu irama tipikal kelemahan musim gugur dan kekuatan akhir tahun. Untuk pertanyaan resesi yang pada akhirnya menentukan tanda setiap tahun pemilihan, tabel inversi kurva imbal hasil tetap menjadi salah satu sinyal terdepan jangka panjang terbersih yang tercatat.
Cara Memperdagangkan Siklus Pemilihan dengan AI
Basis kalender adalah titik awal, bukan strategi. Cara menggunakan referensi ini adalah memadukan kapan dari siklus — angin pendukung tahun pemilihan, kelemahan musim gugur paruh waktu, kekuatan prapemilihan — dengan konfirmasi waktu-nyata dari keluasan pasar, posisi, dan data makro. Perpaduan pola dan penilaian waktu-nyata itulah yang dirancang untuk dikerjakan AI multiagen.
Di SimianX, papan peringkat model AI mengadu 30 model AI dari 6 penyedia pada P&L trading nyata, sehingga Anda dapat melihat model mana yang benar-benar menavigasi pasar saat ini alih-alih sekadar backtest — kami merangkum model AI mana yang merupakan trader terbaik dari data langsung itu. Jika Anda lebih suka menjalankan prosesnya tanpa harus memelototi layar, autopilot AI dapat menjalankan strategi aturan plus AI di sekitar peristiwa seperti pemilihan secara berkelanjutan; mekanismenya dibahas dalam panduan kami untuk menjalankan bot trading AI 24/7, dan paket dimulai gratis. Trader kripto dapat mengamati ayunan selera risiko yang sama pada Bitcoin, yang secara historis memperbesar reli kelegaan yang ditunjukkan saham begitu ketidakpastian pemilihan terselesaikan.
Pertanyaan yang Sering Diajukan
Apakah tahun pemilihan presiden baik untuk pasar saham?
Rata-rata, ya. Sejak 1928, S&P 500 rata-rata sekitar +11,3% imbal hasil total di tahun pemilihan dan ditutup naik pada 21 dari 25 — sekitar 84% waktu. Kecenderungan naik ini mencerminkan siklus insentif politik untuk mengarah ke pertumbuhan menjelang pemungutan suara pemilihan kembali.
Apa tahun pemilihan presiden terburuk bagi saham?
2008, di −38,5% imbal hasil harga S&P 500, selama krisis keuangan global. Berikutnya adalah 1940 (−15,3%, Perang Dunia II) dan 1932 (−15,1%, Depresi Besar). Semua tahun pemilihan yang turun bertepatan dengan resesi, perang, atau krash — tidak pernah karena pemilihannya sendiri.
Apakah penting partai mana yang memenangkan kepresidenan?
Secara historis, jauh lebih kecil daripada yang diharapkan investor. S&P 500 naik di bawah kedua partai, dan imbal hasil rata-rata di bawah pemerintahan terbelah menyamai atau mengungguli kendali tunggal. Hasil pemilihan terutama menata ulang pemenang dan pecundang sektor; ia tidak menentukan arah indeks secara andal.
Bisakah pasar memprediksi pemilihan?
Ada rekam jejak nyata. Ketika S&P 500 naik dalam tiga bulan sebelum pemungutan suara, partai yang berkuasa biasanya menang; ketika turun, penantang biasanya menang — selaras pada sekitar 87% pemilihan sejak 1928 dengan kemelesetan pada 1956, 1968, 1980, dan 2016. Perlakukan sebagai folklor dengan rekam jejak baik, bukan jaminan.
Apa yang dikatakan siklus pemilihan tentang 2028?
2028 adalah tahun pemilihan presiden berikutnya, dan basisnya condong ke tahun yang positif. Faktor ayunan yang lebih besar adalah pendahuluannya: 2026 (paruh waktu) secara historis adalah tahun terlemah dan 2027 (prapemilihan) yang terkuat, sehingga siklus menunjuk pada gejolak hingga akhir 2026 diikuti kekuatan menuju pemungutan suara 2028 — kecuali resesi menyela.
Sumber dan Bacaan Lanjutan
- Teori Siklus Pemilihan Presiden — Investopedia
- Pemilihan presiden Amerika Serikat — Wikipedia
- Data historis S&P 500 — S&P Dow Jones Indices
- Referensi pelengkap di SimianX: tahun pemilihan paruh waktu dan pasar, musiman bulanan S&P 500, setiap bear market S&P 500 sejak 1929, dan tabel inversi kurva imbal hasil.
Kinerja masa lalu tidak menjamin hasil di masa depan. Referensi ini untuk informasi dan edukasi, bukan nasihat investasi.