
 By Marcus Reeve
Oil Prices After Midterm Elections: WTI and Brent, 1986-2022
Data through the latest values published by the Federal Reserve Bank of St. Louis (FRED) on November 4, 2026: daily crude oil prices through October 27, 2026 and weekly US gasoline prices through November 2, 2026. Every figure below is recomputed from those files.
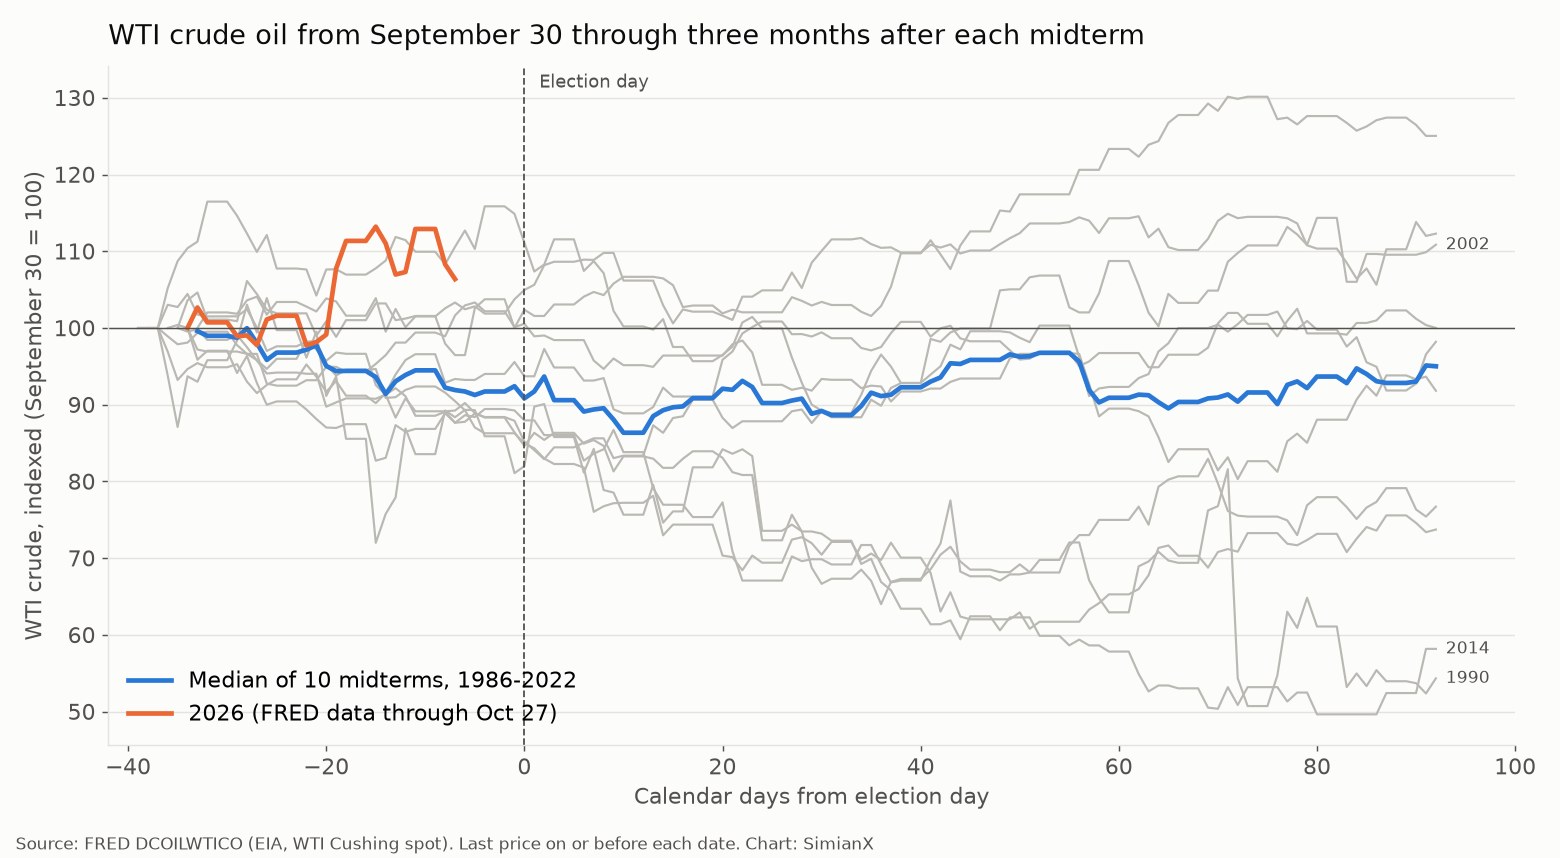
Quick answer: In the 10 US midterm elections since daily WTI data begin in 1986, crude oil was lower one month after election day in 6 of 10 cases (median −10.3%), lower three months later in 7 of 10 (median −6.8%) and lower twelve months later in 5 of 10 (median +3.4%). Oil also tended to fall before the vote: WTI dropped from September 30 to election day in 6 of 10 midterms (median −9.2%). Pump prices fell before the vote in only 5 of 9 midterms since 1990, less often than in years with no federal election (14 of 18). Going into the 2026 vote, the latest prices for WTI ($103.37), Brent ($123.10) and regular gasoline ($4.153 a gallon) were all higher than in the election week of any year in the data.
Result (as of 1:50 a.m. ET, November 4, 2026): Democrats won control of both the Senate and the House, calls made by AP and NBC News. By AP's count at 1:30 a.m. ET, Democrats had flipped seven Republican-held Senate seats and 16 House seats. Congress will be split from the White House from January 3, 2027.
Every election season revives two questions about energy. Before the vote: are gas prices falling because it is an election year? After the vote: does the result move the oil price? Our energy stocks and the 2026 midterms analysis covers what elections mean for oil companies such as ExxonMobil (XOM) and Chevron (CVX), and the S&P 500 during oil shocks covers what big oil moves do to the stock market. This page answers the question underneath both: what did the oil price itself, and the price at the pump, do around every US midterm election?
The short answer is that oil usually fell after midterms, but the reasons were almost always outside Washington: a war unwinding in 1990, the Asian financial crisis in 1998, OPEC's price war in 2014, a global growth scare in 2018. Ten elections are a small sample, and the history below is a reference, not a forecast.
How the numbers were built
- Crude oil: daily spot prices from FRED, which republishes US Energy Information Administration (EIA) data. WTI is series DCOILWTICO (West Texas Intermediate at Cushing, Oklahoma), which begins on January 2, 1986. Brent is series DCOILBRENTEU (Europe Brent), which begins on May 20, 1987.
- Gasoline: series GASREGW, the EIA's weekly US average retail price of regular gasoline, published each Monday and starting on August 20, 1990.
- Midterms covered: WTI covers 10 midterms (1986-2022). Brent and gasoline cover 9 (1990-2022), because their data start after the 1986 vote. That is a small sample: read every count as a description of what happened, not a probability.
- Election day: the first Tuesday after the first Monday in November.
- Base price: the last price on or before election day. For crude this is almost always the election-day price itself; for gasoline it is the Monday reading the day before the vote. FRED's daily oil files include blank days (holidays and other days with no published price); these are skipped and the last available price is used.
- Windows: "next day" is the next available price after the base (for gasoline, the next weekly reading). The one-, three- and twelve-month changes run to the last price on or before the same calendar date one, three and twelve months after election day. The pre-vote run-up runs from the last price on or before September 30 to the base price.
- Comparison years: the same calendar windows in presidential election years and in odd-numbered years, when there is no federal election in November.
- Prices are nominal US dollars, not adjusted for inflation.
WTI crude oil after every midterm, 1986-2022: the reference table
| Midterm (election day) | WTI, Sep 30 | WTI, election day | Sep 30 to election day | Next day | +1 month | +3 months | +12 months |
|---|---|---|---|---|---|---|---|
| Nov 4, 1986 | $14.70 | $15.05 | +2.4% | −0.8% | +1.0% | +22.1% | +26.8% |
| Nov 6, 1990 | $39.53 | $32.41 | −18.0% | +9.5% | −18.7% | −33.7% | −27.7% |
| Nov 8, 1994 | $18.36 | $18.46 | +0.5% | −1.6% | −7.2% | −0.5% | −3.5% |
| Nov 3, 1998 | $16.19 | $14.24 | −12.0% | −2.2% | −20.6% | −12.8% | +57.9% |
| Nov 5, 2002 | $30.59 | $26.06 | −14.8% | −1.3% | +4.6% | +30.1% | +12.2% |
| Nov 7, 2006 | $62.90 | $58.94 | −6.3% | +3.8% | +6.1% | −2.0% | +63.7% |
| Nov 2, 2010 | $79.95 | $83.91 | +5.0% | +0.6% | +4.9% | +7.0% | +10.2% |
| Nov 4, 2014 | $91.17 | $77.15 | −15.4% | +2.0% | −13.5% | −31.3% | −40.0% |
| Nov 6, 2018 | $73.16 | $62.16 | −15.0% | −0.8% | −17.1% | −13.2% | −9.7% |
| Nov 8, 2022 | $79.91 | $88.80 | +11.1% | −3.4% | −19.7% | −11.6% | −14.6% |
| Median, 1986-2022 | −9.2% | −0.8% | −10.3% | −6.8% | +3.4% | ||
| WTI lower in | 6 of 10 | 6 of 10 | 6 of 10 | 7 of 10 | 5 of 10 | ||
| Nov 3, 2026 | $97.18 | $103.37 (Oct 27, latest) | +6.4% (to Oct 27) | Nov 4, 2026: to be added after the close | pending | pending | pending |
When September 30 fell on a weekend, the Sep 30 column uses the last price before it (September 28 in 1990 and 2018, September 29 in 2006). The 2026 row stops at October 27, the last day FRED had published when this page was written.
Best and worst. The best one-month result was 2006 (+6.1%) and the worst 1998 (−20.6%). Over three months the range runs from +30.1% (2002) to −33.7% (1990), and over twelve months from +63.7% (2006, as crude climbed toward $100 in late 2007) to −40.0% (2014). The biggest next-day move was +9.5% on November 7, 1990, during the Gulf crisis; every other next-day move was smaller than 4%.
Five of ten midterms were followed by lower oil at every horizon. In 1990, 1994, 2014, 2018 and 2022, WTI was lower one, three and twelve months after election day, including each of the last three midterms. Only 2010 was higher at all three horizons.
Brent crude after every midterm, 1990-2022
Brent, the international benchmark, tells the same story with slightly larger declines.
| Midterm (election day) | Brent, Sep 30 | Brent, election day | Sep 30 to election day | Next day | +1 month | +3 months | +12 months |
|---|---|---|---|---|---|---|---|
| Nov 6, 1990 | $41.00 | $33.20 | −19.0% | +4.1% | −17.6% | −37.0% | −33.7% |
| Nov 8, 1994 | $16.73 | $17.38 | +3.9% | +1.0% | −7.2% | −2.0% | −3.5% |
| Nov 3, 1998 | $14.71 | $11.93 | −18.9% | −0.4% | −15.8% | −9.6% | +78.7% |
| Nov 5, 2002 | $29.11 | $25.21 (Nov 4) | −13.4% | −3.4% | +3.4% | +26.0% | +10.7% |
| Nov 7, 2006 | $59.09 | $56.99 | −3.6% | +0.3% | +10.8% | +2.9% | +66.4% |
| Nov 2, 2010 | $80.77 | $84.71 | +4.9% | +0.7% | +5.5% | +19.6% | +30.8% |
| Nov 4, 2014 | $94.67 | $82.12 | −13.3% | +0.9% | −16.6% | −32.9% | −42.8% |
| Nov 6, 2018 | $82.72 | $70.64 | −14.6% | −0.8% | −18.1% | −11.9% | −12.1% |
| Nov 8, 2022 | $88.90 | $96.85 | +8.9% | −3.9% | −21.5% | −13.1% | −15.9% |
| Median, 1990-2022 | −13.3% | +0.3% | −15.8% | −9.6% | −3.5% | ||
| Brent lower in | 6 of 9 | 4 of 9 | 6 of 9 | 6 of 9 | 5 of 9 | ||
| Nov 3, 2026 | $115.91 | $123.10 (Oct 27, latest) | +6.2% (to Oct 27) | Nov 4, 2026: to be added after the close | pending | pending | pending |
FRED has no Brent price for election day 2002, so that row uses November 4. The largest twelve-month gain, +78.7% after 1998, came as Brent recovered from $9.10 a barrel on December 10, 1998 to $21.32 a year later, after producers agreed to output cuts in March 1999.
One thing Brent shows that WTI does not is the gap between the two benchmarks. On every midterm election day from 1990 to 2010, the two prices were within $2.31 of each other (2002 compares Brent on November 4). The gap was $8.05 on election day 2022 and was $19.73 on October 27, 2026.
Gas prices before and after the vote, 1990-2022
For voters, the number that matters is the price at the pump. This table uses the EIA's weekly average for regular gasoline.
| Midterm (election day) | Gas, late Sep | Gas, election week | Late Sep to election week | Next week | +1 month | +3 months | +12 months |
|---|---|---|---|---|---|---|---|
| Nov 6, 1990 | $1.272 | $1.334 (Nov 5) | +4.9% | −0.4% | +0.5% | −14.6% | −18.2% |
| Nov 8, 1994 | $1.129 | $1.123 (Nov 7) | −0.5% | −0.1% | −1.8% | −4.2% | −5.2% |
| Nov 3, 1998 | $1.014 | $1.010 (Nov 2) | −0.4% | −0.2% | −3.6% | −8.0% | +21.8% |
| Nov 5, 2002 | $1.413 | $1.448 (Nov 4) | +2.5% | −0.6% | −5.8% | +5.5% | +6.0% |
| Nov 7, 2006 | $2.378 | $2.200 (Nov 6) | −7.5% | +1.5% | +4.4% | −0.4% | +37.0% |
| Nov 2, 2010 | $2.694 | $2.806 (Nov 1) | +4.2% | +2.1% | +1.8% | +10.5% | +23.0% |
| Nov 4, 2014 | $3.354 | $2.993 (Nov 3) | −10.8% | −1.7% | −7.2% | −30.9% | −25.7% |
| Nov 6, 2018 | $2.844 | $2.753 (Nov 5) | −3.2% | −2.4% | −11.0% | −18.1% | −5.4% |
| Nov 8, 2022 | $3.711 | $3.796 (Nov 7) | +2.3% | −0.9% | −10.7% | −9.3% | −10.5% |
| Median, 1990-2022 | −0.4% | −0.4% | −3.6% | −8.0% | −5.2% | ||
| Gas lower in | 5 of 9 | 7 of 9 | 6 of 9 | 7 of 9 | 5 of 9 | ||
| Nov 3, 2026 | $4.465 (Sep 28) | $4.153 (Nov 2) | −7.0% | pending | pending | pending | pending |
"Late Sep" is the last weekly reading on or before September 30. The highest pump price going into any midterm before 2026 was $3.796 in 2022; the record weekly price in the series is $5.006, on June 13, 2022.
After the vote, gasoline fell more reliably than crude: lower three months later in 7 of 9 midterms, with a median of −8.0%. The exceptions were 2002, when crude rose ahead of the Iraq war, and 2010. The biggest drop, −30.9% after 2014, followed OPEC's November 27, 2014 decision not to cut output.
Do gas prices fall before midterm elections?
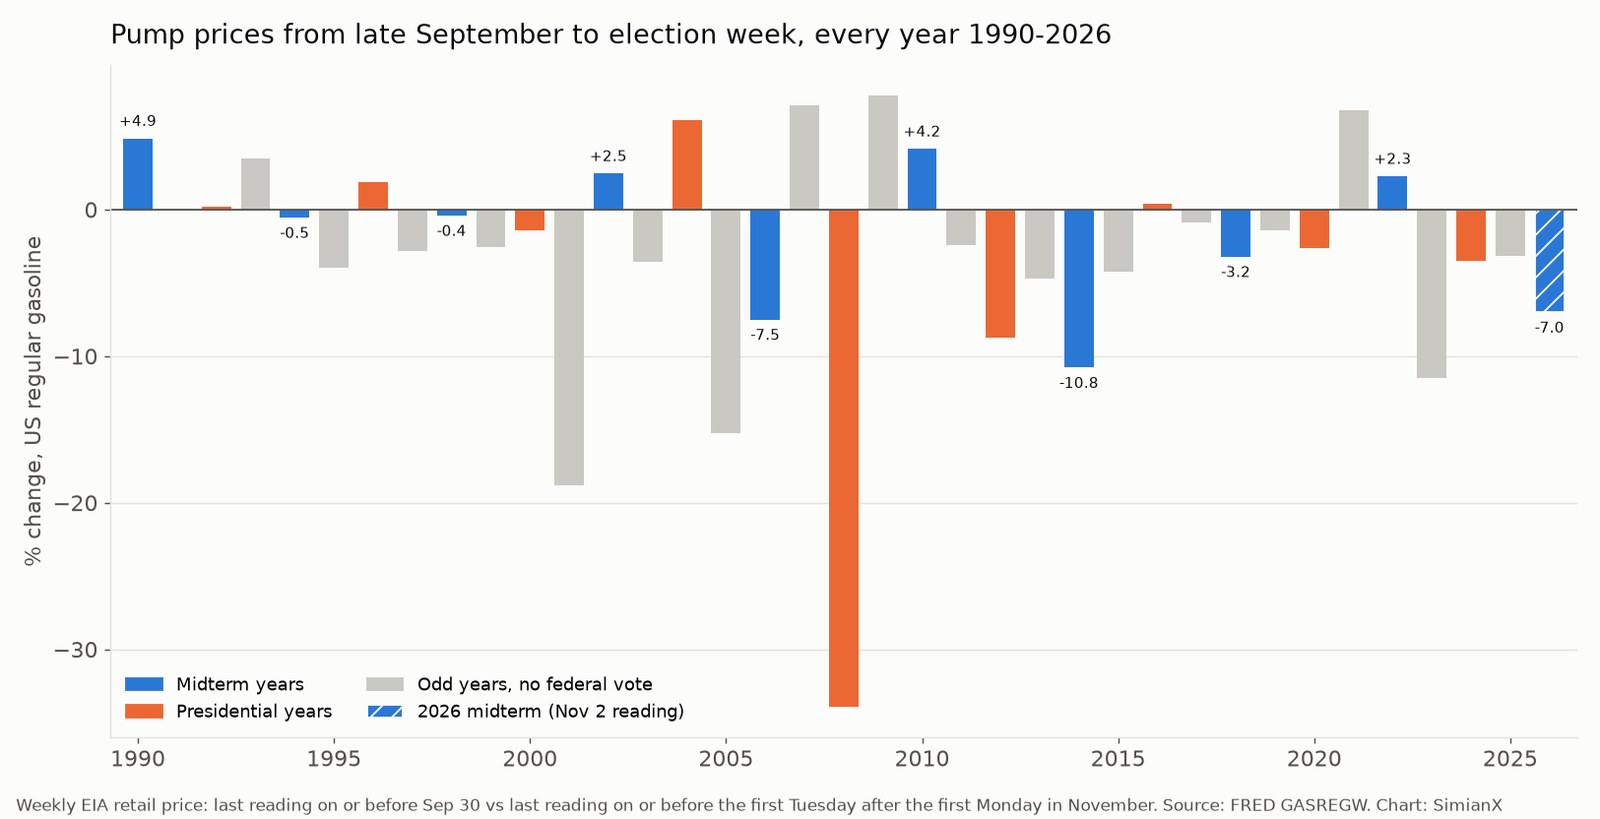
A common claim is that gas prices drop before elections, by luck or by design. The data say gasoline does usually get cheaper between late September and early November, but in every kind of year, not just election years.
| Year type | Years | Gas fell, late Sep to election week | Median change | Gas lower 3 months after election week | Median, +3 months |
|---|---|---|---|---|---|
| Midterm years, 1990-2022 | 9 | 5 of 9 | −0.4% | 7 of 9 | −8.0% |
| Presidential years, 1992-2024 | 9 | 5 of 9 | −1.4% | 4 of 9 | +0.4% |
| Odd years (no federal vote), 1991-2025 | 18 | 14 of 18 | −2.7% | 12 of 18 | −1.3% |
| All years, 1990-2025 | 36 | 24 of 36 | −1.9% | 23 of 36 | −2.8% |
The autumn decline is mostly seasonal. US retail stations must sell the more expensive summer-blend gasoline until September 15, and driving demand fades after the summer, so pump prices often drift lower into November. Midterm years show that decline less often than odd years, when nobody is on the federal ballot. Gasoline rose into the vote in four midterms (1990, 2002, 2010 and 2022). With nine elections, there is no sign of a reliable pre-midterm drop beyond the season.
The crude oil picture is different. WTI fell from September 30 to election day in 6 of 10 midterms, with a median of −9.2%, and five of those declines were larger than 10% (1990, 1998, 2002, 2014 and 2018). In odd years the median was −0.2%. Each of those five falls has a clear cause in the oil market itself, listed in the midterm-by-midterm section below.
Midterms vs presidential years vs years with no vote
The same calendar windows in other years show how much of the post-midterm decline is about midterms and how much is about November.
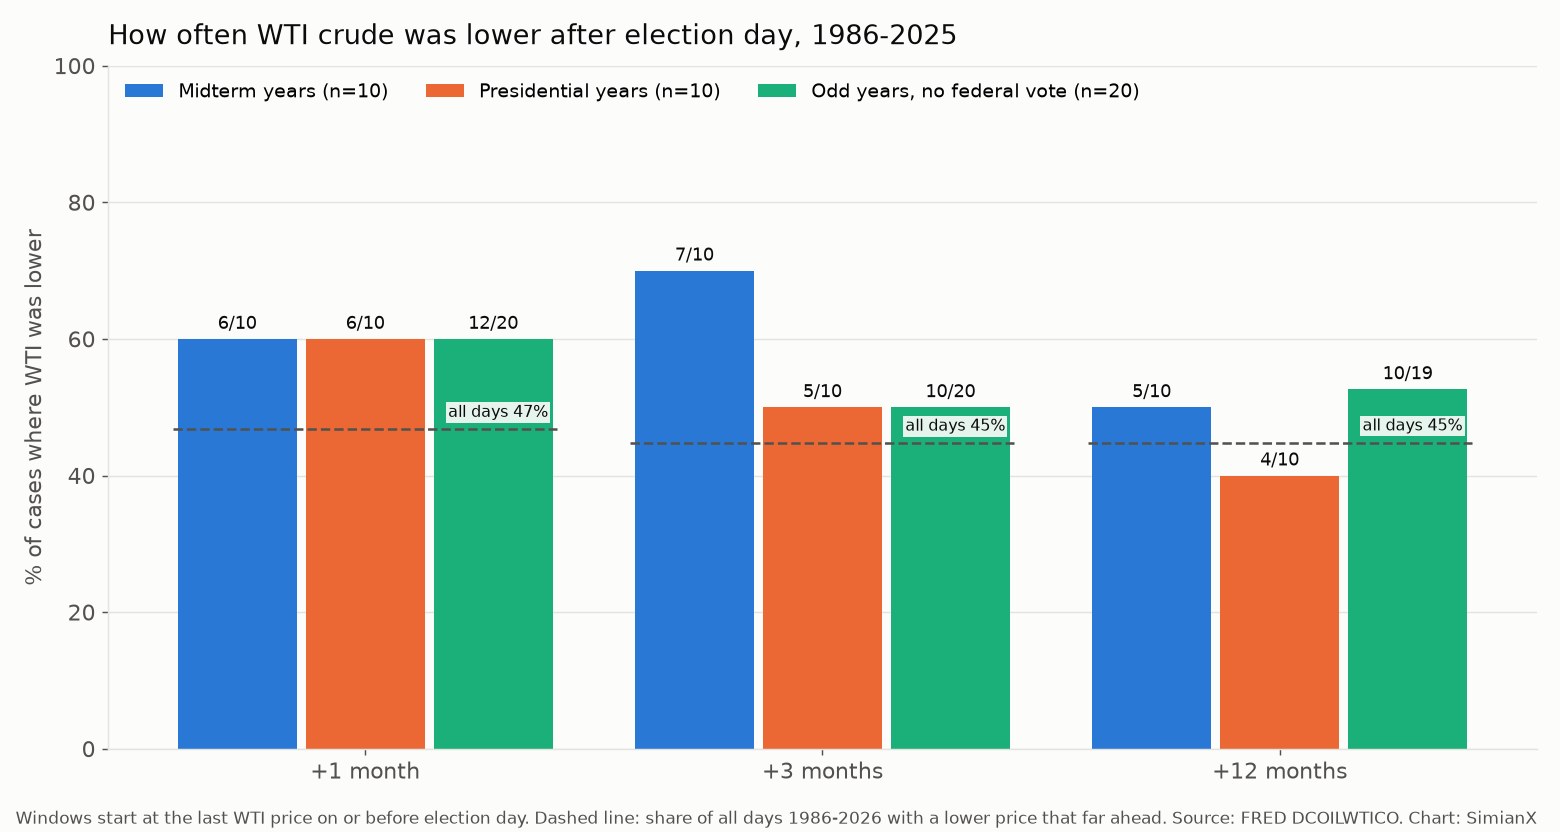
| Window (from election day) | WTI lower: midterms (10) | Presidential years (10) | Odd years (20) | All days since 1986 |
|---|---|---|---|---|
| Sep 30 to election day | 6 of 10 (median −9.2%) | 6 of 10 (−4.7%) | 10 of 20 (−0.2%) | — |
| +1 month | 6 of 10 (−10.3%) | 6 of 10 (−4.3%) | 12 of 20 (−3.3%) | 46.8% |
| +3 months | 7 of 10 (−6.8%) | 5 of 10 (+2.2%) | 10 of 20 (−0.1%) | 44.8% |
| +12 months | 5 of 10 (+3.4%) | 4 of 10 (+10.5%) | 10 of 19 (−1.3%) | 44.9% |
The last column is the share of all trading days since 1986 on which WTI was lower one, three or twelve months later. The 2025 odd year has no twelve-month result yet, hence 19.
Three points stand out.
Early-November-to-December weakness is not special to midterms. Across all 40 years from 1986 to 2025, WTI was lower one month after the election-day date in 24 of 40 years (median −4.0%), more often than the 46.8% base rate for all days. Midterms fit that pattern; their median decline is larger (−10.3%) but driven by a handful of big moves.
The three-month record leans lower in midterms. WTI was lower three months after 7 of 10 midterms, compared with 5 of 10 presidential years and 10 of 20 odd years. Brent was lower after 6 of 9 midterms (median −9.6%). The difference rests on 1990, 1998, 2014, 2018 and 2022, each a well-documented oil-market event.
Twelve months out, there is no midterm pattern. WTI was higher a year later in 5 of 10 midterms, with a median of +3.4%. The spread of outcomes, from −40.0% to +63.7%, is too wide for an average to mean much.
Midterm by midterm
- 1986. Oil had collapsed earlier in the year after Saudi Arabia raised output, and WTI was just $15.05 on election day. After OPEC agreed in December 1986 to return to production quotas, WTI rose 22.1% in three months.
- 1990. Iraq's invasion of Kuwait in August pushed WTI above $41 in October. It had already fallen 18.0% from September 30 by election day, jumped 9.5% the next day, then fell to $20.05 on January 18, 1991, after the air war began.
- 1994. The quietest midterm: WTI stayed between $16.60 and $18.82 for three months.
- 1998. The Asian financial crisis cut demand; WTI fell 20.6% in a month to $11.31 and touched $10.82 on December 10, 1998. Production cuts in 1999 then lifted it 57.9% over twelve months.
- 2002. The only large three-month rise (+30.1%): a national strike in Venezuela from December 2002 and the approach of the Iraq war took WTI to $34.98 on January 24, 2003.
- 2006. WTI had slid from its summer high and was $58.94 on election day. Twelve months later it was $96.46, part of the run toward $100 in late 2007.
- 2010. The one midterm with higher oil at every horizon, during the post-crisis recovery; Brent passed $100 by February 2011 (+19.6% in three months) while WTI rose 7.0%.
- 2014. OPEC's late-November decision not to cut output turned a falling market into a collapse: −31.3% in three months and −40.0% in twelve.
- 2018. WTI had already fallen 15.0% from September 30 by the vote. It fell to $44.48 on December 27, 2018 during the year-end market sell-off.
- 2022. The only midterm with a double-digit run-up into the vote (+11.1%), followed by a 19.7% drop in a month as recession fears grew. WTI was back above $90 only in the second half of September 2023 (high $93.67 on September 27), and ended the twelve months 14.6% lower.
2026: the highest pre-election oil and gas prices in the data
The 2026 vote arrived after an oil shock year. These are the latest FRED values before election day, in nominal dollars:
| Measure | WTI | Brent | US regular gasoline |
|---|---|---|---|
| Latest price before the vote | $103.37 (Oct 27) | $123.10 (Oct 27) | $4.153 (Nov 2) |
| End of 2025 | $57.26 | $61.35 | $2.811 (Dec 29) |
| Change in 2026 so far | +80.5% | +100.7% | +47.7% |
| 2026 high | $114.58 (Apr 7) | $138.21 (Apr 7) | $4.500 (May 11) |
| September 30 (gas: Sep 28) | $97.18 | $115.91 | $4.465 |
| Change since September 30 | +6.4% | +6.2% | −7.0% |
| Highest prior midterm level | $88.80 (2022) | $96.85 (2022) | $3.796 (2022) |
| Highest election-week level, any year 1986-2025 | $96.80 (2011) | $115.61 (2011) | $3.796 (2022) |
Three things make 2026 unusual. First, all three prices were higher than in the election week of any year in the data, not just midterm years. Second, crude was rising into the vote (+6.4% for WTI since September 30), which has happened in only four of ten previous midterms. Third, gasoline went the other way: the 7.0% decline since late September is the third-largest pre-midterm drop since 1990, behind 2014 (−10.8%) and 2006 (−7.5%), even as crude rose. The all-time highs in this data remain $145.31 for WTI (July 3, 2008) and $5.006 for gasoline (June 13, 2022), so 2026 is a high year but not a record in nominal terms.
For how the stock market has handled oil spikes like this one, see the S&P 500 during oil shocks, 1973-2026. None of the history above is a forecast of where oil goes after November 3, 2026.
What this table does not tell you
- Ten is a small sample. One different outcome would move the three-month WTI count from 7 of 10 to 6 or 8 of 10. Nothing here is statistically robust.
- Oil prices are set globally. OPEC decisions, wars, recessions and the dollar drove every large move in the tables. A midterm changes the US Congress, which has limited direct control over the global oil price; most energy-supply decisions in the US, such as leasing and sanctions enforcement, sit with the executive branch.
- Spot prices are not investments. Oil futures, oil exchange-traded funds and energy stocks behave differently from the spot prices shown here. For energy equities around elections, see our energy stocks analysis and the energy rows in sector returns after midterms.
- Prices are nominal. A $30 barrel in 1990 and a $30 barrel in 2026 are very different in real terms; percentage changes avoid most of that problem, dollar levels do not.
How to use this table
- To judge a post-election oil move, compare it with the one-month column: anything beyond the −20.6% of 1998 would be a midterm record for WTI.
- To test the "gas prices before the vote" claim in any year, compare the late-September-to-election-week change with the all-years median of −1.9%.
- For what stocks did in the same windows, see the S&P 500 midterm reference and sector returns after midterms. For interest rates and the currency, see Treasury yields and the dollar after midterms.
To follow an oil major in real time after the vote, you can run a live AI analysis of XOM, ExxonMobil's stock, or open the XOM stock page.
FAQ
Do oil prices go down after midterm elections?
More often than not, but not reliably. Since 1986 WTI was lower one month after a midterm in 6 of 10 cases (median −10.3%) and three months after in 7 of 10 (median −6.8%). Twelve months later it was higher in 5 of 10. The large declines came with oil-market events such as the 2014 OPEC decision.
Do gas prices drop before an election?
Gasoline usually gets cheaper between late September and early November in any year, because of the end of the summer-blend season. It fell before 5 of 9 midterms since 1990 and in 14 of 18 odd years with no federal vote, so there is no extra pre-election drop in the data.
What happened to oil after the 2022 midterms?
WTI was $88.80 on November 8, 2022, fell 19.7% to $71.30 within a month, and was 14.6% lower a year later at $75.85.
What was the biggest oil price drop after a midterm?
Over three months, the −33.7% after 1990, when the Gulf crisis premium vanished as the air war began in January 1991. Over twelve months, −40.0% after 2014.
What were oil and gas prices before the 2026 midterms?
The latest FRED values before the vote were $103.37 for WTI and $123.10 for Brent (October 27, 2026) and $4.153 a gallon for regular gasoline (November 2, 2026), all higher than the election week of any year since 1986.
Does Congress control oil prices?
Not directly. Oil is priced globally, and the moves in these tables were driven by OPEC, wars, recessions and demand. Congress can change energy taxes, subsidies and some leasing rules, which matter over years rather than weeks.
Is WTI or Brent the better benchmark for this question?
Both tell the same story. WTI has the longer daily history (from 1986); Brent is the global benchmark and starts in 1987. Their gap was unusually wide in 2026, at $19.73 on October 27.
Related reading
- 2026 Midterms and Energy Stocks: XOM, CVX, FSLR Outlook
- How the S&P 500 Performs During Oil Shocks: 1973–2026
- Best Sectors After Midterm Elections: 100 Years of Data
- Treasury Yields and the Dollar After Midterms, 1962-2022
- Stock Market After Midterm Elections: Every Cycle 1950–2026
- Is Gridlock Good for Stocks? 49 Congresses, 1927-2025
- Do Small Caps Beat Large Caps After Midterms? 1926-2022
- Bank Stocks After Midterm Elections: 25 Midterms, 1926-2022
Sources
- FRED: Crude Oil Prices, West Texas Intermediate (DCOILWTICO)
- FRED: Crude Oil Prices, Brent - Europe (DCOILBRENTEU)
- FRED: US Regular All Formulations Gas Price (GASREGW)
- EIA: Gasoline explained, factors affecting gasoline prices
- Wikipedia: Election Day in the United States
This page is a historical reference, not investment advice. Patterns across ten midterm elections do not predict future oil or gasoline prices.