
 By Marcus Reeve
Bank Stocks After Midterm Elections: A 100-Year Reference Table
Quick answer: Bank stocks have been one of the weaker places to be after a midterm election. Across all 25 midterms from 1926 to 2022, value-weighted U.S. bank stocks beat the whole market over the following twelve months only 10 times, trailing it by an average of 4.3 percentage points (median gap: 6.8 points). The year after a midterm is the only stretch of the four-year presidential cycle in which banks have lost to the market more often than they have won. In the ETF era it has been worse: the financials fund XLF trailed the S&P 500 after all five midterms from 2006 to 2022, and the regional-bank fund KRE fell 34% in the year after the 2022 vote.
Result (as of 1:50 a.m. ET, November 4, 2026): Democrats won control of both the Senate and the House, calls made by AP and NBC News. By AP's count at 1:30 a.m. ET, Democrats had flipped seven Republican-held Senate seats and 16 House seats. Congress will be split from the White House from January 3, 2027.
Midterm coverage tends to treat banks as a pure policy trade: one party means lighter regulation and a rally, the other means tougher rules and a sell-off. The data does not support that story. What it shows instead is a sector that has spent most post-midterm years falling behind the market, whichever party won, and a Congress that rarely passed the bank law everyone was arguing about until the twelve-month window had already closed.
This article is the financials spoke of our midterm series. The cross-sector scoreboard ranks twelve industries after every midterm since 1926; this page goes one level deeper into banks, using the 49-industry data to separate banks from brokers, big banks from small ones, and the ETF era from the long sample.
How this was measured
All long-sample numbers come from the Kenneth R. French Data Library, which publishes daily and monthly total returns for 49 value-weighted U.S. industry portfolios back to July 1926. Two of them matter here:
- Banks: commercial banks, savings institutions and bank holding companies.
- Trading: what the French files label "Fin": brokers and dealers, exchanges, asset managers and investment vehicles. In this article it stands in for Wall Street rather than Main Street.
The market benchmark is the French market return (Mkt-RF plus the risk-free rate), the value-weighted total return of all U.S. listed stocks. Dividends are included on both sides.
Each window starts at the last close on or before election day. The daily file has no trading on election day before 1970, when the exchange still closed for elections, so for 1926 to 1966 the base is the Monday close. Each window ends at the last close on or before the same calendar date one, three, six or twelve months later. All 25 midterm election days from 1926 to 2022 are included, with no exclusions.
For the modern check I used Cboe daily closes for XLF (the financials sector fund), KBE (an equal-weighted bank fund), KRE (regional banks), JPM (the largest U.S. bank) and SPY (the S&P 500). These are price returns, without dividends. For the equal-weight versus value-weight comparison I used monthly rather than daily data, because daily rebalancing of thinly traded small banks inflates equal-weighted returns. On daily data, small banks appear to have beaten big banks after 23 of 25 midterms. On monthly data the figure is 16, and that is the number I report.
The scoreboard: banks after 25 midterms, 1926 to 2022
| Window after election day | Banks average | Market average | Banks beat market | Banks positive | Average gap | Median gap |
|---|---|---|---|---|---|---|
| +1 trading day | +0.2% | +0.4% | 12 of 25 | 15 of 25 | −0.2 pts | +0.0 pts |
| +1 month | +2.8% | +1.8% | 9 of 25 | 17 of 25 | +1.0 pts | −0.4 pts |
| +3 months | +6.8% | +7.6% | 11 of 25 | 17 of 25 | −0.8 pts | −0.9 pts |
| +6 months | +11.0% | +13.6% | 8 of 25 | 20 of 25 | −2.6 pts | −3.0 pts |
| +12 months | +13.3% | +17.7% | 10 of 25 | 17 of 25 | −4.3 pts | −6.8 pts |
Three points stand out.
The gap widens over time. On the day after the vote, banks and the market are a coin flip. By six months banks have beaten the market only 8 times out of 25, and by twelve months the average shortfall is 4.3 points. Whatever drives the pattern, it is not a one-day reaction to the result.
The one-month average is misleading. Banks average +2.8% in the first month against +1.8% for the market, yet they beat it only 9 times in 25. Two outliers lift the average: +15.5% after the 1942 midterm and +18.0% after 1990. The median month is a small loss against the market, not a gain.
Banks fall more often, not just by more. The market finished up twelve months later in 23 of 25 cases; banks did in 17. Banks fell in eight post-midterm years, including 1958, 1986, 2006, 2010 and 2022, when the market as a whole rose in four of those five.
Wall Street has fared better than Main Street. The trading portfolio of brokers, exchanges and asset managers beat the market after 12 of 25 midterms over twelve months, with an average gap of +1.1 points and a median close to zero:
| Window after election day | Trading average | Market average | Trading beat market | Average gap | Median gap |
|---|---|---|---|---|---|
| +1 month | +1.3% | +1.8% | 14 of 25 | −0.5 pts | +0.6 pts |
| +3 months | +8.0% | +7.6% | 12 of 25 | +0.4 pts | −0.1 pts |
| +6 months | +14.8% | +13.6% | 13 of 25 | +1.2 pts | +0.7 pts |
| +12 months | +18.8% | +17.7% | 12 of 25 | +1.1 pts | −0.3 pts |
That makes the trading group roughly a market-weight bet after midterms, while banks have been a consistent underweight. When people say "financials" they usually mean both. The data says they should be judged separately.
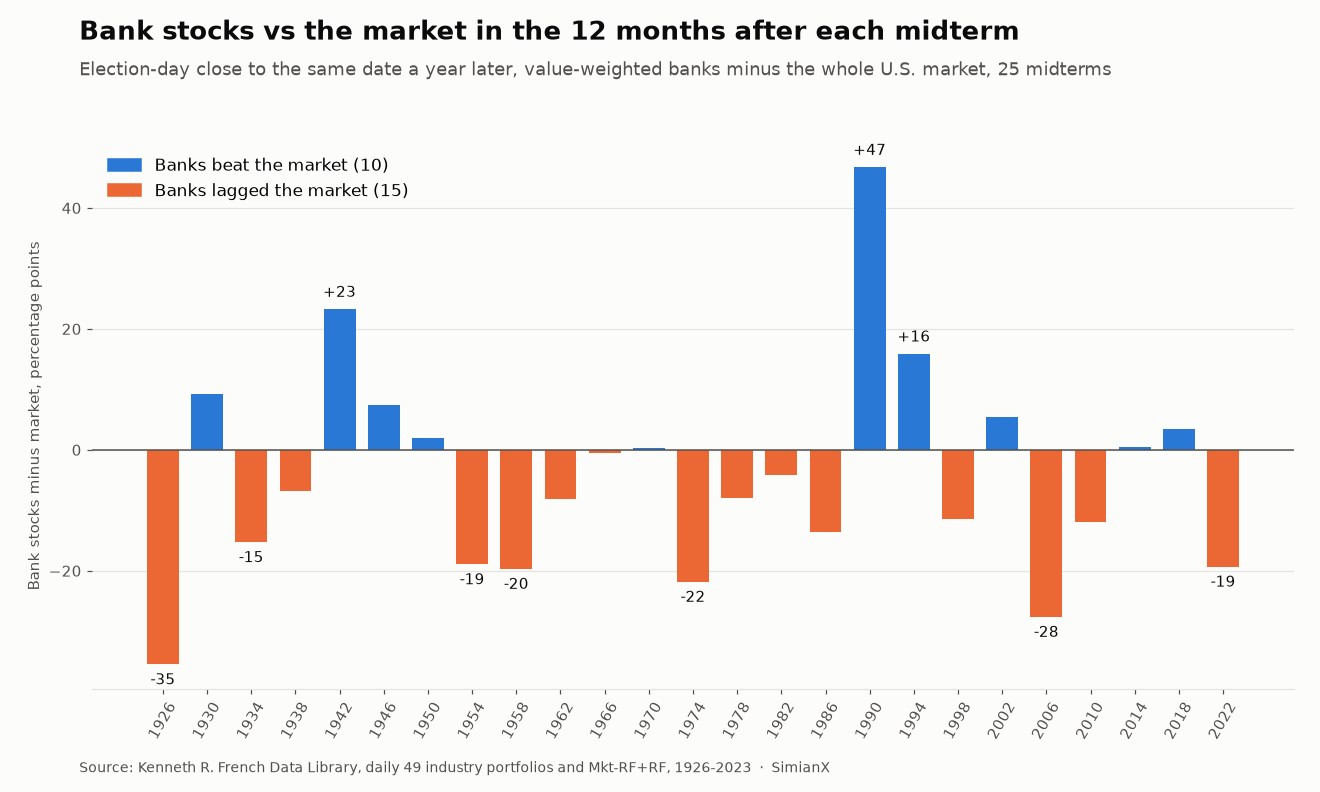
Every midterm since 1926: the reference table
Total returns from the election-day close. "Banks vs market" is the twelve-month gap in percentage points.
| Midterm | Market +3m | Banks +3m | Market +12m | Banks +12m | Banks vs market | Trading +12m |
|---|---|---|---|---|---|---|
| 1926 | +6.2% | −10.9% | +29.0% | −6.4% | −35.5 pts | +28.8% |
| 1930 | −3.8% | −5.2% | −35.4% | −26.2% | +9.2 pts | −48.6% |
| 1934 | −0.4% | +10.5% | +44.5% | +29.3% | −15.2 pts | +61.4% |
| 1938 | −4.2% | −4.9% | +3.2% | −3.6% | −6.8 pts | −14.8% |
| 1942 | +12.0% | +18.7% | +32.3% | +55.5% | +23.2 pts | +50.2% |
| 1946 | +4.2% | +8.6% | +3.1% | +10.5% | +7.4 pts | −2.1% |
| 1950 | +17.3% | +4.5% | +24.8% | +26.7% | +1.9 pts | +36.3% |
| 1954 | +16.0% | +10.8% | +32.3% | +13.4% | −18.9 pts | +30.2% |
| 1958 | +8.8% | −1.8% | +15.9% | −3.7% | −19.7 pts | +7.6% |
| 1962 | +15.1% | +16.0% | +27.6% | +19.4% | −8.1 pts | +35.6% |
| 1966 | +11.7% | +20.7% | +22.1% | +21.6% | −0.5 pts | +41.7% |
| 1970 | +17.2% | +11.9% | +18.1% | +18.4% | +0.3 pts | +30.1% |
| 1974 | +7.8% | +12.8% | +25.1% | +3.3% | −21.8 pts | +14.7% |
| 1978 | +6.1% | +0.6% | +15.8% | +7.9% | −7.9 pts | +18.6% |
| 1982 | +7.0% | −0.7% | +26.1% | +22.0% | −4.1 pts | +26.7% |
| 1986 | +12.9% | +7.4% | −1.1% | −14.7% | −13.5 pts | −10.1% |
| 1990 | +18.0% | +38.7% | +34.2% | +80.9% | +46.7 pts | +61.2% |
| 1994 | +3.6% | +5.0% | +29.6% | +45.4% | +15.8 pts | +39.2% |
| 1998 | +16.0% | +6.9% | +25.7% | +14.2% | −11.5 pts | +34.9% |
| 2002 | −6.7% | −5.8% | +20.4% | +25.8% | +5.5 pts | +37.7% |
| 2006 | +5.9% | +4.5% | +9.4% | −18.2% | −27.6 pts | −2.6% |
| 2010 | +10.3% | +17.6% | +5.3% | −6.6% | −11.9 pts | −18.8% |
| 2014 | +2.1% | −2.9% | +6.1% | +6.6% | +0.5 pts | +4.2% |
| 2018 | −0.3% | −1.2% | +12.6% | +16.0% | +3.4 pts | +9.8% |
| 2022 | +8.2% | +8.4% | +15.4% | −3.9% | −19.3 pts | −1.3% |
The weakest stretch was 1954 to 1978, when banks beat the market after only one of seven midterms, and only by 0.3 points in 1970. For much of that period Regulation Q capped the interest banks could pay on deposits, which left them struggling to hold funding whenever market rates rose. The best single result, +46.7 points after 1990, was a rebound from the bottom of a banking crisis, not a reaction to the vote. Bank shares had been crushed by commercial real-estate losses through 1990, and the recovery began almost exactly as the polls closed.
The five most recent midterms produced two narrow wins (2014 and 2018) and three heavy losses (2006, 2010 and 2022), for an average gap of −11.0 points. All three losses had a bank-specific cause: the start of the subprime crisis, the post-Dodd-Frank rebuild in 2010-11, and the regional-bank failures of 2023.
Is it the midterm, or is it banks?
A fair objection: maybe banks simply lag the market most of the time, and the midterm label adds nothing. It does not hold up. Over every rolling twelve-month window since 1926, value-weighted banks beat the market 54% of the time, with an average gap of +2.8 points. The post-midterm year is the exception, not the rule.
Splitting the century into the four November-to-October windows of the presidential cycle makes this clearer:
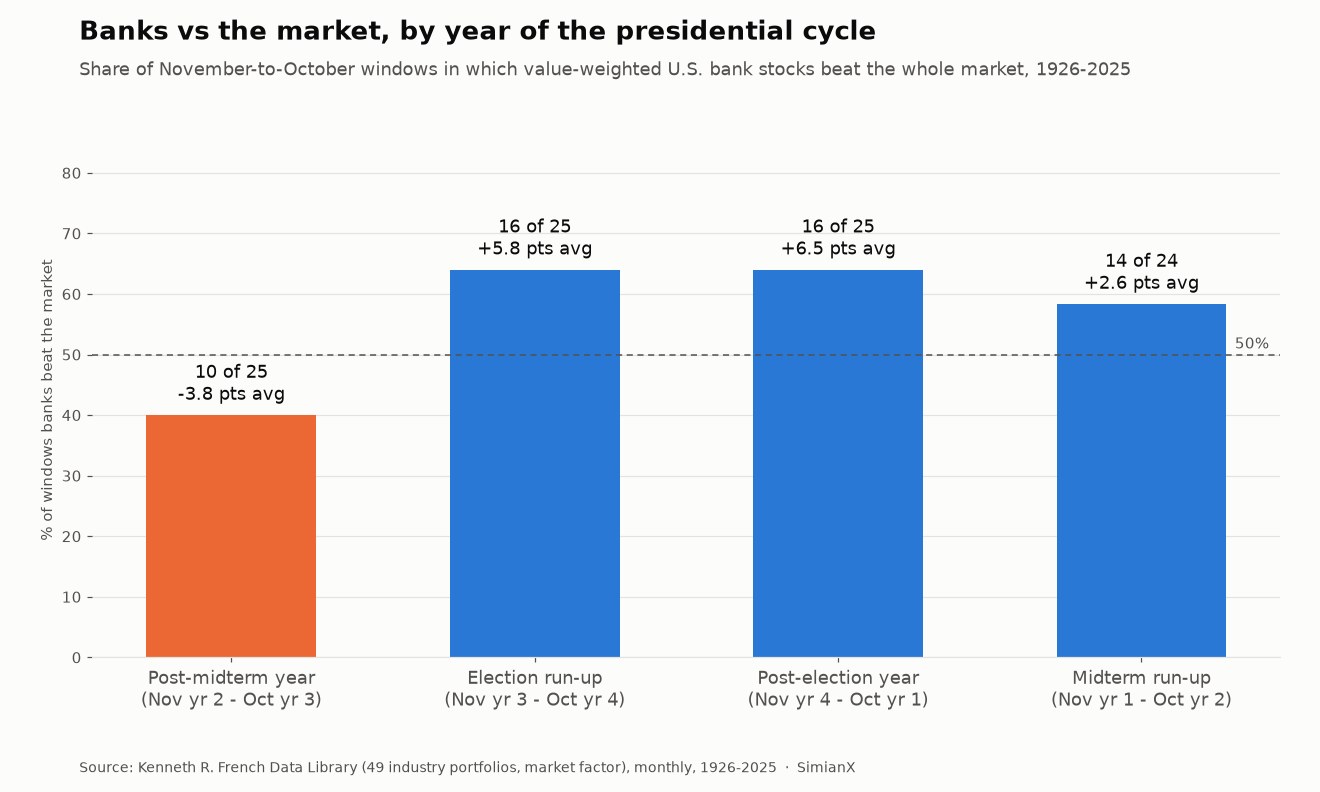
| Cycle window (November to October) | Banks beat market | Average gap |
|---|---|---|
| Post-midterm year (Nov of year 2 to Oct of year 3) | 10 of 25 | −3.8 pts |
| Election run-up (year 3 to year 4) | 16 of 25 | +5.8 pts |
| Post-election year (year 4 to year 1) | 16 of 25 | +6.5 pts |
| Midterm run-up (year 1 to year 2) | 14 of 24 | +2.6 pts |
Banks beat the market in 46 of the 74 November-to-October windows that do not follow a midterm (62%). After midterms they beat it in 10 of 25 (40%). The post-midterm year is also the strongest year for the market as a whole, as our presidential-cycle table and the S&P 500 midterm record both show. So part of the bank result is relative: in a year when the broad market tends to do very well, a low-beta, rate-sensitive sector tends to fall behind even when it rises.
This monthly November-to-October version also reconciles exactly with our sector scoreboard. Its broader "Finance" group (banks, insurers, brokers and real estate together) beat the market after 11 of 25 midterms, with an average gap of −1.6 points. Taking banks out of that group on their own gives 10 of 25 and −3.8 points. The trading portfolio gives 12 of 25 and +1.8 points. The bank number is the worst of the three.
Big banks or small banks?
The French data publishes both a value-weighted bank portfolio, dominated by the giants, and an equal-weighted one, where a small community bank counts as much as a money-center bank. Comparing the two is the closest long-run test of big banks versus regionals.
On monthly November-to-October returns, equal-weighted banks beat value-weighted banks after 16 of 25 midterms, by an average of +3.1 points. That is almost exactly their record in all other years (43 of 74, or 58%, by an average of +3.0 points). So there is no midterm-specific small-bank effect, and the recent trend runs the other way: small banks lost to big banks after six of the nine midterms from 1990 to 2022 (they won 3 of 9).
The ETF era makes the same point more sharply. KRE beat JPM in the year after only two of the last five midterms (2010 and 2014). After 2022 the gap was enormous. From the November 8, 2022 close, KRE was down 43.2% at its May 4, 2023 low, after the failures of Silicon Valley Bank, Signature Bank and First Republic. JPMorgan Chase (JPM) was never more than 5.0% below its election-day close over the same twelve months and finished up 10.1%. Deposits moved from small banks to the largest ones, and the post-midterm year turned into a stress test of balance-sheet size.
The ETF era: XLF, KBE, KRE and JPM, 2006 to 2022
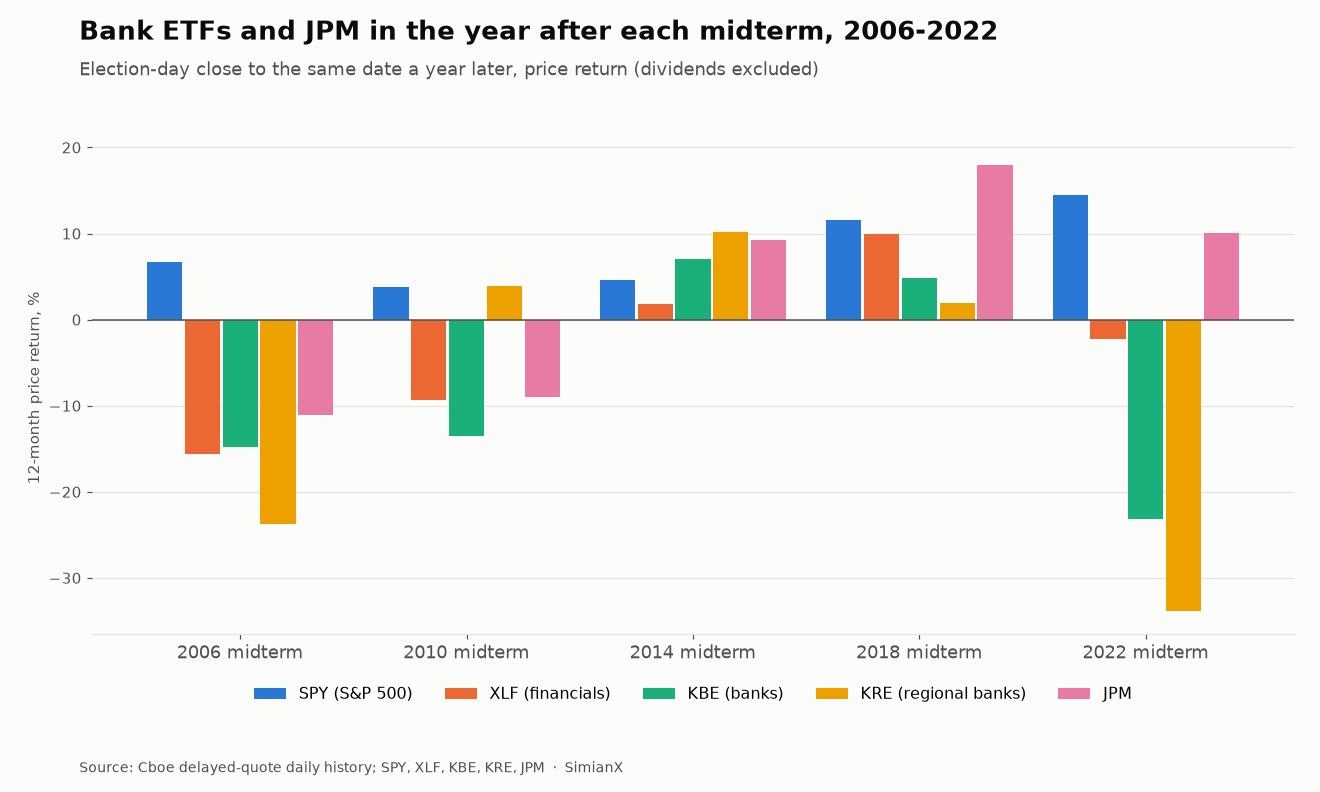
Twelve months after election day (price return):
| Fund | 2006 | 2010 | 2014 | 2018 | 2022 | Average | Beat SPY |
|---|---|---|---|---|---|---|---|
| SPY | +6.7% | +3.8% | +4.6% | +11.6% | +14.5% | +8.2% | — |
| XLF | −15.6% | −9.3% | +1.8% | +10.0% | −2.3% | −3.1% | 0 of 5 |
| KBE | −14.8% | −13.5% | +7.0% | +4.8% | −23.1% | −7.9% | 1 of 5 |
| KRE | −23.7% | +3.9% | +10.2% | +2.0% | −33.9% | −8.3% | 2 of 5 |
| JPM | −11.1% | −9.0% | +9.3% | +18.0% | +10.1% | +3.5% | 2 of 5 |
Six months after election day (price return):
| Fund | 2006 | 2010 | 2014 | 2018 | 2022 | Average | Beat SPY |
|---|---|---|---|---|---|---|---|
| SPY | +8.9% | +14.0% | +5.1% | +6.4% | +8.0% | +8.5% | — |
| XLF | +6.1% | +11.7% | +2.7% | +3.5% | −6.0% | +3.6% | 0 of 5 |
| KBE | +3.6% | +13.9% | +4.4% | +4.6% | −31.3% | −1.0% | 0 of 5 |
| KRE | −1.2% | +18.7% | +3.6% | +2.3% | −40.9% | −3.5% | 1 of 5 |
| JPM | +11.0% | +22.2% | +7.4% | +5.0% | +4.3% | +10.0% | 3 of 5 |
XLF's 0-for-5 holds up. Our sector scoreboard reported that XLF trailed SPY after all five midterms from 2006 to 2022, using dividend-adjusted closes. Re-running the same windows on independent Cboe price data gives the same verdict. Every XLF and SPY return has the same sign, and the per-year XLF and SPY figures differ by at most 1.9 points, the result of price versus dividend-adjusted data. XLF's shortfall against SPY was −22.3, −13.1, −2.8, −1.6 and −16.7 points.
The short-term picture is different. On the first trading day after the election, XLF, KBE, KRE and JPM each beat SPY four times out of five. After 2010 the bank funds were up close to 2% the next day. The vote itself has tended to give banks a small relief bounce. It is the following six to twelve months that have gone wrong.
JPM is the only line in the table that beat SPY more often than it lost over six months, and it is the only bank line with a positive twelve-month average. Size has mattered more than party.
What Congress actually passed
The usual midterm argument for banks is legislative: a new House or Senate majority will roll back regulation, or impose it. Here is what the Congresses elected at midterms actually enacted in banking law, set against the bank stocks' twelve-month result.
| Midterm | Congress elected | Major banking statute | Signed | Inside the 12-month window? | Banks vs market, 12m |
|---|---|---|---|---|---|
| 1934 | 74th | Banking Act of 1935 | Aug 23, 1935 | Yes | −15.2 pts |
| 1954 | 84th | Bank Holding Company Act of 1956 | 1956 | No | −18.9 pts |
| 1978 | 96th | Depository Institutions Deregulation and Monetary Control Act | Mar 31, 1980 | No | −7.9 pts |
| 1986 | 100th | Competitive Equality Banking Act | Aug 1987 | Yes | −13.5 pts |
| 1990 | 102nd | FDIC Improvement Act (FDICIA) | Dec 19, 1991 | No (six weeks after) | +46.7 pts |
| 1998 | 106th | Gramm-Leach-Bliley Act | Nov 12, 1999 | No (nine days after) | −11.5 pts |
| 2006 | 110th | Emergency Economic Stabilization Act (TARP) | Oct 2008 | No | −27.6 pts |
| 2010 | 112th | None. Dodd-Frank was signed July 21, 2010, by the outgoing 111th | — | — | −11.9 pts |
| 2014 | 114th | FAST Act (cut the Fed dividend paid to large member banks) | Dec 4, 2015 | No | +0.5 pts |
| 2018 | 116th | CARES Act (pandemic relief, with bank accounting relief) | Mar 27, 2020 | No | +3.4 pts |
| 2022 | 118th | None, despite the 2023 bank failures | — | — | −19.3 pts |
Three things come out of this table.
The big rollback came before the midterm, not after it. The Economic Growth, Regulatory Relief, and Consumer Protection Act (S.2155), the main loosening of Dodd-Frank, was signed on May 24, 2018. It was passed by the 115th Congress, elected in 2016, six months before the 2018 midterm. Dodd-Frank itself was signed on July 21, 2010, more than three months before the 2010 vote. The two most consequential bank laws of the modern era were both done before the midterms that are often credited or blamed for them. The same is true further back: Garn-St Germain was signed less than three weeks before the 1982 midterm, and the Riegle-Neal interstate banking act about six weeks before the 1994 one.
When a new Congress did pass a bank law, it usually arrived after the window. Of the nine statutes in the table, only two (1935 and 1987) were signed within twelve months of the election, and banks trailed the market both times. Gramm-Leach-Bliley, the repeal of the Glass-Steagall separation, was signed nine days after the 1998 window closed, at the end of a year in which banks trailed the market by 11.5 points. Legislative change is slow, and the market had years of notice for most of these laws.
Divided Congresses rarely touched banks. All five ETF-era midterms produced divided government. Two of the resulting Congresses, the 112th and the 118th, passed no major banking statute at all, and the 118th sat through 2023, the year of three of the four largest bank failures in U.S. history. The response came from regulators and the Treasury rather than from Congress. This fits the result in our gridlock study: split government mostly stops legislation, it does not reverse it.
Why banks tend to lag after midterms
Return data can show that a pattern exists, but it cannot prove why. Three explanations fit the evidence, and none excludes the others.
The rate cycle. Bank earnings depend on the gap between what they pay for deposits and what they earn on loans. Several post-midterm years saw the Federal Reserve pause or pivot as growth slowed (2006-07 and 2018-19), or keep tightening into an inverted yield curve and a deposit run (2022-23). A flattening or inverted yield curve squeezes that gap even as falling discount rates lift long-duration growth stocks. That would explain why banks lag in exactly the year the broad market does best.
The credit cycle. Several of the worst post-midterm years for banks were years when loan losses surfaced: 1974-75 (the real-estate and REIT loan bust that followed the Franklin National failure), 1986-87 (energy and farm loans, Texas banks), 2006-07 (subprime) and 2022-23 (unrealized bond losses and deposit flight). Credit cycles do not follow the election calendar, but it is a fact that they kept arriving in this particular window.
No legislative upside left to price. By election day the regulatory question is usually settled for two years. A split Congress makes new bank legislation unlikely in either direction, so the "deregulation trade" that often lifts bank shares before the vote has nothing left to deliver. The market then trades banks on rates and credit alone, and in most of these windows those were headwinds.
The 2026 setup
Americans vote on November 3, 2026. Here is where the bank group stood at the close that day, using year-to-date price returns from the December 31, 2025 close.
| Ticker | 2026 YTD to Nov 3 close | vs SPY |
|---|---|---|
| SPY | +10.6% | — |
| XLF | +4.4% | −6.2 pts |
| KBE | +9.7% | −0.9 pts |
| KRE | +12.5% | +1.8 pts |
| JPM | +4.9% | −5.7 pts |
Regional banks enter this midterm slightly ahead of the S&P 500 for the year, while the broad financials fund and JPM are about six points behind. In the four ETF-era midterms where KRE has a full year of history, it went into election day ahead of SPY only once, in 2022, when the S&P 500 was down nearly 20% for the year. Every line is also below its 2026 closing high: SPY by 3.2%, XLF by 2.3%, KBE by 7.1%, KRE by 6.5% and JPM by 7.4%.
Two points from the history above apply directly. First, the 2026 rate path matters more for banks than the seat count. We traced how the Fed calendar and the midterms have become entangled in our September Fed analysis. Second, the scenarios in our 12-stock midterm map set out which bank-relevant policies are actually within Congress's reach and which, like capital rules and merger approvals, stay with the regulators whatever the result. You can run a live analysis of JPM on SimianX to see how the market is pricing the largest bank in real time.
The limits of this analysis
Twenty-five observations is a reasonable sample for election studies and a small one for statistics. A 10-of-25 record is not proof of anything on its own; it means more because it is the worst of the four cycle windows and because the margin, an average gap of −4.3 points and a median of −6.8, is large.
The French "Banks" portfolio has changed beyond recognition over a century: from thousands of local banks in 1926 to a market dominated by a handful of national institutions. The ETF sample covers five midterms, all of which produced divided government, so it cannot separate a post-midterm effect from a divided-government effect. The ETF figures are price returns. Bank funds generally pay higher dividends than SPY, so total-return gaps would be somewhat smaller, but on dividend-adjusted data our sector scoreboard still has XLF trailing SPY in all five years.
None of this is a forecast or investment advice. It is a record of what happened.
Frequently asked questions
How do bank stocks perform after midterm elections?
Below the market, more often than not. Over the 25 midterms from 1926 to 2022, value-weighted U.S. bank stocks beat the whole market in the following twelve months only 10 times, by an average gap of −4.3 points. They still rose in 17 of those 25 years. The market rose in 23.
Did XLF really lose to the S&P 500 after every recent midterm?
Yes. Measured from each election-day close to the same date a year later, XLF trailed SPY after the 2006, 2010, 2014, 2018 and 2022 midterms. The margin ran from 1.6 points (2018) to 22.3 points (2006). It also trailed SPY over six months all five times.
Are regional banks a better midterm trade than big banks?
Not on the record. KRE beat JPM after only two of the last five midterms. Over the long sample, equal-weighted (small-bank-heavy) bank stocks beat the big-bank-weighted portfolio after 16 of 25 midterms, no better than their record in all other years. Since 1990 big banks have won six of nine.
Does a Republican or Democratic win change the bank trade?
The data offers little support for a party trade. The biggest deregulation law of the past decade, S.2155, was signed six months before the 2018 midterm, and Dodd-Frank was signed before the 2010 midterm. The Congresses elected at midterms passed few major bank laws, and most of those arrived after the twelve-month window.
Is there a short-term bounce in bank stocks after the vote?
A small one. On the first trading day after the last five midterms, XLF, KBE, KRE and JPM each beat SPY four times out of five. Over the full 25-midterm sample, the one-day result is a coin flip: banks beat the market 12 times.
Why do brokers do better than banks after midterms?
The trading portfolio (brokers, exchanges and asset managers) earns more from rising markets and trading volume, and the post-midterm year has historically been the strongest year for stocks. Banks earn more from the yield curve and loan growth, which have often been working against them in the same window.
What should investors watch for banks after the 2026 midterms?
The yield curve, deposit costs and credit quality matter more than the composition of Congress. Historically those factors explain most of the bad post-midterm years for banks, while landmark bank legislation has usually come either before the vote or long after it.
The bottom line
The post-midterm year has been the worst year of the four-year cycle for bank stocks: 10 wins against the market in 25 midterms since 1926, an average shortfall of 4.3 points, and 0 for 5 for XLF against SPY in the ETF era. Brokers and asset managers have held their own, and the largest bank, JPM, has done better than the bank funds. The legislation that supposedly drives the bank trade has mostly been signed before the vote or well after the window. On this record, rates and credit have mattered more to banks than who won.
Sources. Kenneth R. French Data Library: 49 industry portfolios (value- and equal-weighted, daily and monthly), 12 industry portfolios and the Fama-French research factors, total returns from July 1926 (data file built from the September 2026 CRSP database). Cboe delayed-quote daily history for SPY, XLF, KBE, KRE and JPM, with the November 3, 2026 close from the Cboe delayed quote. Statutes and signing dates from congress.gov and the Federal Reserve History essays. Election dates: the first Tuesday after the first Monday in November. Charts produced by SimianX from the underlying return data. Definitions: Fama-French industry portfolios, net interest margin, yield curve.
Related reading
- Best Sectors After Midterm Elections: 100 Years of Data: the twelve-sector scoreboard this page sits beneath
- Is Gridlock Good for Stocks? 49 Congresses, 1927-2025: divided versus unified government, term by term
- Midterm Election Years and the Stock Market: 1950-2026: the index-level record
- 2026 Midterm Election Stocks: 12 Tickers, 3 Scenarios: what changes under each configuration of Congress
- The Presidential Cycle: S&P 500 Returns by Year, 1928-2025: where the post-midterm year sits in the four-year pattern
- Homebuilder Stocks After Midterm Elections: 1926-2022 Data: the other rate-sensitive sector, with the mortgage-rate table