
 By Marcus Reeve
Small Caps vs Large Caps After Midterm Elections: 25 Cycles of Data
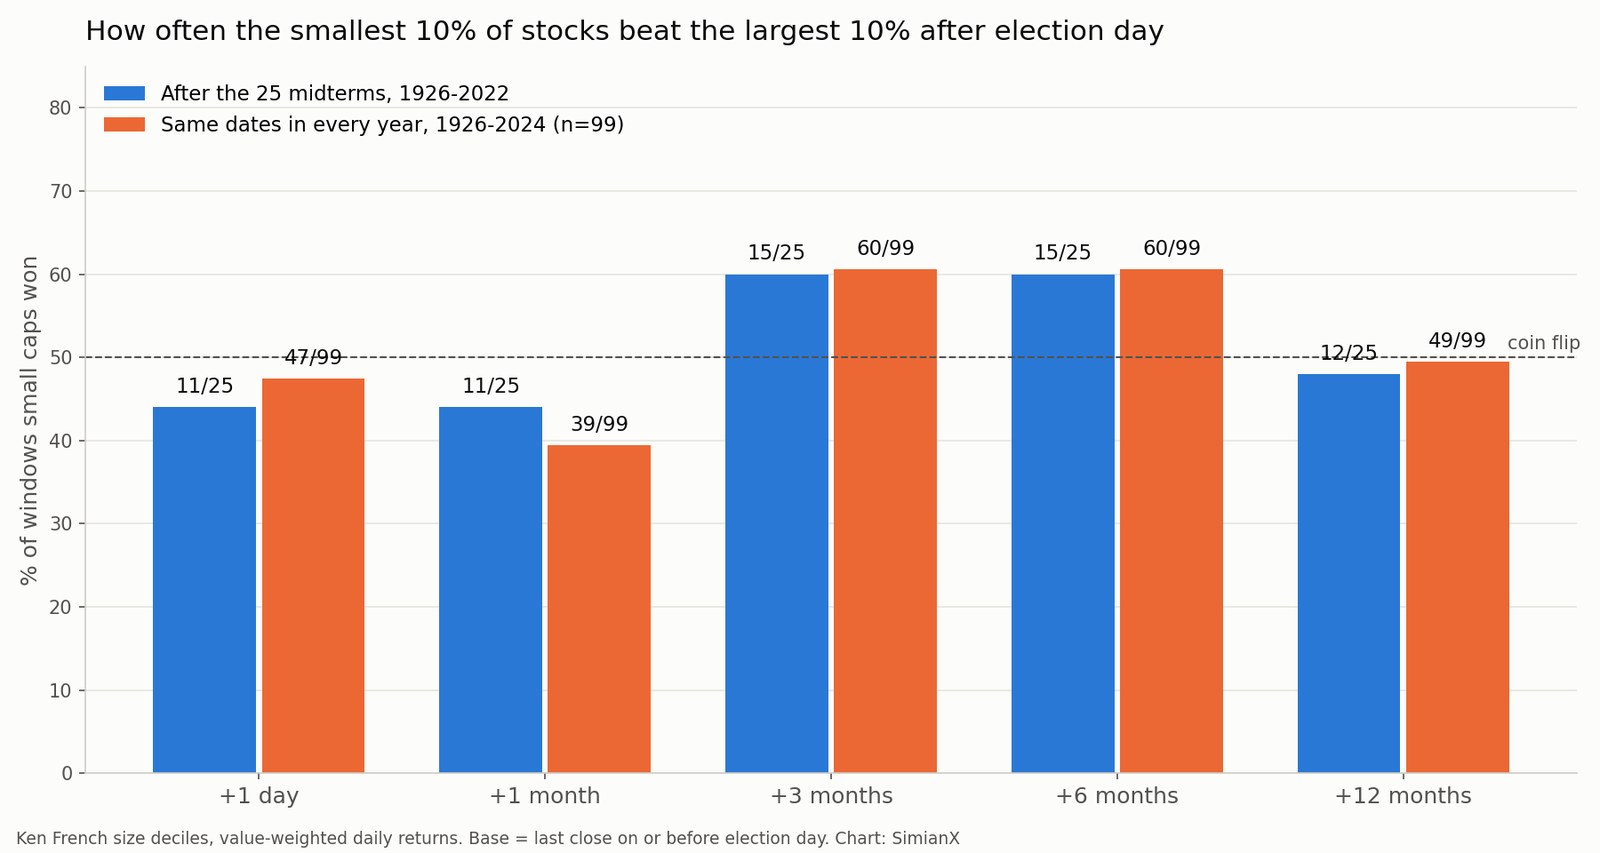
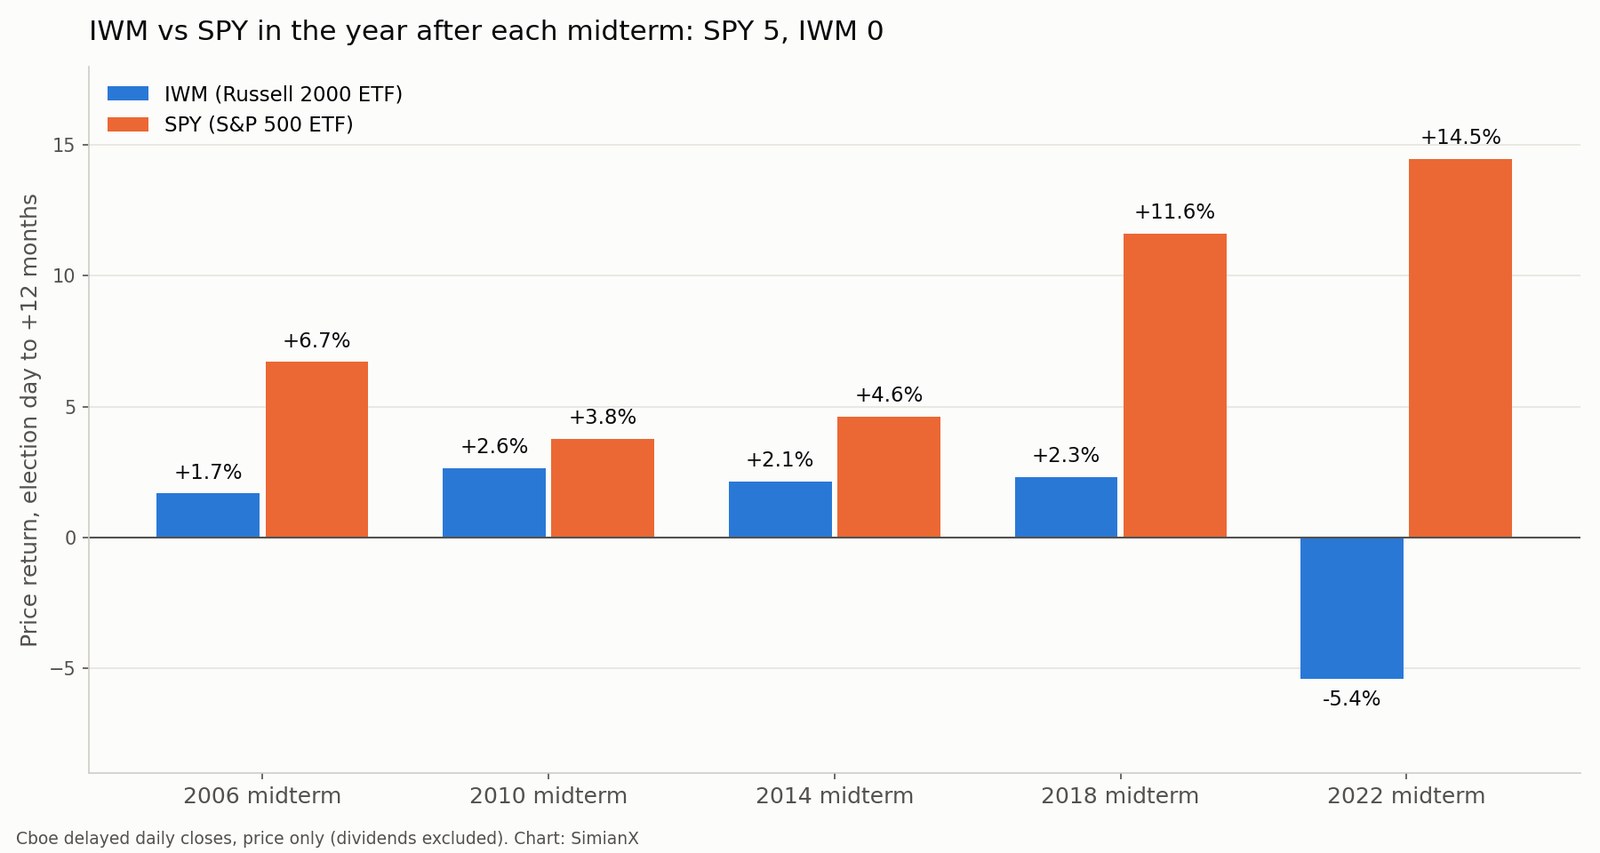
Quick answer. Not reliably. Across all 25 U.S. midterm elections from 1926 to 2022, the smallest 10% of stocks beat the largest 10% in the twelve months after election day only 12 times out of 25. Small caps did better over the shorter three- and six-month windows, winning 15 of 25 each, but they win those same windows about 60% of the time in every year, midterm or not. And the recent record runs the other way: small caps lost the twelve-month race after all five midterms from 2006 to 2022, and the Russell 2000 fund IWM trailed the S&P 500 fund SPY after every one of them.
Result (as of 1:50 a.m. ET, November 4, 2026): Democrats won control of both the Senate and the House, calls made by AP and NBC News. By AP's count at 1:30 a.m. ET, Democrats had flipped seven Republican-held Senate seats and 16 House seats. Congress will be split from the White House from January 3, 2027.
Every two years the same pitch comes back: once the election is out of the way, "risk-on" money rotates into small caps, because smaller domestic companies are supposed to gain most from lower policy uncertainty. This article tests that claim against a century of data. The index-level record (how the S&P 500 does after midterms) is in our midterm election reference table, 1950–2026, and the sector version is in best sectors after midterm elections. This page answers one narrower question: does company size matter after a midterm?
How this was measured
Data. The long sample uses the Kenneth R. French Data Library "Portfolios Formed on Size" file: U.S. stocks sorted by market value every June using NYSE breakpoints, with value-weighted daily total returns from July 1926 to September 2026. We compare two pairs:
- Decile pair: the smallest 10% of stocks ("Lo 10") against the largest 10% ("Hi 10").
- Quintile pair: the smallest 20% ("Lo 20") against the largest 20% ("Hi 20").
Dividends are included on both sides, so this is a like-for-like comparison.
Dates. Midterm election day is the first Tuesday after the first Monday in November, which gives 25 elections from 2 November 1926 to 8 November 2022. The starting point is the last close on or before election day. The daily data show no trading on election day through 1966 (the NYSE closed for the vote), so for those years the base is the Monday close. From that base we compound returns to the last trading day on or before the same calendar date one month, three months, six months and twelve months later, plus the next trading day ("+1 day").
Modern check. For recent cycles we add Cboe delayed daily closes for IWM and SPY (available from January 2004, so the 2006–2022 midterms) and for the Russell 2000 index (_RUT) against the S&P 500 index (_SPX) (available from November 2020, so the 2022 midterm). These are price returns without dividends on either side, so treat the closest calls (gaps of one or two points) with care.
A note on size. The bottom Fama-French decile holds true micro-caps, much smaller than a typical Russell 2000 company. The quintile pair is closer to what most investors mean by "small caps," which is why both pairs are shown. Where they agree, the result does not depend on where you draw the line.
The scoreboard: small vs large after 25 midterms
| Window after election day | Decile pair: small wins | Avg small − large | Median small − large | Quintile pair: small wins | Avg small − large |
|---|---|---|---|---|---|
| +1 day | 11 of 25 | +0.11 pts | −0.10 pts | 9 of 25 | −0.08 pts |
| +1 month | 11 of 25 | −0.93 pts | −0.99 pts | 13 of 25 | −0.45 pts |
| +3 months | 15 of 25 | +4.48 pts | +4.12 pts | 16 of 25 | +3.94 pts |
| +6 months | 15 of 25 | +7.08 pts | +5.80 pts | 15 of 25 | +6.06 pts |
| +12 months | 12 of 25 | +7.25 pts | −2.18 pts | 12 of 25 | +6.49 pts |
Three things stand out.
The first month belongs to large caps. In the month after a midterm, the smallest decile won just 11 of 25 times and trailed by about a point on both the average and the median. The day-after reaction is a coin flip that leans the same way. If there is a post-election "small-cap pop," it has not shown up in the first few weeks.
The three-to-six-month window is where small caps win. From election day to early February, the smallest decile beat the largest in 15 of 25 cycles by a median of 4.1 points; out to early May, 15 of 25 again by a median of 5.8 points. The quintile pair says the same thing (16 and 15 wins).
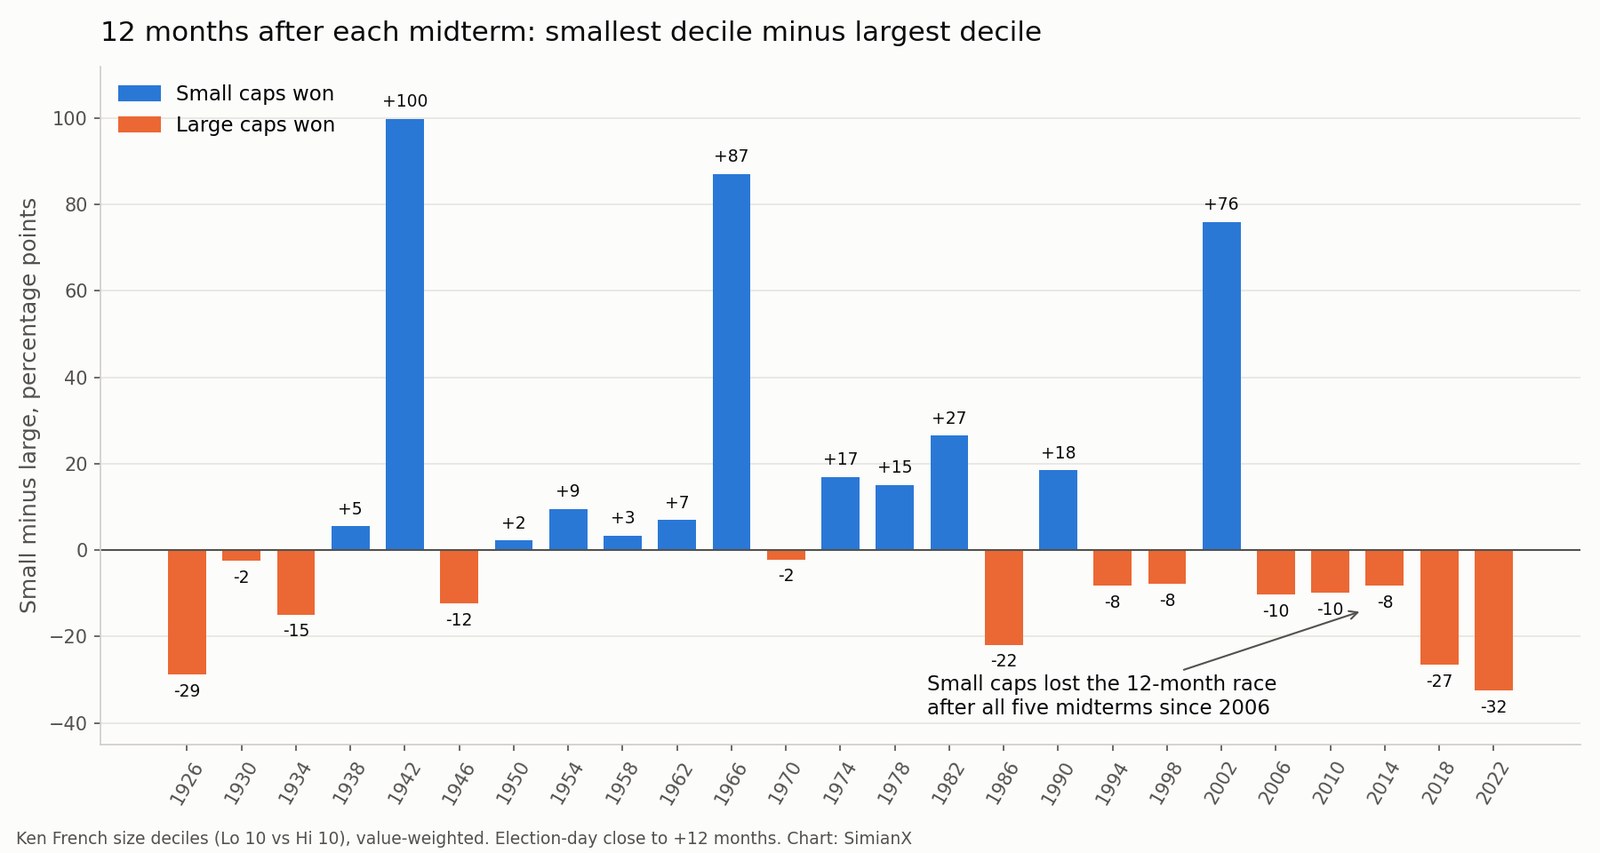
Over a full year the edge disappears. Twelve months out, small caps won 12 times and lost 13. The average gap still favors small caps by 7.3 points, but the median is −2.2 points. The average is carried by three huge years: 1942 (+99.9 points), 1966 (+87.1) and 2002 (+76.0). Take those three away and the typical post-midterm year has been slightly better for large caps.
Is the small-cap edge about midterms at all?
This is the test most "small caps after the election" articles skip. If small caps win the November-to-spring window after midterms, do they also win it in years with no midterm? We ran the exact same windows from the same date, the first Tuesday after the first Monday in November, in every year from 1926 to 2024 (99 years).
| Window | 25 midterm years | 74 non-midterm years | All 99 years |
|---|---|---|---|
| +1 month | 44% (11/25) | 38% (28/74) | 39% (39/99) |
| +3 months | 60% (15/25) | 61% (45/74) | 61% (60/99) |
| +6 months | 60% (15/25) | 61% (45/74) | 61% (60/99) |
| +12 months | 48% (12/25) | 50% (37/74) | 49% (49/99) |
(Decile pair: share of windows in which the smallest decile beat the largest.)
The midterm years look almost exactly like every other year. Small caps win the November-to-May stretch about six times in ten whether or not there was an election. That is the well-documented January effect, the tendency for the smallest stocks to rebound around the turn of the year after year-end tax-loss selling. The election falls in the same week every cycle, so it simply sits at the start of that seasonal window. The vote does not cause it.
A calendar-month cross-check from the monthly file, starting at the end of October, gives the same picture: November alone favors small caps in 10 of 25 midterms, November–January in 17 of 25, November–April in 14 of 25, and November–October in 12 of 25.
So the honest answer to "do small caps beat large caps after midterms?" is that the midterm adds nothing you could not get from the calendar. For the political part of the calendar, see the presidential cycle by term year, where the year after a midterm is one of the strongest stretches of the four-year cycle for the whole market. That strength has not come with a reliable size tilt.
Every midterm since 1926, twelve months later
| Election | Smallest decile | Largest decile | Small − large | Smallest quintile | Largest quintile | Small − large |
|---|---|---|---|---|---|---|
| 1926 | +3.7% | +32.4% | −28.7 | +15.8% | +30.7% | −14.9 |
| 1930 | −34.7% | −32.2% | −2.4 | −43.1% | −34.0% | −9.1 |
| 1934 | +28.1% | +43.0% | −14.9 | +50.0% | +44.1% | +5.9 |
| 1938 | +10.6% | +5.1% | +5.5 | +3.7% | +3.6% | +0.1 |
| 1942 | +127.9% | +28.1% | +99.9 | +97.1% | +30.2% | +66.8 |
| 1946 | −6.9% | +5.4% | −12.4 | −3.2% | +4.5% | −7.7 |
| 1950 | +25.7% | +23.5% | +2.2 | +24.2% | +24.3% | −0.2 |
| 1954 | +44.2% | +34.7% | +9.5 | +41.7% | +33.7% | +8.0 |
| 1958 | +18.6% | +15.3% | +3.3 | +27.2% | +15.0% | +12.2 |
| 1962 | +35.5% | +28.5% | +6.9 | +32.1% | +28.9% | +3.1 |
| 1966 | +101.2% | +14.2% | +87.1 | +90.6% | +14.8% | +75.8 |
| 1970 | +13.6% | +15.8% | −2.2 | +15.7% | +16.1% | −0.4 |
| 1974 | +37.4% | +20.6% | +16.9 | +38.4% | +22.1% | +16.3 |
| 1978 | +25.4% | +10.3% | +15.1 | +25.7% | +12.0% | +13.7 |
| 1982 | +49.2% | +22.6% | +26.5 | +45.4% | +22.9% | +22.6 |
| 1986 | −16.0% | +5.9% | −21.9 | −17.3% | +3.7% | −20.9 |
| 1990 | +44.9% | +26.4% | +18.5 | +51.1% | +29.6% | +21.5 |
| 1994 | +24.7% | +32.9% | −8.2 | +25.9% | +32.2% | −6.3 |
| 1998 | +17.7% | +25.6% | −7.9 | +21.7% | +24.4% | −2.7 |
| 2002 | +89.2% | +13.2% | +76.0 | +72.0% | +15.5% | +56.5 |
| 2006 | −0.7% | +9.6% | −10.3 | −1.3% | +9.8% | −11.1 |
| 2010 | −4.6% | +5.3% | −9.9 | −1.6% | +5.4% | −7.1 |
| 2014 | −1.1% | +7.1% | −8.2 | +0.5% | +6.7% | −6.2 |
| 2018 | −12.3% | +14.2% | −26.5 | −7.3% | +13.8% | −21.2 |
| 2022 | −11.5% | +21.0% | −32.5 | −14.3% | +18.2% | −32.5 |
(Value-weighted total returns, election-day base to +12 months; differences in percentage points.)
The table splits into two eras.
1950 to 1990: the small-cap era. In the eleven midterms from 1950 through 1990, the smallest decile won the following year nine times. This was also the period when academics first documented the size premium, the finding that small stocks earned more than large ones over long horizons.
1994 to 2022: the large-cap era. In the eight midterms since 1994, small caps won only once, after the 2002 election, when the market was coming out of the dot-com crash and the smallest stocks rebounded hardest. Every other cycle went to large caps, and the two most recent gaps were the largest: −10.3 points after 2006, −9.9 after 2010, −8.2 after 2014, −26.5 after 2018 and −32.5 after 2022, the worst post-midterm year for small caps in the whole 1926–2022 record.
Counted from 1982, small caps won the twelve-month window after only 3 of 11 midterms (1982, 1990, 2002).
The modern check: IWM vs SPY and the Russell 2000
The French portfolios are an academic construction. Here is the same question with funds you can actually trade.
| Midterm | +1 month IWM / SPY | +3 months IWM / SPY | +6 months IWM / SPY | +12 months IWM / SPY |
|---|---|---|---|---|
| 2006 | +3.4% / +1.8% | +6.5% / +4.8% | +8.4% / +8.9% | +1.7% / +6.7% |
| 2010 | +5.4% / +2.6% | +11.5% / +9.2% | +19.8% / +14.0% | +2.6% / +3.8% |
| 2014 | +0.9% / +3.3% | +2.2% / +1.5% | +5.7% / +5.1% | +2.1% / +4.6% |
| 2018 | −4.8% / −1.9% | −2.4% / −0.9% | +3.9% / +6.4% | +2.3% / +11.6% |
| 2022 | +0.7% / +3.7% | +7.3% / +7.5% | −3.1% / +8.0% | −5.4% / +14.5% |
| IWM wins | 2 of 5 | 3 of 5 | 2 of 5 | 0 of 5 |
(Price returns from Cboe daily closes, election day to the last close on or before the same date later; the winner in each cell is in bold.)
The ETF record matches the French data closely. IWM held its own over the first three months, winning three of five, which fits the seasonal pattern above. Over twelve months it lost every time: by 5.0 points after 2006, 1.2 after 2010, 2.5 after 2014, 9.3 after 2018 and 19.9 after 2022.
The index check for 2022 says the same. From the 8 November 2022 close, the Russell 2000 (_RUT) went from 1,808.93 to 1,714.07 one year later (−5.2%) while the S&P 500 (_SPX) rose from 3,828.11 to 4,382.78 (+14.5%), a gap of 19.7 points. The three-month window was nearly a tie (+7.4% vs +7.6%), and the gap opened between February and May 2023, the months of the U.S. regional-bank failures. Small caps hold a large share of regional banks, which is a reminder that the biggest post-midterm moves usually come from events that have nothing to do with the vote.
The 2026 setup: small caps are leading into this midterm
Going into election day on 3 November 2026, small caps are ahead for the year. Through the 3 November 2026 close, the Russell 2000 (RUT) is up 13.3% year to date (2,481.91 on 31 December 2025 to 2,812.45), against 10.6% for the S&P 500 (SPX, 6,845.50 to 7,568.92), a lead of about 2.8 points. The ETFs agree through the latest Cboe close on 2 November: IWM +13.4%, SPY +10.3%. The French data, which runs through 30 September, show the same order: smallest decile +15.4% for 2026 against +11.6% for the largest.
That lead comes from a low base. Measured as the ratio of the Russell 2000 to the S&P 500, small caps peaked against large caps on 12 March 2021 and hit their weakest level on 11 April 2025, about 42% lower. On 3 November 2026 the ratio sat only about 7% above that low.
Does leading into a midterm mean anything? In the French data there is a pattern, but the sample is small. In the 24 midterms with a full year of data before the vote (1930–2022), the quintile pair had small caps ahead year to date on election day 12 times. Small caps went on to win the following twelve months in 9 of those 12. When small caps were behind going in, they won the next twelve months only 3 of 12 times. The decile pair splits the same way (7 of 9 versus 5 of 15).
Treat that as a description, not a signal. Twelve cases is not enough to rule out chance, and the two most recent "leading" years both failed: 2010 (small caps 7.8 points ahead going in, then −7.1 points over the year) and 2022 (+1.1 points ahead going in, then −32.5 points, the worst result in the table). 2026 joins the "small caps leading" group. History cannot say whether it ends like 1958 or like 2022.
What actually drives small vs large after a midterm
If the election itself does not explain the size gap, what does? Looking down the twelve-month table, the large small-cap wins share a common setting rather than a common political result:
- Coming out of a bear market or recession: 1942, 1974, 1982, 1990 and 2002 all started near major market lows. Small stocks fall furthest in a downturn and usually rebound hardest.
- Credit and rates: Smaller companies borrow more at floating rates and depend more on bank credit. The two worst years for small caps, 2018 and 2022, both came during Federal Reserve tightening cycles.
- Market leadership: Since the mid-1990s, a few mega-cap companies have accounted for a growing share of index gains. The largest-decile portfolio holds those winners; the smallest decile does not.
None of these is decided on election night. For what the vote can change, such as tax law, spending and regulation, see the 12 tickers to watch under three Congress outcomes and the gridlock record across 49 Congresses.
How to use this table
- Don't buy small caps just because of a midterm. After 25 cycles, the twelve-month record is 12 wins and 13 losses, with a negative median.
- If you use the seasonal window, know what it is. The November-to-May small-cap edge is real in the data (about 60% of windows), but it is a calendar effect that shows up in non-election years too.
- Weigh the recent era more heavily. Small caps lost the year after every midterm since 2006, both in the French data and in IWM vs SPY. Any small-cap case for 2027 has to explain what is different now.
- Watch the drivers, not the ballot. Rate direction, credit conditions and whether the market is coming out of a drawdown have lined up with the big small-cap years far better than which party won.
To track how small and large caps behave after this election, you can start a live AI analysis of IWM on SimianX and compare it with SPY in real time.
FAQ
Do small caps outperform after midterm elections?
Not over a full year. The smallest 10% of U.S. stocks beat the largest 10% in the twelve months after 12 of the 25 midterms from 1926 to 2022, and the median gap was −2.2 points. They did better over three and six months (15 of 25 each), but they win those windows about as often in years without a midterm.
Did the Russell 2000 beat the S&P 500 after the 2022 midterm?
No. From the 8 November 2022 close, the Russell 2000 fell 5.2% over the next twelve months while the S&P 500 rose 14.5%. IWM returned −5.4% against +14.5% for SPY.
When did small caps last beat large caps after a midterm?
Over a twelve-month window, after the 2002 midterm, when the smallest decile beat the largest by 76 points as markets came out of the dot-com bear market. Small caps have lost the year after all five midterms since then.
Is there a post-election small-cap rally?
Not in the first month. Small caps trailed large caps in the month after the election in 14 of 25 midterms, with a median gap of about −1 point. Any small-cap strength has come later, from about December through spring, and it follows the January effect, which appears in non-election years too.
Are small caps leading going into the 2026 midterm?
Yes. Through the 3 November 2026 close, the Russell 2000 was up 13.3% year to date against 10.6% for the S&P 500. In past midterms, small caps that led into the vote went on to win the next year 9 of 12 times in the quintile data, but that is a small sample, and both 2010 and 2022 broke the pattern.
Does this include dividends?
The 1926–2022 French data are total returns. The IWM, SPY, RUT and SPX figures are price returns without dividends on either side, so the narrowest gaps (such as IWM vs SPY after 2010, 1.2 points) should be read with that in mind.
Bottom line
The claim that small caps rally after midterms does not hold up over 25 elections. Small caps beat large caps in the year after 12 of 25 midterms, lost all five since 2006, and their spring strength comes from a calendar effect that shows up every year. In 2026 small caps go into the vote with a year-to-date lead. In the past that has been a better-than-average starting point, but the sample is small, and it failed badly the last time, in 2022.
This article is historical research, not investment advice. Past patterns, especially from samples of 25 elections or fewer, do not predict future returns.
Sources. Kenneth R. French Data Library, "Portfolios Formed on Size" (value-weighted daily and monthly returns, July 1926 to September 2026, CRSP data via Tuck School of Business). Cboe delayed daily price history for IWM and SPY (from January 2004) and for the Russell 2000 (RUT, from November 2020) and S&P 500 (SPX) indexes, through the 3 November 2026 close. Election dates follow the federal rule (first Tuesday after the first Monday in November). Background: Russell 2000, small cap. Calculations and charts by SimianX.
Related reading
- Stock Market After Midterm Elections: Every Cycle 1950–2026: the S&P 500 record this article sits beneath
- Best Sectors After Midterm Elections: 100 Years of Data: the same 25 midterms, split by industry
- Is Gridlock Good for Stocks? 49 Congresses, 1927–2025: returns by who controls Washington
- 2026 Midterm Election Stocks: 12 Tickers, 3 Scenarios: what changes under each Congress outcome
- Presidential Cycle: S&P 500 Returns by Term Year, 1928–2025: where the post-midterm year sits in the four-year cycle
- Stocks in the Lame-Duck Session: 25 Midterms, 1926-2022: election day to January 3 across 25 midterms, with the 2026-27 calendar
- Nasdaq After Midterm Elections: Every Midterm 1974-2022: the tech-heavy index after the 13 midterms since 1974