
 By Marcus Reeve
Nasdaq After Midterm Elections: Every Midterm Since 1974
Data through the November 3, 2026 close. Every figure below is recomputed from the Federal Reserve Bank of St. Louis copy of the Nasdaq Composite's daily closes (FRED series NASDAQCOM) and Cboe's daily S&P 500 history.
Quick answer: Across the 13 US midterm elections since 1974, the Nasdaq Composite was higher 12 months after the vote 12 times, with an average gain of +25.7% (median +19.6%), measured from the last close before election day. It beat the S&P 500 over those 12 months in 11 of 12 midterms since 1978, by a median of 9.5 percentage points. From September 30 of the midterm year to June 30 of the next year it rose in 12 of 13 cycles, by an average of +29.4%, against +7.2% for the same window in all other years. The one 12-month loss was 1986–87 (−11.4%), when the October 1987 crash hit. Thirteen elections are a small sample. In 2026 the Nasdaq closed at 25,164.36 on Monday, November 2, the day before the vote: +8.3% for the year, but 6.3% below its September 30 close and 8.8% below its October 6 record.
Result (as of 1:50 a.m. ET, November 4, 2026): Democrats won control of both the Senate and the House, calls made by AP and NBC News. By AP's count at 1:30 a.m. ET, Democrats had flipped seven Republican-held Senate seats and 16 House seats. Congress will be split from the White House from January 3, 2027.
"How does the Nasdaq do after midterms?" is one of the most searched market questions in the week of a US midterm election, and most answers borrow the S&P 500's record. Our stock market after midterm elections reference covers the S&P 500 in every cycle since 1950. Our Nasdaq returns by year table covers every calendar year since 1971, and the Nasdaq's worst days covers its crashes. This page answers the narrower question none of them does: what did the Nasdaq Composite itself do after each of the 13 midterms it has existed for, and did it do better or worse than the S&P 500?
The short version: the Nasdaq's record after midterms is the S&P 500's record with more amplitude. The direction was almost always up, the gains were larger, and the one bad year was very bad. Most of the gain came in the three quarters around the vote, not on election night.
How the numbers were built
- Index: the Nasdaq Composite, daily closes from FRED series NASDAQCOM, which begins on February 5, 1971 at a base of 100. All figures are price returns (dividends excluded), the way the index is quoted.
- Midterms covered: 1974, 1978, 1982, 1986, 1990, 1994, 1998, 2002, 2006, 2010, 2014, 2018 and 2022. That is 13 elections. Read every count below as a description of what happened, not a probability.
- Election day: the first Tuesday after the first Monday in November. US stock markets were open on all 13 of these election days.
- Base: the last close before election day (the Monday). The +1-month, +3-month and +12-month changes run from that close to the last close on or before the same calendar date one, three and twelve months after election day.
- Day after the vote: the close on the Wednesday after election day versus the election-day close, i.e. the market's first full session with the result known.
- September 30 → June 30: the last close on or before September 30 of the midterm year to the last close on or before June 30 of the next year, the window our S&P 500 midterm study singles out as the strongest of the four-year cycle.
- S&P 500 comparison: Cboe's daily S&P 500 index (SPX) history, which begins on January 2, 1975, so it covers the 12 midterms from 1978 onward on exactly the same dates. For 1974 the only S&P 500 figure used is the September 30 → June 30 return of +49.8% published in our S&P 500 midterm reference; the other 1974 S&P cells are marked n/a. As a check, the Cboe file reproduces that study's published figures to within 0.1 point in every case except one (1982–83 September → June: +39.6% here, +39.2% there), and it matches FRED's S&P 500 series on its 2016–2026 overlap.
- Base rates: for context, the share of all Nasdaq trading days since 1971 on which the index was higher one day, one month, three months and twelve months later, and the September → June window in every year, not only midterm years.
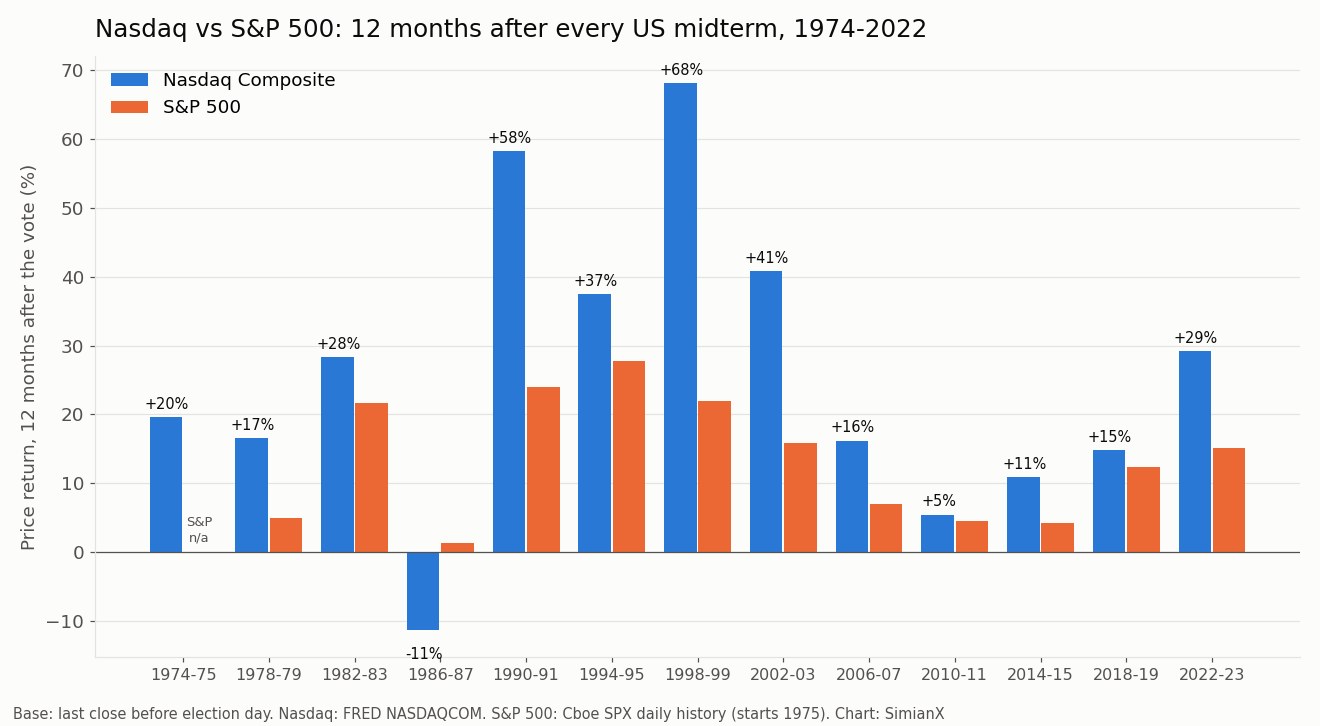
The Nasdaq after every midterm since 1974: the reference table
| Midterm (election day) | Nasdaq, last close before the vote | Year to date into the vote | Day after the vote | +1 month | +3 months | +12 months | S&P 500, +12 months | Nasdaq minus S&P, 12 months |
|---|---|---|---|---|---|---|---|---|
| Nov 5, 1974 | 64.62 | −29.9% | +0.2% | −8.8% | +10.0% | +19.6% | n/a | n/a |
| Nov 7, 1978 | 115.08 | +9.5% | +0.1% | +3.0% | +6.7% | +16.6% | +4.9% | +11.6 pts |
| Nov 2, 1982 | 214.52 | +9.5% | +2.4% | +10.1% | +15.7% | +28.3% | +21.7% | +6.6 pts |
| Nov 4, 1986 | 361.14 | +11.1% | +0.1% | +0.8% | +11.6% | −11.4% | +1.3% | −12.6 pts |
| Nov 6, 1990 | 340.76 | −25.1% | −1.1% | +9.3% | +28.9% | +58.3% | +24.0% | +34.4 pts |
| Nov 8, 1994 | 762.31 | −1.9% | −0.04% | −5.7% | +2.8% | +37.5% | +27.8% | +9.7 pts |
| Nov 3, 1998 | 1,800.91 | +14.7% | +2.0% | +8.5% | +38.5% | +68.2% | +21.9% | +46.3 pts |
| Nov 5, 2002 | 1,396.54 | −28.4% | +1.3% | +1.0% | −6.8% | +40.8% | +15.8% | +25.0 pts |
| Nov 7, 2006 | 2,365.95 | +7.3% | +0.4% | +2.6% | +5.3% | +16.2% | +6.9% | +9.2 pts |
| Nov 2, 2010 | 2,504.84 | +10.4% | +0.3% | +3.0% | +9.8% | +5.4% | +4.5% | +0.9 pts |
| Nov 4, 2014 | 4,638.91 | +11.1% | −0.1% | +2.8% | +1.7% | +10.9% | +4.2% | +6.7 pts |
| Nov 6, 2018 | 7,328.85 | +6.2% | +2.6% | −1.9% | +0.6% | +14.8% | +12.4% | +2.4 pts |
| Nov 8, 2022 | 10,564.52 | −32.5% | −2.5% | +4.9% | +12.7% | +29.2% | +15.1% | +14.1 pts |
| Average | −2.9% | +0.43% | +2.3% | +10.6% | +25.7% | +13.4% | +12.8 pts | |
| Median | +7.3% | +0.18% | +2.8% | +9.8% | +19.6% | +13.7% | +9.5 pts | |
| Higher in | 8 of 13 | 9 of 13 | 10 of 13 | 12 of 13 | 12 of 13 | 12 of 12 | Nasdaq ahead 11 of 12 | |
| Nov 3, 2026 | 25,164.36 | +8.3% | Nov 4, 2026: to be added after the close | pending | pending | pending | pending | pending |
The S&P 500 averages in this table cover the 12 midterms from 1978 to 2022; the Nasdaq averages cover all 13. Measured from the election-day close instead of the Monday close, the S&P 500's 12-month figures are identical to those in our S&P 500 midterm table, which is how the two data sets were reconciled.
What the table says:
- Twelve of thirteen up after a year. The Nasdaq was higher 12 months after every midterm except 1986. The spread was wide: from +68.2% (1998–99, the late stage of the dot-com rally) and +58.3% (1990–91) down to +5.4% (2010–11) and the 1986–87 loss.
- The Nasdaq usually beat the S&P 500. Over the 12 months after the vote it was ahead in 11 of 12 midterms since 1978, by an average of 12.8 points and a median of 9.5 points. In 2010–11 the margin was less than a point; in 1998–99 it was 46.3 points.
- The first month was ordinary. The Nasdaq was higher one month after the vote 10 times out of 13, with a median of +2.8%. The big gains arrived later: the median was +9.8% at three months and +19.6% at twelve.
- The worst point usually came early. In 8 of the 13 cycles the lowest close of the following 12 months came before the end of the election year, in November or December; in 2002–03 it came in mid-February. Only twice, in 1982 and 1998, did the Nasdaq never close below its pre-election level in the next 12 months. The deepest dip below the pre-vote close was −19.2%, on October 28, 1987.
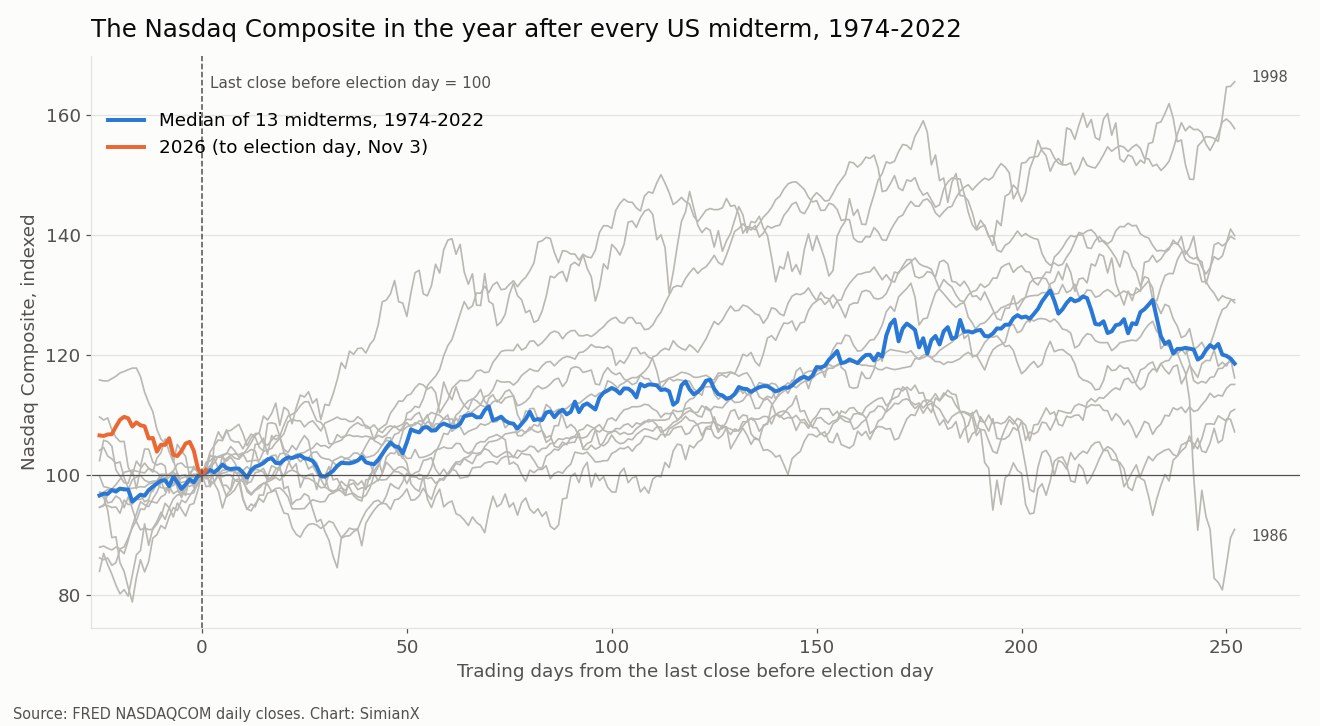
September 30 to June 30: the Nasdaq versus the S&P 500
Our S&P 500 study found that the stretch from the end of September of the midterm year to the end of June of the next year was positive in all 19 cycles since 1950. The same window for the Nasdaq, set against the S&P 500 on the same dates:
| Midterm | Nasdaq, Sep 30 → Jun 30 | S&P 500, Sep 30 → Jun 30 | Nasdaq minus S&P | Nasdaq, Sep 30 → last close before the vote | Lowest Nasdaq close within 12 months (vs pre-vote close) |
|---|---|---|---|---|---|
| 1974–75 | +56.3% | +49.8%¹ | +6.5 pts | +16.1% | −10.5% (Dec 23, 1974) |
| 1978–79 | +3.9% | +0.4% | +3.6 pts | −13.4% | −3.6% (Nov 14, 1978) |
| 1982–83 | +69.8% | +39.6% | +30.2 pts | +14.3% | +3.8% (Nov 3, 1982) |
| 1986–87 | +21.1% | +31.5% | −10.4 pts | +3.0% | −19.2% (Oct 28, 1987) |
| 1990–91 | +38.1% | +21.3% | +16.9 pts | −1.1% | −1.3% (Nov 8, 1990) |
| 1994–95 | +22.1% | +17.7% | +4.4 pts | −0.3% | −5.7% (Dec 9, 1994) |
| 1998–99 | +58.6% | +35.0% | +23.6 pts | +6.3% | +1.3% (Nov 4, 1998) |
| 2002–03 | +38.3% | +19.5% | +18.8 pts | +19.2% | −9.6% (Feb 13, 2003) |
| 2006–07 | +15.3% | +12.5% | +2.7 pts | +4.8% | −1.1% (Mar 5, 2007) |
| 2010–11 | +17.1% | +15.7% | +1.4 pts | +5.8% | −6.7% (Oct 3, 2011) |
| 2014–15 | +11.0% | +4.6% | +6.4 pts | +3.2% | −2.9% (Aug 25, 2015) |
| 2018–19 | −0.5% | +1.0% | −1.5 pts | −8.9% | −15.5% (Dec 24, 2018) |
| 2022–23 | +30.4% | +24.1% | +6.3 pts | −0.1% | −3.3% (Dec 28, 2022) |
| Average | +29.4% | +21.0% | +8.4 pts | −5.7% | |
| Median | +22.1% | +19.5% | +6.3 pts | −3.6% | |
| Higher / Nasdaq ahead | 12 of 13 | 13 of 13 | 11 of 13 | 2 of 13 never closed below | |
| 2026–27 | from 26,861.06 (Sep 30, 2026) | pending | pending | −6.3% | pending |
¹ 1974–75 S&P 500 figure from our S&P 500 midterm study; Cboe's daily S&P 500 file starts in January 1975.
Three readings:
- The Nasdaq did not have a perfect record in this window; the S&P 500 did. The Nasdaq slipped 0.5% in 2018–19, the one cycle in which it fell, while the S&P 500 eked out +1.0%. Everything else was positive, and the best runs were enormous: +69.8% in 1982–83 and +58.6% in 1998–99.
- The Nasdaq's edge over the S&P 500 here was large but uneven. It led in 11 of 13 cycles, by a median of 6.3 points. The average lead of 8.4 points is pulled up by four cycles (1982–83, 1998–99, 2002–03 and 1990–91) in which it led by roughly 17 to 30 points. In six cycles the lead was under five points or negative.
- The two cycles in which the window started badly were the two weakest. In 1978 and 2018 the Nasdaq fell 13.4% and 8.9% between September 30 and the vote, the two deepest pre-election slides in the table, and those are the two cycles with the smallest September → June results (+3.9% and −0.5%). That is mostly arithmetic: the decline sat inside the window. Measured from the pre-election close instead, the following 12 months returned +16.6% (1978–79) and +14.8% (2018–19), close to the median. Two cases are not a pattern.
Is it the midterm, or just the Nasdaq?
The Nasdaq rises in most 12-month periods whether or not there is an election. Since 1971 it was higher 12 months later on 76.5% of all trading days, with an average 12-month gain of +13.2% (median +15.1%). Against that base, 12 of 13 midterms is a good record but not an extraordinary one: if each midterm were an independent draw at the 76.5% base rate, 12 or more rises in 13 tries would happen about 15% of the time. (The windows are not truly independent draws, so treat that figure as a rough yardstick, not a test.) The size of the gains, an average of +25.7% against +13.2%, stands out more than the hit rate.
The September → June window is where the midterm year looks genuinely different. The chart below sorts all 54 September 30 → June 30 windows since 1971 by where they fall in the four-year presidential cycle.
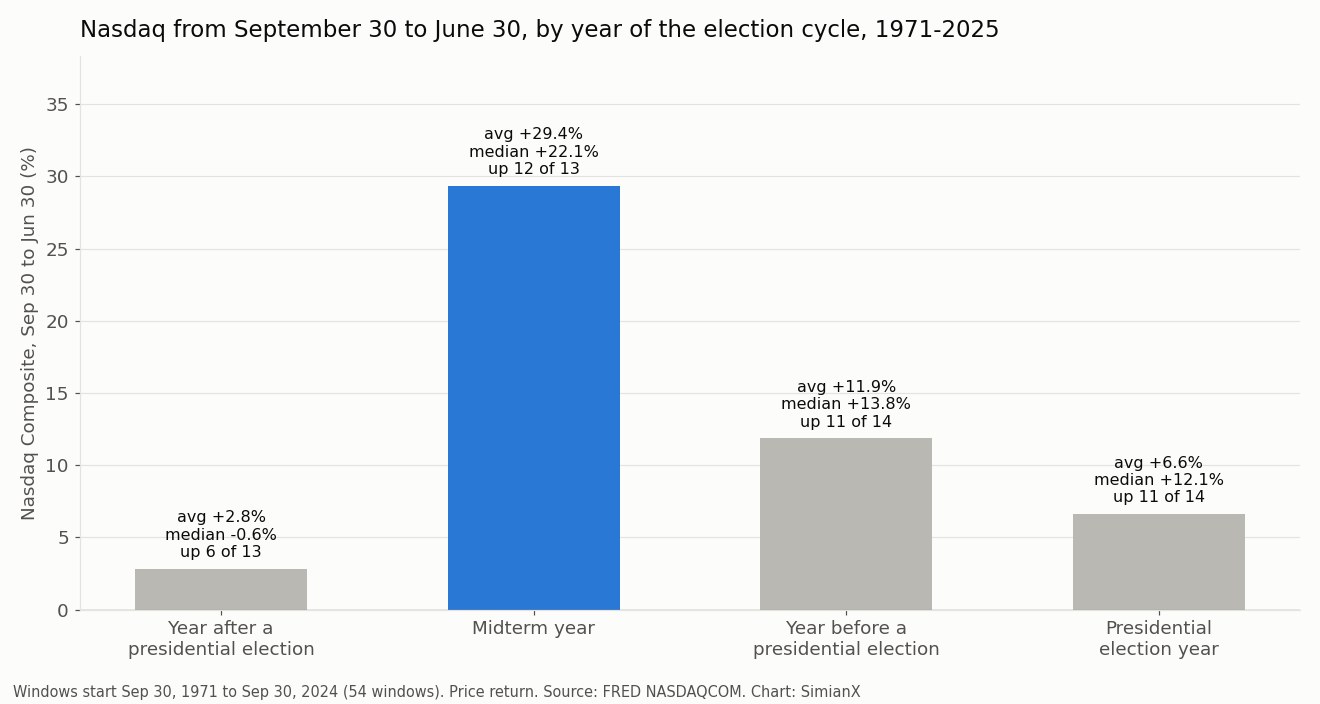
The four-year cycle in Nasdaq terms
| Window starting September 30 of… | Windows | Average | Median | Higher |
|---|---|---|---|---|
| A midterm year | 13 | +29.4% | +22.1% | 12 of 13 |
| The year before a presidential election | 14 | +11.9% | +13.8% | 11 of 14 |
| A presidential election year | 14 | +6.6% | +12.1% | 11 of 14 |
| The year after a presidential election | 13 | +2.8% | −0.6% | 6 of 13 |
| All 41 non-midterm years | 41 | +7.2% | +12.0% | 28 of 41 |
The midterm window's average is about four times the non-midterm average, and its hit rate (12 of 13) compares with 28 of 41 in other years. At the non-midterm hit rate of 68.3%, 12 or more rises in 13 would happen by chance about 5% of the time. That fits the late-midterm-year strength in our presidential cycle study of the S&P 500, in amplified form. Why it happens is debated: the usual explanations are that midterm years often contain a mid-cycle sell-off that sets a low base, that the election removes one layer of policy uncertainty, and that administrations tend to favor growth in the two years before they face voters again. None of these can be proven from 13 observations, and the pattern is old enough that it is widely known.
Election day and the morning after
The vote itself has barely moved the Nasdaq. Measured close to close, the index rose on 9 of 13 election days, by an average of +0.34%. The day after the vote it rose 9 of 13 times, by an average of +0.43% (median +0.18%). The largest day-after moves were +2.6% in 2018 and −2.5% in 2022, and both came with market-wide moves: the S&P 500 rose 2.1% on November 7, 2018 and fell 2.1% on November 9, 2022.
On these two days the Nasdaq showed no edge over the S&P 500 at all. Its election-day and day-after returns minus the S&P 500's averaged −0.01 and −0.02 points, and it was ahead in only 6 of 12 cycles on each day. For context, the Nasdaq rose on 55.8% of all trading days since 1971. Whatever made the Nasdaq outperform after midterms, it did not show up on election night.
When the Nasdaq went into the vote down for the year
Five midterm years had the Nasdaq below its prior year-end close on the eve of the vote: 1974 (−29.9%), 1990 (−25.1%), 1994 (−1.9%), 2002 (−28.4%) and 2022 (−32.5%). In all five the index was higher 12 months later, by an average of +37.1% (from +19.6% to +58.3%). In the eight years it went into the vote up for the year, the 12-month average was +18.6%, and that group contains both the best cycle (1998–99, +68.2%) and the only loss (1986–87). In the four down years since 1978 the Nasdaq also beat the S&P 500 over the next 12 months each time, by 9.7 to 34.4 points.
This is the same "weak years set up the biggest rebounds" pattern our S&P 500 study describes. It is a description of five cases, three of which (1974, 2002 and 2022) came at or near the end of long bear markets. It does not say that a down year causes a rebound.
The exceptions: 1986–87 and 2018–19
1986–87. The Nasdaq went into the November 4, 1986 vote at 361.14, up 11.1% for the year, and was up 11.6% three months later. Then came Black Monday: by October 28, 1987 the index was 19.2% below its pre-election close, and on November 4, 1987 it stood at 320.13, −11.4% for the 12 months. The S&P 500 finished the same 12 months +1.3%. The September → June window, which ended in June 1987, missed the crash and shows +21.1%. The one 12-month loss in the table was caused by a crash that had nothing to do with the election, which is the general lesson of small samples: one event can decide the record.
2018–19. Here the problem came first. The Nasdaq fell 8.9% between September 28 and the November 5, 2018 close, rallied 2.6% the day after the vote, then fell to a low on December 24, 2018 that was 15.5% below its pre-election close. It recovered to finish the 12 months +14.8%, but the September → June window, which started before the October slide, was −0.5%. Our worst-days reference covers what typically follows sell-offs like the one in December 2018.
Where the Nasdaq stands in 2026
The 2026 vote arrived after a sharp autumn pullback:
- Pre-election close: 25,164.36 on Monday, November 2, 2026.
- Year to date: +8.3% from the 2025 year-end close of 23,241.99, the 7th-highest of the 14 midterm years in this study. The S&P 500 was up +10.2% over the same period (7,541.40 against 6,845.50).
- From the record: 8.8% below the record close of 27,599.89 set on October 6, 2026. The year's low close was 20,794.64 on March 30.
- Since September 30: −6.3% from 26,861.06. Only 1978 (−13.4%) and 2018 (−8.9%) had a deeper slide between September 30 and the vote. Over the full September → June window those two produced the weakest results in the table, but measured from the pre-election close their next 12 months were in line with the median. Two cases cannot tell you which of these, if either, applies to 2026.
- Election day: the Nasdaq closed at 25,372.01 on November 3, +0.83% for the session; the S&P 500 rose 0.36%.
The result line at the top of this page gives the outcome: Congress will be split from the White House from January 2027. How markets have behaved under divided and unified government is the subject of our gridlock study. The Nasdaq rows for 2026 will be filled in as each window closes, starting with the November 4 session. Our Nasdaq returns by year table tracks the calendar-year figure, and the October 30 drop is ranked in the Nasdaq's worst days.
What this table can and cannot tell you
- Thirteen is a small number. One crash (1987) supplied the only 12-month loss, and two cycles carry much of the average: without 1990–91 and 1998–99, the 12-month average falls from +25.7% to +18.9%.
- The Nasdaq of 1974 is not the Nasdaq of 2026. In the 1970s and 1980s the Composite was a broad index of smaller over-the-counter companies. Today it is dominated by a handful of very large technology companies, among them Apple, Microsoft, Nvidia, Amazon and Alphabet. The early rows describe a different basket.
- Its outperformance is partly the decades, not the elections. The Nasdaq beat the S&P 500 in most long periods since 1971, as our returns-by-year table shows. The post-midterm lead is larger than its typical lead, but you cannot cleanly separate the two with 12 observations.
- Price only. Both indexes are shown without dividends. The S&P 500 has generally paid a higher dividend yield than the Nasdaq Composite, so on a total-return basis the Nasdaq's lead would be somewhat smaller.
- No forecast. Nothing here says what the Nasdaq will do after November 3, 2026. The table records what happened.
Related midterm data on SimianX
The Nasdaq's tilt toward technology is why its post-midterm record looks like a magnified S&P 500. Our sector scoreboard after midterms shows technology beat the market after most midterms since 1926. Two other spokes ask the same question for different corners of the market: small caps versus large caps after midterms and Treasury yields and the dollar after midterms. For banks, see bank stocks after midterm elections, and for the other half of the election cycle, the S&P 500 in presidential election years.
To follow the Nasdaq-100 in real time after the vote, you can run a live AI analysis of QQQ, the exchange-traded fund that tracks the Nasdaq-100, the 100 largest non-financial companies listed on the Nasdaq Stock Market.
FAQ
How does the Nasdaq do after midterm elections?
Since 1974 the Nasdaq Composite was higher 12 months after 12 of 13 midterms, with an average gain of +25.7% and a median of +19.6%, measured from the last close before election day. The only loss was 1986–87 (−11.4%), caused by the October 1987 crash.
Does the Nasdaq beat the S&P 500 after midterms?
Usually. Over the 12 months after the vote, the Nasdaq beat the S&P 500 in 11 of 12 midterms since 1978, by a median of 9.5 percentage points. From September 30 to June 30 it was ahead in 11 of 13 cycles since 1974.
What does the Nasdaq do the day after a midterm election?
Not much. It rose the day after 9 of 13 midterms, with a median move of +0.18%. The largest moves were +2.6% in 2018 and −2.5% in 2022. On election day and the day after, it showed no edge over the S&P 500.
Is the post-midterm rally stronger for the Nasdaq than for the S&P 500?
In size, yes: from September 30 to June 30 the Nasdaq averaged +29.4% after midterms against +21.0% for the S&P 500. In consistency, no: the S&P 500 rose in all 13 of those windows; the Nasdaq fell once, by 0.5% in 2018–19.
What was the Nasdaq's best year after a midterm?
1998–99: +68.2% in the 12 months after the November 3, 1998 vote, and +58.6% from September 30, 1998 to June 30, 1999. Over the September → June window the best run was 1982–83, at +69.8%.
Where was the Nasdaq before the 2026 midterm election?
It closed at 25,164.36 on Monday, November 2, 2026, up 8.3% for the year, 6.3% below its September 30 close and 8.8% below its October 6 record of 27,599.89. On election day it closed at 25,372.01.
Does a bad year for the Nasdaq before a midterm mean a rally after?
In the five midterm years when the Nasdaq went into the vote down for the year (1974, 1990, 1994, 2002 and 2022), it was higher 12 months later every time, by an average of +37.1%. Five cases are a small sample, and three of them came at or near the end of long bear markets.
Related reading
- Stock Market After Midterm Elections: Every Cycle 1950–2026
- Nasdaq Returns by Year: Every Year 1972–2026 Table
- Nasdaq's Worst Days: Every Major Drop and What Came Next
- Best Sectors After Midterm Elections: 100 Years of Data
- Is Gridlock Good for Stocks? 49 Congresses, 1927-2025
- Do Small Caps Beat Large Caps After Midterms? 1926-2022
- Treasury Yields and the Dollar After Midterms, 1962-2022
- Bank Stocks After Midterm Elections: 25 Midterms, 1926-2022
- Presidential Cycle: S&P 500 Returns by Term Year, 1928–2025
Sources
- FRED: NASDAQ Composite Index (NASDAQCOM)
- FRED: S&P 500 (SP500)
- Cboe: S&P 500 Index (SPX) overview
- Nasdaq: Nasdaq Composite Index
- Wikipedia: Election Day in the United States
- Wikipedia: Black Monday (1987)
This page is a historical reference, not investment advice. Past patterns across 13 midterm elections do not predict future results.