
 By Marcus Reeve
The VIX Around Every US Midterm Election Since 1990
Data through the November 3, 2026 close. Every figure below is recomputed from Cboe's official daily VIX history and cross-checked against the Federal Reserve Bank of St. Louis copy of the same series.
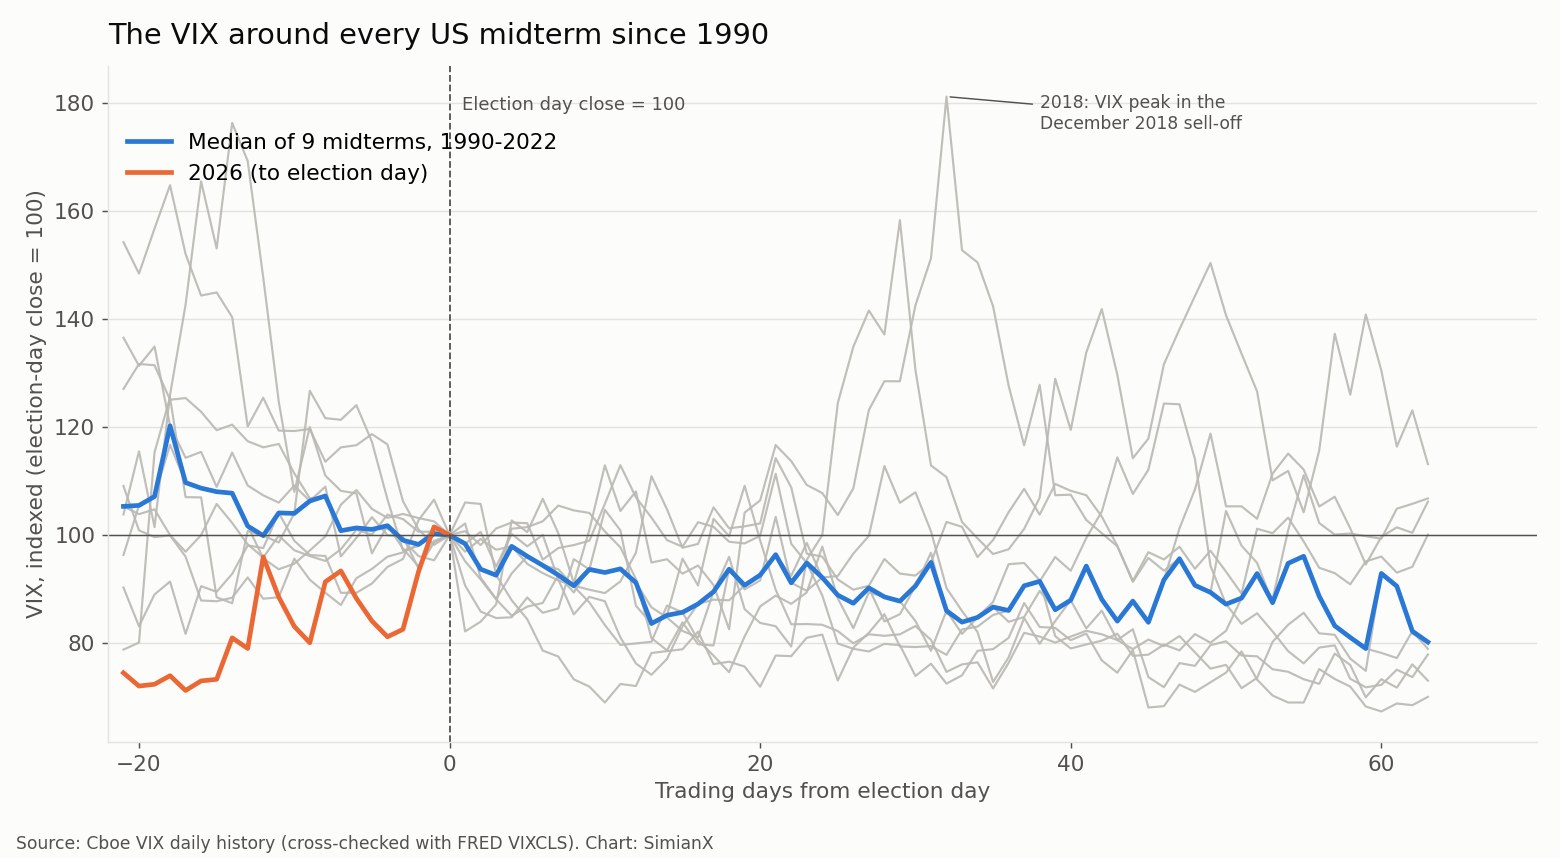
Quick answer: In the nine midterm elections since the VIX begins in 1990, the "volatility crush" after the vote was real but unreliable. Measured from the election-day close, the VIX was lower the next day after 6 of 9 midterms (median −1.6%), lower one month later after only 5 of 9 (median −3.6%, about what any random month shows), and lower three months later after 6 of 9 (median −19.8%). Presidential elections are different: the VIX rose into election day in 8 of 9 cases and was lower three months later in 8 of 9. In 2026 the VIX closed at 21.15 on Monday, November 2, the day before the vote, and at 20.83 on election day, after a +36.1% climb over the prior month: the largest run-up into any midterm in the data.
Result (as of 1:50 a.m. ET, November 4, 2026): Democrats won control of both the Senate and the House, calls made by AP and NBC News. By AP's count at 1:30 a.m. ET, Democrats had flipped seven Republican-held Senate seats and 16 House seats. Congress will be split from the White House from January 3, 2027.
Every election season brings the same claim: uncertainty pushes the Cboe Volatility Index (VIX) up before the vote, and once the result is known the uncertainty disappears and the VIX "gets crushed." Our stock market after midterm elections reference covers what the S&P 500 did in every cycle, and every VIX spike since 1990 covers the big fear episodes. This page answers a narrower question that neither covers: what does the VIX itself do around a US midterm election?
The short version is that the midterm crush is mostly folklore at the one-month horizon, and the three-month decline that does show up looks more like ordinary mean reversion from an elevated starting level than an election effect. The details matter, so here is the full table.
How the numbers were built
- Index: the Cboe Volatility Index (VIX), daily closes from Cboe's public delayed-quotes history, which begins on January 2, 1990. Every close was compared with FRED series VIXCLS: the two files agree on all 9,308 trading days.
- Midterms covered: 1990, 1994, 1998, 2002, 2006, 2010, 2014, 2018 and 2022. That is nine elections, which is a small sample. Read every count below as a description of what happened, not a probability.
- Election day: the first Tuesday after the first Monday in November. US stock and options markets were open on every one of these election days.
- Windows: the "pre-vote" level is the last close before election day (the Monday). The run-up is the change from the last close on or before the same date one month earlier to the election-day close. The next-day, one-month and three-month changes are measured from the election-day close, to the next trading day and to the last close on or before the same calendar date one and three months later.
- Comparison years: the same calendar windows in the nine presidential election years from 1992 to 2024 and in the 18 odd-numbered years from 1991 to 2025, when there is no federal election in November.
- Base rates: for context, the share of all VIX trading days since 1990 on which the index was lower one day, one month and three months later.
VIX changes are shown in percent. A VIX move from 20 to 18 is −10%, or −2 points.
The VIX around every midterm, 1990–2022: the reference table
| Midterm (election day) | VIX, last close before vote | Election-day close | Run-up, prior month | Next day | +1 month | +3 months |
|---|---|---|---|---|---|---|
| Nov 6, 1990 | 29.85 | 29.11 | +4.5% | +6.0% | −22.3% | −22.1% |
| Nov 8, 1994 | 17.37 | 16.30 | +9.2% | +0.7% | +11.3% | −29.9% |
| Nov 3, 1998 | 27.26 | 27.76 | −31.4% | −1.4% | +3.4% | +0.4% |
| Nov 5, 2002 | 30.82 | 31.23 | −20.9% | −1.6% | −3.6% | +5.8% |
| Nov 7, 2006 | 11.16 | 11.09 | −4.1% | −3.1% | +14.2% | −6.9% |
| Nov 2, 2010 | 21.83 | 21.57 | −4.1% | −9.3% | −10.1% | −19.8% |
| Nov 4, 2014 | 14.73 | 14.89 | +2.3% | −4.8% | −16.9% | +23.1% |
| Nov 6, 2018 | 19.96 | 19.91 | +34.3% | −17.8% | +6.4% | −22.8% |
| Nov 8, 2022 | 24.35 | 25.54 | −18.6% | +2.2% | −12.7% | −23.1% |
| Median, 1990–2022 | 21.83 | 21.57 | −4.1% | −1.6% | −3.6% | −19.8% |
| VIX lower in | 5 of 9 | 6 of 9 | 5 of 9 | 6 of 9 | ||
| Nov 3, 2026 | 21.15 | 20.83 | +36.1% | Nov 4, 2026: to be added after the close | pending | pending |
The run-up column measures the month before the vote (for example, 1990 runs from the October 5, 1990 close of 27.85 to the election-day close of 29.11). In 2026 the run-up starts from the October 2 close of 15.31.
The second table shows where the VIX actually ended up, how high it went in the three months after the vote, and what the S&P 500 index did over the same three months.
| Midterm | VIX +1 month | VIX +3 months | Highest close within 3 months (date) | Lowest close within 3 months | S&P 500, +3 months |
|---|---|---|---|---|---|
| 1990 | 22.62 | 22.68 | 36.20 (Jan 14, 1991) | 20.09 | +14.9% |
| 1994 | 18.15 | 11.42 | 18.41 (Nov 23, 1994) | 10.98 | +3.3% |
| 1998 | 28.70 | 27.88 | 32.98 (Jan 14, 1999) | 20.21 | +14.5% |
| 2002 | 30.10 | 33.04 | 34.69 (Jan 27, 2003) | 23.16 | −7.8% |
| 2006 | 12.67 | 10.32 | 12.67 (Dec 7, 2006) | 9.89 | +4.9% |
| 2010 | 19.39 | 17.30 | 23.54 (Nov 30, 2010) | 15.45 | +9.3% |
| 2014 | 12.38 | 18.33 | 23.57 (Dec 16, 2014) | 11.82 | +1.5% |
| 2018 | 21.19 | 15.38 | 36.07 (Dec 24, 2018) | 15.38 | −0.9% |
| 2022 | 22.29 | 19.63 | 26.09 (Nov 9, 2022) | 17.87 | +7.6% |
The S&P 500 column is the price index from the election-day close, without dividends; for the full stock-market picture see our S&P 500 midterm reference.
The "volatility crush" scorecard
Pull the counts together and the midterm crush looks much weaker than its reputation.
| Window (from election-day close) | VIX lower after | Median change | Median change, points | All trading days since 1990: share lower |
|---|---|---|---|---|
| Next trading day | 6 of 9 | −1.6% | −0.39 | 52.9% |
| +1 month | 5 of 9 | −3.6% | −1.13 | 55.1% |
| +3 months | 6 of 9 | −19.8% | −4.27 | 56.0% |
| +12 months | 6 of 9 | −25.4% | −4.60 | — |
Three things stand out.
The morning after is usually calmer, but not dramatically. Six of nine next-day moves were declines, but the median was only −1.6%, and the two largest drops came with other news. In 2018 the VIX fell 17.8% the day after the vote; in 2010 it fell 9.3% on November 3, the same day the Federal Reserve announced its second round of bond buying. In 1990 and 2022 the VIX rose the next day.
One month later, the midterm record is a coin flip. The VIX was lower after five of nine midterms. Over all trading days since 1990, the VIX was lower one month later 55.1% of the time, with a median change of −2.1%. The midterm median of −3.6% is not meaningfully different from that, and four of the nine midterms (1994, 1998, 2006 and 2018) saw the VIX higher a month after the vote.
The three-month decline is real but small-sample and level-driven. Six of nine midterms saw a lower VIX three months out, with a median drop of almost 20%. But three of those six started from a VIX at or above 20, where declines are the norm in any season (see below), 1998 was flat (+0.4%), and 2002 and 2014 went the other way, with the VIX higher in late January and early February as the Iraq war approached and after the late-2014 oil collapse.
Midterms vs presidential elections vs years with no vote
The cleanest test of an "election effect" is to run the identical calendar windows in years with a different kind of November, or none at all.
| November type | Cases | Median VIX on election day | Run-up rose in | VIX lower next day | Lower +1 month | Lower +3 months | Median +3 months |
|---|---|---|---|---|---|---|---|
| Midterm years, 1990–2022 | 9 | 21.57 | 4 of 9 | 6 of 9 | 5 of 9 | 6 of 9 | −19.8% |
| Presidential years, 1992–2024 | 9 | 18.74 | 8 of 9 | 6 of 9 | 6 of 9 | 8 of 9 | −23.7% |
| Odd years (no federal vote), 1991–2025 | 18 | 16.26 | 6 of 18 | 11 of 18 | 10 of 18 | 8 of 18 | +4.0% |
In the odd-year rows, "election day" is simply the first Tuesday after the first Monday in November, the same calendar position.
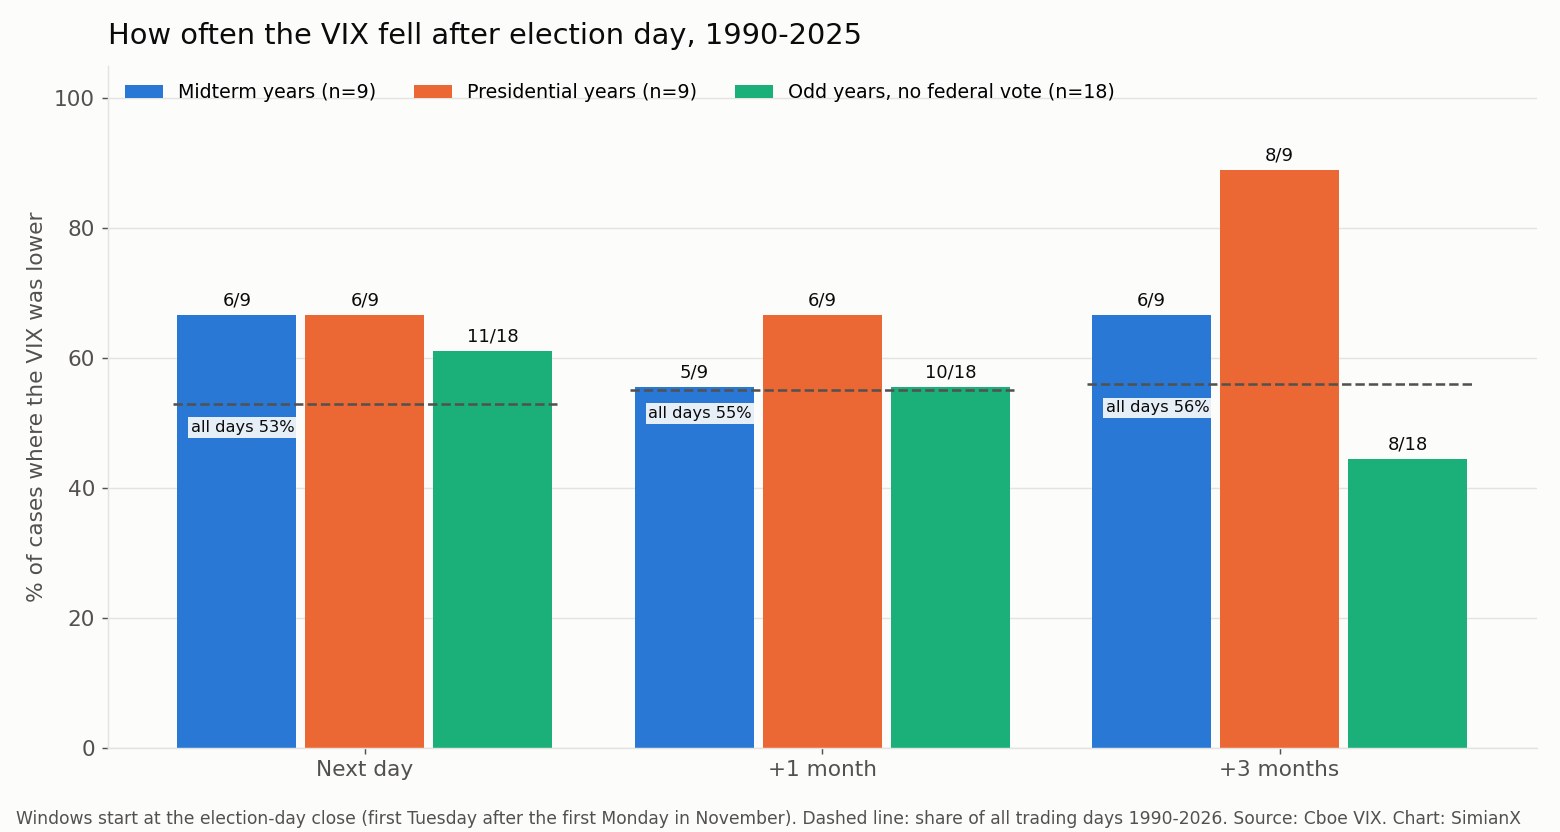
The pattern that the "volatility crush" story describes exists, but it belongs to presidential elections. In presidential years the VIX climbed into election day in eight of nine cases (median +19.3% over the month), then fell: one month later it was lower in six of nine years with a median of −19.8%, and three months later in eight of nine. The 2016, 2020 and 2024 elections each saw the VIX lose roughly a third of its value within a month (−32.6%, −40.1% and −33.9%). The one presidential year when the VIX was higher three months out, 1996, started from a calm 17.65.
Midterms usually do not build that kind of election premium. The VIX fell over the month before the vote in five of nine midterms, with a median run-up of −4.1%, so there was typically less to release afterward. Years with no federal vote show no November pattern at all: the VIX was higher three months later in 10 of 18 odd years, often because it started near its lows.
Why the starting level matters more than the calendar
The VIX tends to drift back toward its long-run middle (the median close since 1990 is 17.56). When it starts high it usually falls; when it starts low it often rises. Splitting the nine midterms by the pre-vote level makes the point:
| Pre-vote VIX | Midterms | VIX lower one month later |
|---|---|---|
| 20 or higher | 1990, 1998, 2002, 2010, 2022 | 4 of 5 (1998 the exception, +3.4%) |
| Below 20 | 1994, 2006, 2014, 2018 | 1 of 4 (2014, −16.9%) |
That split is almost exactly what the base rate predicts. Across all trading days since 1990 when the VIX started at 20 or above, it was lower one month later 66.9% of the time, with a median change of −8.3%. With only nine elections, it is not possible to separate an election effect from that ordinary mean reversion, and the data give no strong reason to think one exists for midterms.
The 2026 run-up: the largest into any midterm
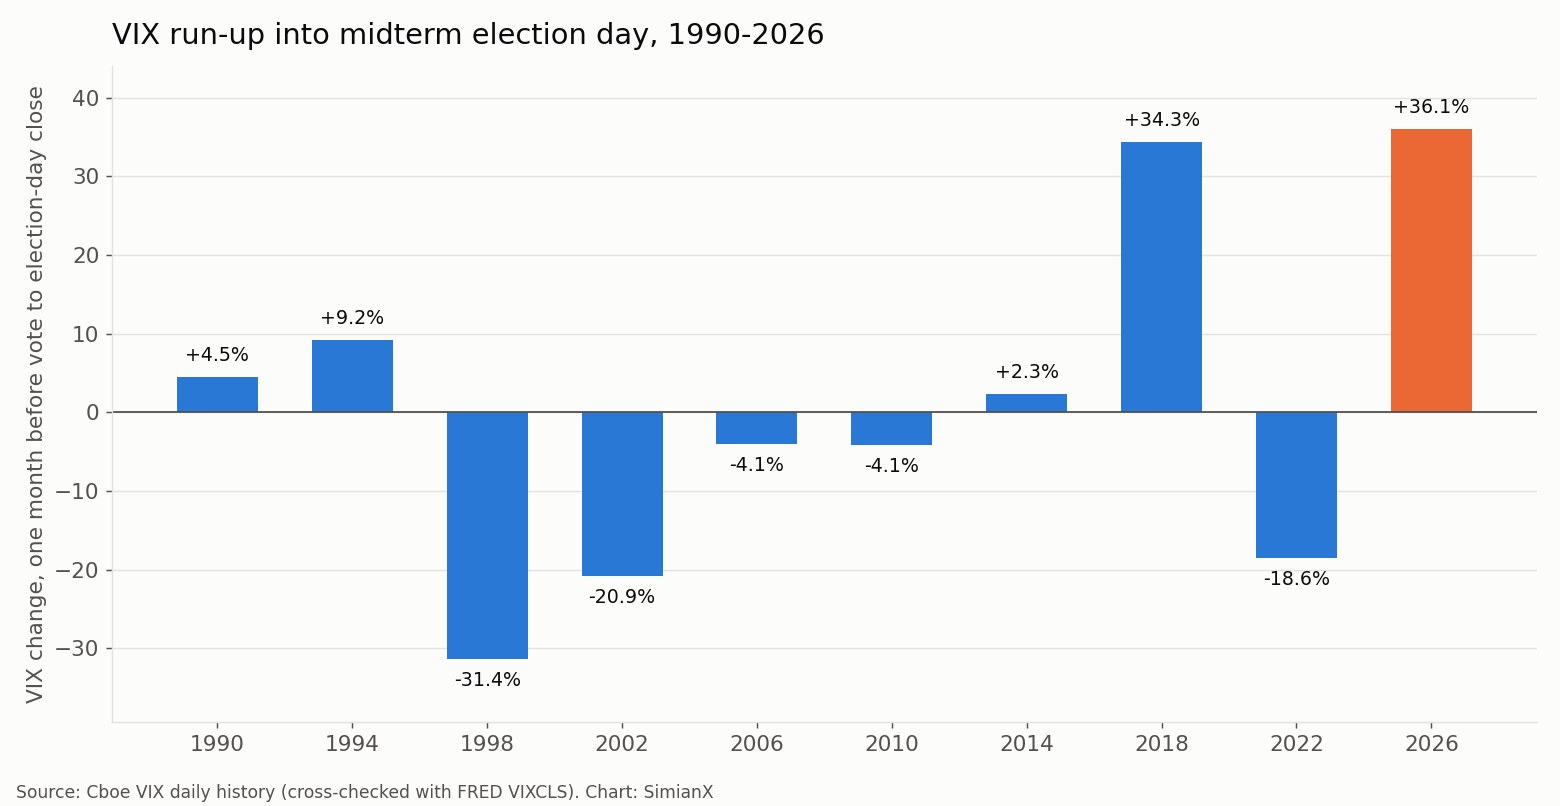
The 2026 cycle broke the midterm habit. The VIX closed at 15.31 on October 2, 2026, and at 20.83 on election day, a +36.1% rise that is the largest run-up into a midterm since the VIX begins. The Monday close of 21.15 was the highest since June 10, 2026 (22.22) and the highest close of the three months before the vote; only 1994 shares that feature.
The only comparable run-up is 2018 (+34.3%), when the VIX went from 14.82 in early October to 19.91 on election day during the October 2018 sell-off. What happened next is a useful warning against reading too much into the first day. The VIX fell 17.8% the morning after the 2018 vote, the biggest next-day drop of any midterm. One month later it was 6.4% higher, and on December 24, 2018 it closed at 36.07, almost double the election-day level. Three months out, in early February 2019, it was 22.8% lower than on election day. All three statements are true of the same election.
So the 2026 setup looks more like a typical presidential year (a VIX that rose into the vote) than a typical midterm. In level terms, though, 2026 sits in the middle: a pre-vote close of 21.15 ranks sixth of the ten midterm pre-vote levels since 1990, just below 2010 (21.83) and above 2018 (19.96). It is above 68.5% of all VIX closes since 1990 but well below the high-anxiety midterms of 1990 (29.85) and 2002 (30.82). The 2026 high so far is 31.05 (March 27) and the low is 14.21 (September 22).
None of this is a forecast. With nine prior midterms, two of which had large run-ups, the history cannot say what the VIX will do after November 3, 2026.
Midterm by midterm
- 1990. The VIX was already near 30 before the vote, with the US in recession and troops deploying to the Gulf. It fell to 22.62 within a month, then jumped to 36.20 on January 14, 1991, the day before the UN deadline for Iraq to leave Kuwait.
- 1994. A calm VIX (16.30 on election day) rose 11.3% over the next month, a stretch that included the Federal Reserve's 0.75-point rate increase on November 15, 1994, then fell to 11.42 by February 1995.
- 1998. The VIX had peaked in early October 1998 during the Russia default and LTCM crisis and was down 31.4% by election day. It then went nowhere: +3.4% after a month, +0.4% after three, with a January 1999 high of 32.98.
- 2002. The bear market had just bottomed in October 2002 and the VIX was 31.23 on election day, the highest of any midterm. The Fed cut rates the next day. The VIX drifted down only 3.6% in a month and was 5.8% higher by early February 2003, as war with Iraq approached.
- 2006. The quietest midterm in the data: an 11.09 VIX on election day, a 14.2% rise to 12.67 a month later (still very low), and 10.32 by February 2007.
- 2010. A 9.3% drop the day after the vote coincided with the Fed's QE2 announcement. The VIX touched 23.54 on November 30 during the euro-area debt crisis, then fell to 17.30 by February 2011.
- 2014. A one-month decline of 16.9% reversed into a 23.1% three-month rise as oil prices collapsed, with the VIX closing at 23.57 on December 16, 2014.
- 2018. The biggest pre-vote run-up before 2026 and the biggest next-day drop, followed by the December 2018 sell-off and a 36.07 close on Christmas Eve.
- 2022. The VIX rose 2.2% the day after the vote to 26.09, its high for the next three months, then fell steadily to 19.63 by February 2023.
Before 1990: the 1986 midterm and the old VXO
Cboe's current VIX method starts in 1990, so the 1986 midterm is not in the main table. Cboe's original volatility index, now called VXO, was calculated from S&P 100 options and has data back to 1986. Cboe's own delayed-history endpoint serves VXO only from January 29, 1993, so the 1986 figures here come from FRED series VXOCLS, which starts on January 2, 1986. VXO and VIX are different indexes (VXO closed at 34.28 on the 2002 election day against the VIX's 31.23), so the 1986 row is shown separately and is not included in any count above.
| Midterm | VXO, last close before vote | Election-day close | Run-up, prior month | Next day | +1 month | +3 months |
|---|---|---|---|---|---|---|
| Nov 4, 1986 (VXO) | 18.57 | 18.71 | −27.8% | −1.9% | +9.1% | +24.7% |
Like most low-starting midterms, 1986 saw volatility rise over the following three months.
What this table does not tell you
- Nine is a small sample. A single different outcome would move the one-month count from 5 of 9 to 4 or 6 of 9. Nothing here is statistically robust.
- The VIX measures expected S&P 500 volatility over the next 30 days, priced from options. It is not a measure of election risk alone; Fed meetings, inflation reports and geopolitical events in November and December drove several of the moves in the table.
- Percent changes exaggerate moves from a low base. A rise from 11 to 12.7, as in 2006, is +14.2% but still a very calm market. The points column in the scorecard is there for that reason.
- The VIX is not directly investable. VIX futures and VIX-linked exchange-traded products behave differently from the spot index shown here, especially over months.
How to use this table
- To check whether a post-election VIX drop is unusual, compare it with the next-day column: anything larger than the 17.8% drop of 2018 would be a midterm first.
- To judge how much "election premium" there was, use the run-up column; in midterms it has usually been small or negative.
- To put a VIX level in context, compare it with the pre-vote column and the long-run median of 17.56; for genuine fear episodes, see every VIX spike since 1990.
- For what happened to stocks in the same windows, see the S&P 500 midterm reference, sector returns after midterms and divided vs unified government. For rates and the currency, see Treasury yields and the dollar after midterms.
To watch the S&P 500 in real time after the vote, you can run a live AI analysis of SPY, the exchange-traded fund that tracks the index the VIX is built on.
FAQ
Does the VIX drop after midterm elections?
Sometimes. Since 1990 the VIX was lower the day after a midterm in 6 of 9 cases (median −1.6%), lower one month later in 5 of 9 (median −3.6%) and lower three months later in 6 of 9 (median −19.8%). The one-month record is no better than an ordinary month.
What is the "volatility crush" after an election?
It is the idea that the VIX falls sharply once the uncertainty of the vote is resolved. The data support it much more for presidential elections (VIX lower three months later in 8 of 9 since 1992) than for midterms.
Does the VIX rise before a midterm election?
Usually not. It rose over the month before the vote in only 4 of 9 midterms since 1990; the median change was −4.1%. In presidential years it rose in 8 of 9.
What was the VIX before the 2026 midterm?
It closed at 21.15 on Monday, November 2, 2026, and at 20.83 on election day, November 3, up 36.1% from 15.31 on October 2, the largest run-up into any midterm since 1990.
What was the biggest VIX drop after a midterm?
The 17.8% fall on November 7, 2018, the day after the 2018 vote. One month later the VIX was higher than on election day.
Which midterm had the highest VIX?
2002: 30.82 at the last close before the vote and 31.23 on election day, just after the October 2002 bear-market low.
Is there VIX data before 1990?
Not for the current VIX. The older VXO index has data from 1986 via FRED; Cboe's delayed-history file for VXO starts in 1993.
Related reading
- VIX Spikes History: Every Major Volatility Spike Since 1990
- Stock Market After Midterm Elections: Every Cycle 1950–2026
- Is Gridlock Good for Stocks? 49 Congresses, 1927-2025
- Best Sectors After Midterm Elections: 100 Years of Data
- Treasury Yields and the Dollar After Midterms, 1962-2022
- Do Small Caps Beat Large Caps After Midterms? 1926-2022
- Bank Stocks After Midterm Elections: 25 Midterms, 1926-2022
- S&P 500 in Presidential Election Years: 1928-2024 Data
- Presidential Cycle: S&P 500 Returns by Term Year, 1928–2025
Sources
- Cboe: VIX historical data
- Cboe: VIX index overview
- FRED: CBOE Volatility Index: VIX (VIXCLS)
- FRED: CBOE S&P 100 Volatility Index: VXO (VXOCLS)
- Wikipedia: Election Day in the United States
This page is a historical reference, not investment advice. Past patterns across nine midterm elections do not predict future results.