
From Radio Stocks to GPUs: Nine Manias, One Reference Table
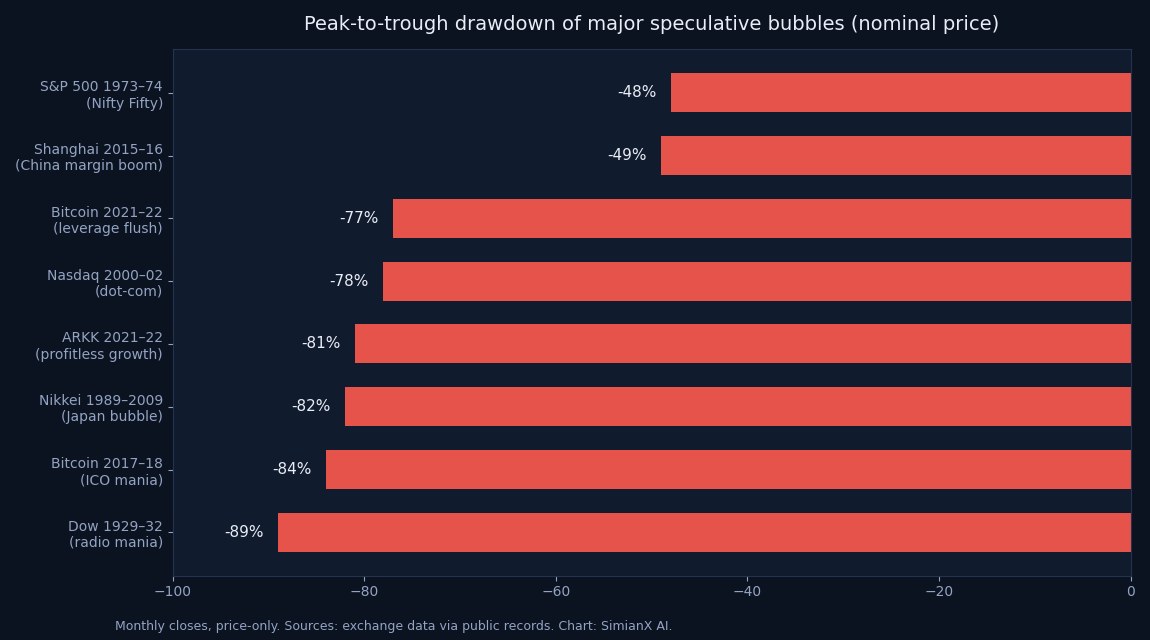
"Are we in an AI bubble?" is one of the most-searched market questions of 2026 — and almost every answer you will find is an opinion. This page takes a different approach. It is a reference asset: a complete, dated table of every major speculative bubble since 1929, what inflated it, how far it fell, and how long the recovery took, followed by a metric-by-metric comparison with the 2026 AI cycle.
Bookmark it, cite it, and check the numbers yourself — the methodology is disclosed at the bottom of the table.
The Master Table: Eight Completed Bubbles and One Open Question
The table below covers the eight completed manias that professional investors cite most often, measured in nominal price terms. The ninth episode — the AI infrastructure cycle running since 2023 — is listed as an open question, not a verdict.
| Bubble | Index / asset | Peak date | Peak-to-trough | Trough date | Years to reclaim peak |
|---|---|---|---|---|---|
| Radio & utilities mania | Dow Jones Industrial Average | Sep 3, 1929 (381.17) | −89% | Jul 8, 1932 (41.22) | 25.2 (Nov 1954) |
| Nifty Fifty | S&P 500 | Jan 11, 1973 (120.24) | −48% | Oct 3, 1974 (62.28) | 7.5 (Jul 1980) |
| Japan asset bubble | Nikkei 225 | Dec 29, 1989 (38,915.87) | −82% | Mar 10, 2009 (7,054.98) | 34.2 (Feb 2024) |
| Dot-com bubble | Nasdaq Composite | Mar 10, 2000 (5,048.62) | −78% | Oct 9, 2002 (1,114.11) | 15.1 (Apr 2015) |
| China margin boom | Shanghai Composite | Jun 12, 2015 (5,178.19) | −49% | Jan 28, 2016 (~2,655) | 11+ (unrecovered, 2026) |
| Crypto ICO mania | Bitcoin | Dec 17, 2017 (~$19,700) | −84% | Dec 15, 2018 (~$3,200) | 3.0 (Nov 2020) |
| Profitless growth | ARK Innovation ETF (ARKK) | Feb 16, 2021 ($159.70) | −81% | Dec 2022 (~$29.4) | 5+ (unrecovered, 2026) |
| Crypto leverage cycle | Bitcoin | Nov 10, 2021 (~$69,000) | −77% | Nov 21, 2022 (~$15,760) | 2.3 (Mar 2024) |
| AI infrastructure cycle | Mag-7 / SOX / Nasdaq | 2023–2026, ongoing | open | open | open |
Methodology: daily closing prices, nominal terms, dividends excluded. "Years to reclaim peak" is the time to the first close above the prior peak. Figures compiled July 2026 from public exchange records; unrecovered episodes are marked against the mid-2026 tape.
Three numbers deserve a second look. The median completed drawdown across these eight episodes is about −80%. The median time to reclaim the prior peak — counting only the six completed recoveries — is roughly 11 years. And the two fastest recoveries on the list are both Bitcoin cycles, which is one reason crypto investors and equity investors talk past each other about what a "crash" means.
The Five Stages Every Bubble Follows
Economists Hyman Minsky and Charles Kindleberger described a repeating sequence that fits every row of the table above — the framework Investopedia summarizes as the five steps of a bubble:
- Displacement. A genuine innovation changes expectations: radio broadcasting in the 1920s, the internet in the 1990s, blockchains in the 2010s, generative AI after 2022.
- Boom. Prices rise, credit expands, and early skeptics start to capitulate.
- Euphoria. Valuation stops referencing cash flow. In 1929, Radio Corporation of America traded at roughly 73× earnings and never paid a dividend; in 1999, dot-coms with no revenue IPO'd at billion-dollar valuations; in 2021, an index of unprofitable growth stocks became a top-selling ETF.
- Distress. Insiders and early money quietly exit while the narrative is still intact. Breadth narrows — fewer and fewer names hold the index up.
- Panic. A trigger — usually tightening credit or a demand disappointment — forces leveraged holders to sell, and the decline feeds on itself.
The stages matter because the trigger is almost never the technology failing. The internet delivered everything the 1999 bulls promised; the Nasdaq still fell 78%. The technology being real and the price being wrong are fully compatible — that is the single most important lesson of the table.
Case Notes: What Inflated, and What Popped
1929 — Radio, utilities, and 10% margin
The Dow rose roughly 345% from its 1921 low to September 1929, powered by electrification, radio, and stock purchases financed with as little as 10% down. The Federal Reserve's 1928–29 tightening and the August 1929 discount-rate hike drained the credit that margin buying depended on. The Dow needed 25 years to see 381 again.
1972 — The Nifty Fifty
Institutional money crowded into roughly fifty "one-decision" growth stocks — buy and never sell — at an average of about 42× earnings. The 1973 oil embargo and double-digit inflation repriced everything; the S&P 500 halved. Most of the fifty were excellent businesses. The lesson was price, not quality.
1989 — Japan
At the peak, the grounds of the Imperial Palace in Tokyo were said to be worth more than all the real estate in California, and the Nikkei traded near 60× earnings. The Bank of Japan's rate hikes and lending curbs in 1989–90 ended it. The 34-year recovery — completed only in February 2024 — is the strongest historical argument against "it always comes back quickly."
2000 — Dot-com and the telecom capex bust
The Nasdaq rose almost fivefold in five years and peaked at over 100× forward earnings for its largest names. What actually broke first was infrastructure spending: telecom carriers had borrowed heavily to lay fiber for demand that arrived years later than projected. When funding dried up, equipment orders collapsed, and the supposedly safe "picks and shovels" names fell hardest. Anyone comparing today's data-center buildout to 1999 is really asking whether AI capex repeats the fiber overbuild — the exact question our earnings-season coverage tracks company by company for Amazon, Microsoft, and Alphabet.
2015 — China's margin boom
The Shanghai Composite rose about 150% in a year as retail margin accounts multiplied; a regulatory crackdown on that leverage reversed it just as fast. A decade later the index had still not seen 5,178 again — a reminder that "unrecovered" is a live category, not a museum piece.
2017 and 2021 — Two crypto cycles
Bitcoin fell 84% after the ICO mania and 77% after the 2021 leverage cycle — and both times reclaimed its prior peak in about three years or less, faster than any equity episode in the table. The 2021 unwind was amplified by collapsing intermediaries (Terra, FTX) rather than by the asset's own protocol failing. Cycle structure, not headlines, is the useful frame — the same one we use in Bitcoin Halving Cycles 2012–2028.
2021 — Profitless growth
The clearest recent example of euphoria detaching from cash flow: ARKK, the flagship fund of the theme, rose about 360% from its March 2020 low to February 2021, then gave back 81% when the Fed's 2022 hiking cycle repriced long-duration cash flows — the mechanics we tabulated in Every Fed Rate-Hike Cycle Since 1983.
How Long Recovery Really Takes
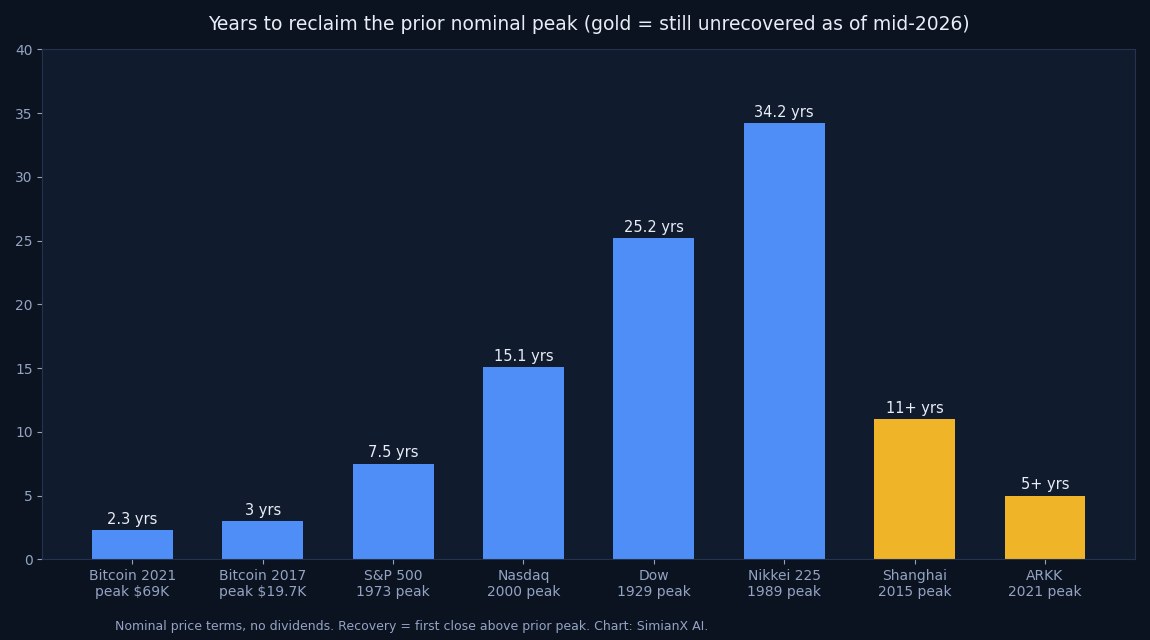
The recovery column is the part of the table most investors have never seen in one place. Six completed recoveries range from 2.3 years (Bitcoin, 2021 cycle) to 34.2 years (Nikkei), with the equity episodes clustered between 7.5 and 25 years. Two episodes — Shanghai 2015 and ARKK 2021 — remain unrecovered in mid-2026.
Three caveats keep the column honest. These are nominal figures: adjusted for inflation, the Dow's 1929 recovery stretches into the late 1950s and the Nifty Fifty recovery into the mid-1980s. They exclude dividends, which shorten real-world recovery for income-paying indices. And they measure indices, not companies — many individual names never recovered at all. For the S&P-specific version of this analysis, see How Long Every Bear Market Took to Recover and the master list in Every S&P 500 Bear Market Since 1929.
The 2026 AI Cycle: Scoring It Against History
So where does the AI cycle sit? Here is the honest, metric-by-metric answer as of July 2026.
| Metric | Dot-com 2000 | AI cycle 2026 | Reads as |
|---|---|---|---|
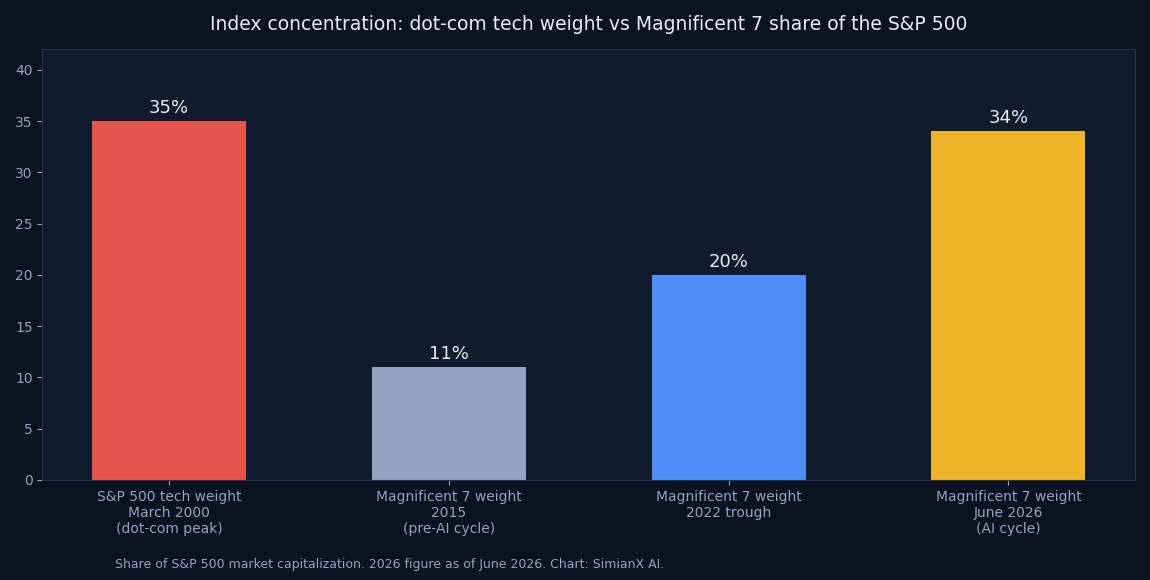
| Index concentration | Tech ≈ 35% of S&P 500 | Magnificent 7 ≈ 34% of S&P 500 | Rhymes |
| Profitability of leaders | Many leaders pre-revenue | Mag-7 heavily cash-generative | Differs |
| Capex funding | Debt- and equity-funded fiber | Mostly operating-cash-flow-funded data centers | Differs, with exceptions |
| Valuation of leaders | 100×+ forward earnings | Elevated, but far below 2000 extremes | Partial rhyme |
| Monetary backdrop | Fed hiking 1999–2000 | Fed hiking under Warsh in 2026 | Rhymes |
| Breadth & momentum | Narrow, then unwound | Narrow; momentum unwind episodes already in 2026 | Rhymes |
The concentration parallel is real: the Magnificent 7 hold roughly 34% of the S&P 500, almost exactly the tech sector's share at the March 2000 peak. The monetary backdrop rhymes too — the Fed's 2026 shift toward hiking is precisely the classic stage-five trigger. And the market has already rehearsed the failure mode: the semiconductor momentum unwind, the KOSPI's AI-chip reckoning, and a visible short case against Micron all happened inside twelve months. History says semiconductor bear markets are not rare events — the median completed SOX bear fell 38%.
The differences are equally real. The 2000 leaders burned cash; Nvidia, Microsoft, and Amazon fund their data centers largely from operating cash flow, which is the opposite of the debt-financed fiber overbuild — though debt-funded exceptions exist at the edge of the ecosystem, as the CoreWeave backlog-versus-debt question shows. A cash-funded overbuild destroys returns; a debt-funded overbuild destroys companies. That distinction is why "AI is exactly like dot-com" and "AI is nothing like dot-com" are both wrong.
What Usually Pops a Bubble
Across the eight completed episodes, the triggers repeat with almost boring regularity:
- Monetary tightening — 1929, 1973, 1989, 2000, and 2022 all broke during or immediately after central-bank hiking campaigns.
- A leverage crackdown — China 2015 and crypto 2021 died when the borrowed money was called away.
- Capex or demand disappointment — the dot-com bust began in the order books of equipment vendors before it reached the index.
- Supply of paper — heavy IPO and secondary issuance near every top absorbed the marginal dollar of demand.
Notably absent from the list: valuation itself. Expensive markets got more expensive for years. The yield curve and credit conditions have historically been better warnings than any price-to-earnings ratio.
Tracking Bubble Risk in Real Time
A reference table tells you the base rates; it cannot tell you the day. What investors can actually monitor in 2026: breadth (how many names hold the index up), capex-to-cash-flow ratios each earnings season, credit conditions, and how crowded momentum positioning has become.
That is a data problem, and it is the one SimianX was built for. A live multi-agent analysis session runs technical, fundamental, news, and decision agents on any of the stocks or pairs above in about a minute; Market Pulse watches the whole tape for breadth and volatility events in real time; and the AI model leaderboard shows which models have actually navigated these unwinds best — the same comparison our readers use in GPT vs Gemini vs Claude for AI Stock Analysis.
FAQ
Are we in an AI bubble in 2026?
By the historical scorecard: concentration, monetary tightening, and narrow breadth rhyme with past bubbles, while leader profitability and cash-funded capex do not. That mix looks like a late-cycle boom with bubble characteristics at the edges — not a repeat of March 2000, and not safely "different this time" either.
How long did the dot-com crash take to recover?
The Nasdaq Composite fell 78% from March 2000 to October 2002 and did not close above its 2000 peak until April 2015 — 15.1 years in nominal terms, longer after inflation.
What was the biggest bubble collapse in history?
By index drawdown in this table, the 1929–32 Dow collapse (−89%). By recovery time, Japan: the Nikkei 225 needed 34.2 years to reclaim its December 1989 peak.
Do markets always recover from a burst bubble?
Broad indices eventually have, but "eventually" has meant up to 34 years nominal — and two episodes in this table (Shanghai 2015, ARKK 2021) remain unrecovered in 2026. Individual stocks frequently never recover.
What is most likely to end the AI cycle?
History points to the classic pair: sustained monetary tightening plus a capex disappointment showing up in cloud and semiconductor order books. That is why the 2026 hiking cycle and each quarter's hyperscaler capex guidance are the two numbers to watch.
Conclusion
Every generation is told its technology mania is unprecedented, and every generation's drawdown lands on the same table. The eight completed bubbles since 1929 fell a median of about 80% and took a median of roughly 11 years to reclaim their peaks — numbers worth keeping in view precisely because the AI cycle's technology, like the internet in 1999, is almost certainly real.
The table will be here when the ninth row resolves. Until then, the practical edge is not prediction — it is monitoring the same variables that ended the previous eight, with better tools than any previous generation had. You can put the current tape through that lens in a live SimianX analysis session in about a minute.
Related Reading
- Every S&P 500 Bear Market Since 1929
- How Long Every Bear Market Took to Recover (1929–2022)
- The Magnificent 7 in 2026: Weights & Concentration Risk
- AI Momentum Unwind 2026: Why Semiconductor Stocks Fall
- Semiconductor Bear Markets: Every SOX Crash 1995–2026
- KOSPI Crash 2026: Korea's AI-Chip Reckoning Explained
- Bitcoin Halving Cycles 2012–2028
- Every Fed Rate-Hike Cycle Since 1983