On Holding After Investor Day: The $1 Billion Buyback, the Growth Slowdown and the Nike Comparison
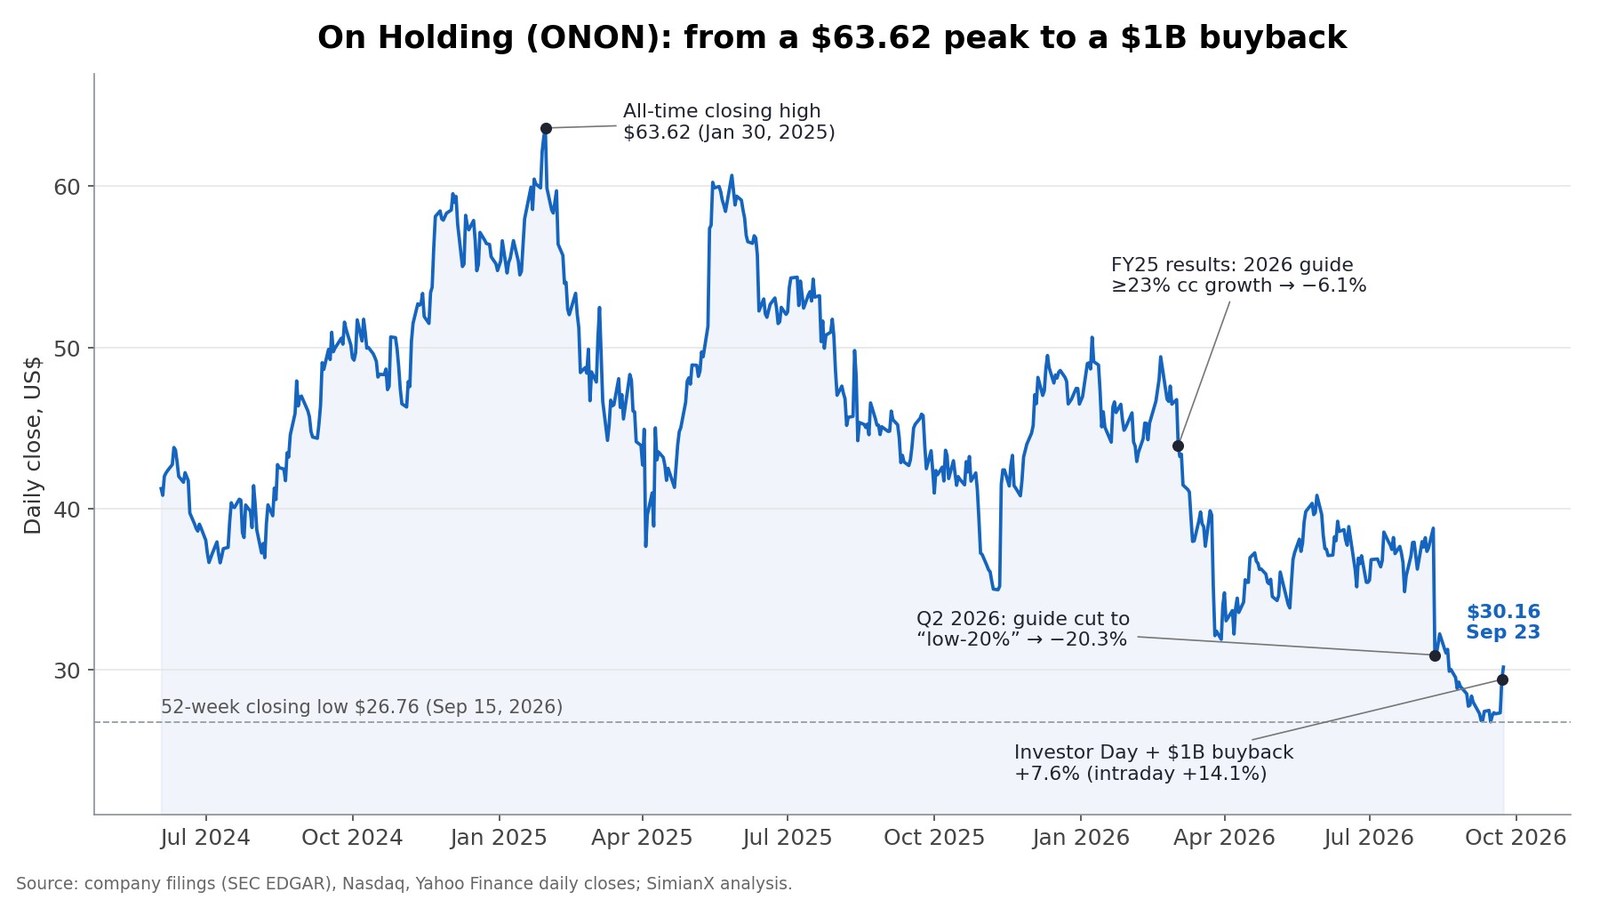
On Holding (NYSE: ONON) closed at $29.39 on September 22, 2026, up 7.6%, after the Swiss sportswear company used its Investor Day in Zurich to announce its first share-repurchase program: up to $1 billion of Class A shares through the end of 2029. Volume reached 43.3 million shares, about five times the 20-day average. The stock had traded as high as $31.16 (+14.1%) during the session before giving back half the gain, then added another 2.6% to close at $30.16 on September 23.
Most coverage framed the day as "On jumps on a buyback, can it beat Nike?" The filings and the price history show three things that framing leaves out:
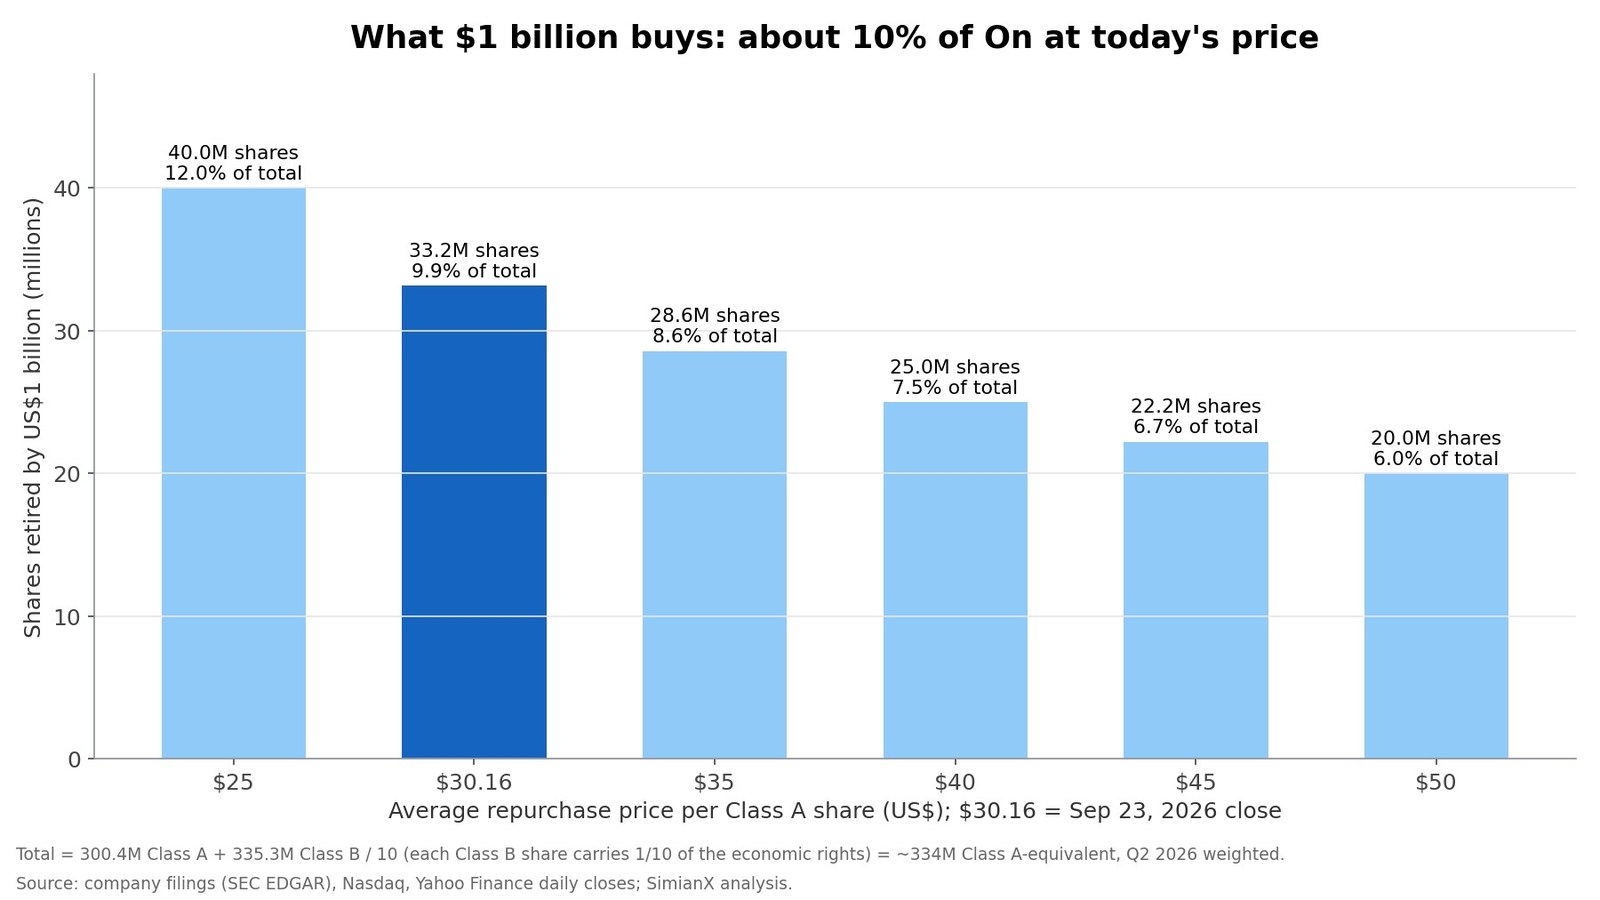
- The buyback is large for On's size. At $30.16, $1 billion retires about 33 million shares, roughly 10% of the company. For comparison, Nike repurchased $123 million of stock in its whole 2026 fiscal year. On is authorizing about eight times that, from a company one-fifth of Nike's market value.
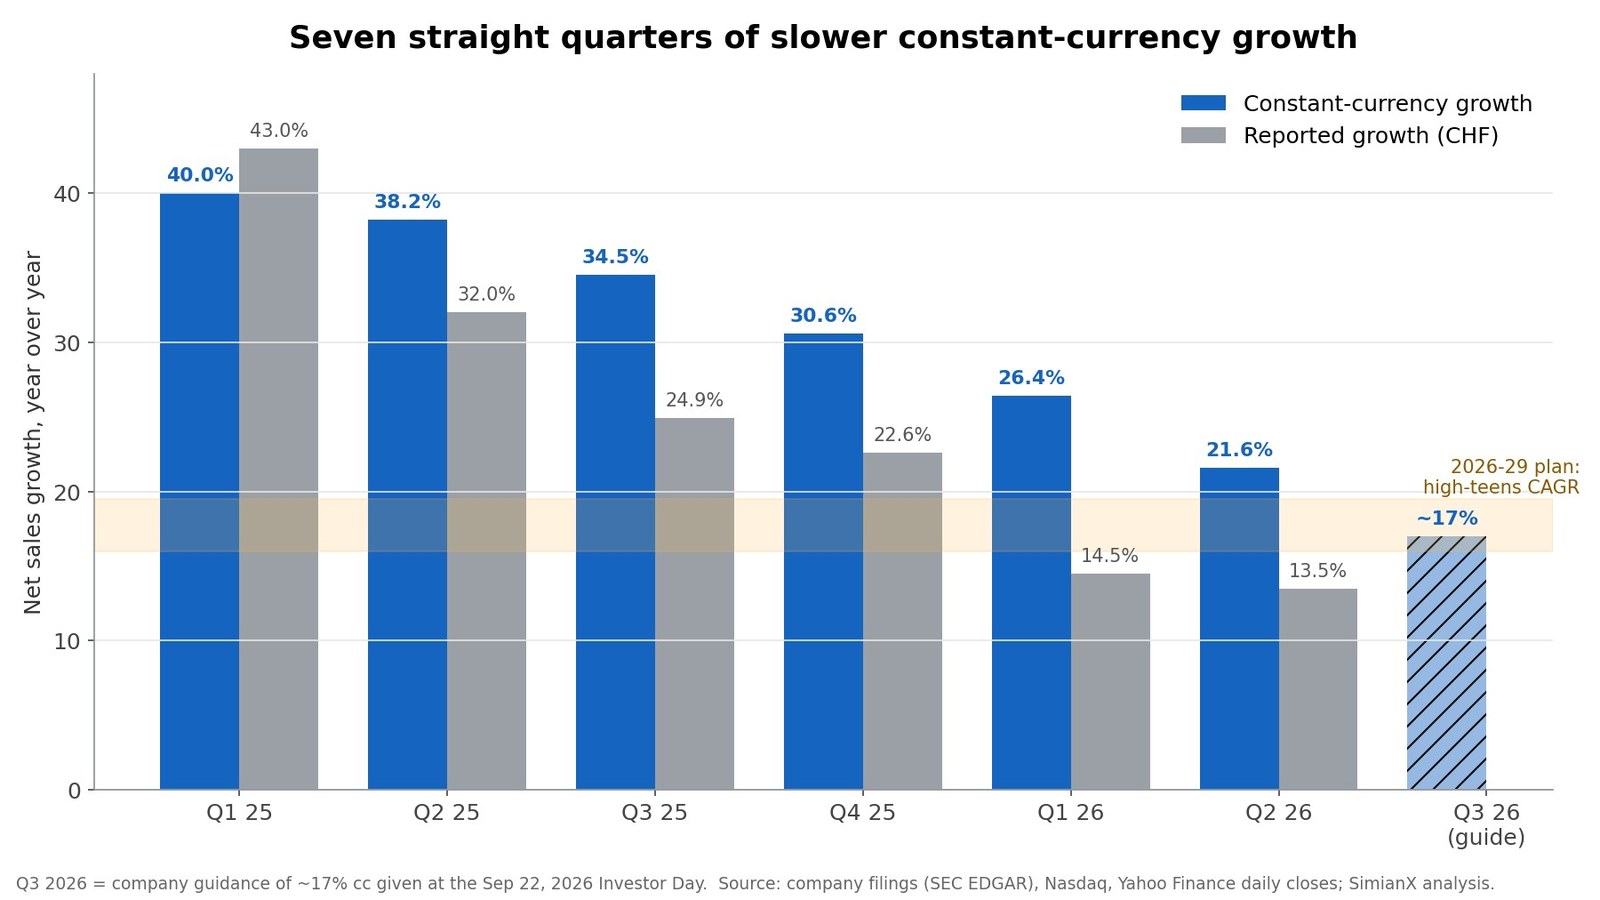
- Growth has slowed for seven straight quarters. Constant-currency sales growth fell from 40.0% in Q1 2025 to 21.6% in Q2 2026. On guided to about 17% for Q3 2026, and the new 2029 plan assumes a "high-teens" pace. The buyback arrived six weeks after a 20.3% one-day drop on a guidance cut.
- Beating Nike is mostly about margins and growth rates, not size. Nike's fiscal 2026 revenue of $46.4 billion is about 12 times On's trailing sales. Even On's 2029 target would be roughly 15% of what Nike sells today.
This analysis rebuilds the story from On's Investor Day release, its Q2 2026 results, Nike's fiscal 2026 results release and daily trading data. It adds a buyback-math table, a growth-deceleration table, a side-by-side On-versus-Nike scorecard and a record of how ONON traded after each results day.
Prices are official closes through September 23, 2026. On reports in Swiss francs; US-dollar conversions use about US$1.21 per franc.
ONON After Investor Day: Key Numbers
| Metric | Value |
|---|---|
| Close, Sep 22, 2026 | $29.39 (+7.6%) |
| Intraday high, Sep 22 | $31.16 (+14.1%) |
| Close, Sep 23, 2026 | $30.16 |
| Volume, Sep 22 | 43.3M shares (~5x the 20-day average) |
| All-time closing high | $63.62 (Jan 30, 2025), now −52.6% |
| 52-week closing low | $26.76 (Sep 15, 2026) |
| Q2 2026 results day (Aug 11) | −20.3% |
| Share-count basis | ~334M Class A-equivalent shares |
| Market value at $30.16 | ~$10.1B |
| Cash, June 30, 2026 | CHF 1,205.6M (~$1.46B) |
| Buyback authorization | Up to $1B, through Dec 2029 |
On has two share classes. The 300.4 million listed Class A shares trade on the NYSE. The founders and early team hold 335.3 million Class B voting shares, and each Class B share carries one-tenth of a Class A share's economic rights. Adding Class A plus one-tenth of Class B gives about 334 million Class A-equivalent shares. That is the right base for market value and for measuring the buyback. The ratio is confirmed by the 2026 annual meeting, which approved converting 16.25 million Class B shares into 1.625 million Class A shares.
Why ONON Jumped: The $1 Billion Buyback Math
The board approved the program in September 2026. The company describes it as an "inaugural" repurchase within "a disciplined capital allocation strategy" that reflects its "strong balance sheet and the highly cash generative nature" of its growth. The size relative to the company is what matters.
| Average repurchase price | Shares retired by $1B | Share of On retired |
|---|---|---|
| $25 | 40.0M | 12.0% |
| $30.16 (Sep 23 close) | 33.2M | 9.9% |
| $35 | 28.6M | 8.6% |
| $40 | 25.0M | 7.5% |
| $45 | 22.2M | 6.7% |
| $50 | 20.0M | 6.0% |
Can On afford it?
Yes, comfortably, based on the balance sheet and recent cash flow:
- Cash: CHF 1,205.6 million (about $1.46 billion) at June 30, 2026, up from CHF 1,019.9 million at the end of 2025. On's only material liabilities beyond working capital are CHF 562.5 million of store and office leases. It has no meaningful bank debt.
- Free cash flow: For the 12 months to June 2026, operating cash flow was about CHF 525 million. Subtracting CHF 96 million of capital spending and CHF 71 million of lease payments leaves roughly CHF 358 million (about $433 million).
- Pace: Spread evenly over the roughly 13 quarters to December 2029, $1 billion is about $308 million a year, around 70% of trailing free cash flow. On could fund the whole program from existing cash and still keep investing.
What the buyback does not do
- Some of it simply offsets dilution. Share-based compensation ran at CHF 33.5 million in the first half of 2026, about CHF 67 million ($81 million) a year. At $30 that is roughly 2.7 million shares a year, or about 0.8% of On. On currently funds employee awards by selling treasury shares, so part of any repurchase replaces shares handed out to staff.
- The authorization is not an obligation. "Up to $1 billion" sets a ceiling. On has not given a pace, and the first disclosure of actual purchases will come in a later quarterly report.
- There is also a known seller. Former CEO Martin Hoffmann received special rights in March 2026 to convert his 16.25 million Class B shares. At the 2026 annual meeting they became 1.625 million Class A shares, which he may sell in "orderly market sales" capped at 5% of average daily volume. That is small next to a 33-million-share buyback, but it is supply the company is effectively absorbing.
A buyback creates value only when the price paid is below what the business is worth. At $30, the program retires about twice as many shares per dollar as the same money would have at the January 2025 peak. That is the strongest argument for doing it now rather than in 2025. For how buyback timing can go wrong, see our analysis of Netflix's buyback math.
The Part the Headline Skipped: Seven Quarters of Slower Growth
The buyback came with a new 2029 plan and a Q3 outlook, and those explain why the stock gave back half its intraday gain.
| Quarter | Net sales (CHF) | Reported growth | Constant-currency growth | Gross margin |
|---|---|---|---|---|
| Q1 2025 | 726.6M | +43.0% | +40.0% | 59.9% |
| Q2 2025 | 749.2M | +32.0% | +38.2% | 61.5% |
| Q3 2025 | 794.4M | +24.9% | +34.5% | 65.7% |
| Q4 2025 | 743.8M | +22.6% | +30.6% | 63.9% |
| Q1 2026 | 831.9M | +14.5% | +26.4% | 64.2% |
| Q2 2026 | 850.3M | +13.5% | +21.6% | 65.4% |
| Q3 2026 (guide) | — | — | ~17% | — |
Full-year 2025: CHF 3,014.0M, +30.0% reported, +35.6% constant currency, 62.8% gross margin, adjusted EBITDA CHF 567.0M (18.8%).
Three details matter:
- The franc is eating reported growth. In Q2 2026 the gap between constant-currency (+21.6%) and reported (+13.5%) growth was about eight points. On sells most of its product in US dollars and other currencies but reports in Swiss francs, so a strong franc shrinks both reported sales and the value of US profits. A dollar-denominated buyback also costs fewer francs when the franc is strong.
- The guidance path went down. In March, On guided to at least 23% constant-currency growth for 2026. With Q2 results on August 11 the outlook became "the low-20% range." The company said this reflected "the deliberate management of wholesale sell-in" before new product launches. The stock fell 20.3% that day. At Investor Day, On reiterated the low-20% outlook and guided Q3 to about 17%.
- The Americas, On's largest region, is the slowest. Q2 Americas sales rose only 4.5% in francs (13.0% in constant currency) to CHF 451.6 million, 53% of the total. Asia-Pacific grew 43.1% (54.7% in constant currency). For the US consumer backdrop, see our note on what Walmart and Target signalled about stretched shoppers.
The quality of growth held up better than the rate. Direct-to-consumer (DTC) sales grew 34.3% in constant currency in Q2 to 45.7% of the mix. Apparel grew 56.2%. Gross margin reached 65.4% while absorbing higher US tariffs and excluding any tariff refunds. Wholesale grew 12.7% in constant currency, but only 4.8% in francs, because On is deliberately shipping less to retailers.
On Holding's 2029 Targets, Checked Against 2025
| 2029 ambition | Target | 2025 actual | What it implies |
|---|---|---|---|
| Net sales | At least CHF 5.6B ("approaching USD 7B") | CHF 3.014B | ~16.7% a year from 2025 at constant FX |
| Growth rate | High-teens constant-currency CAGR, 2026–2029 | +35.6% cc | Well below 2025's pace |
| Gross margin | 65.0%+ "throughout the period" | 62.8% | Already at 65.4% in Q2 2026 |
| Adjusted EBITDA margin | 22%+ by 2029 | 18.8% | ~CHF 1.23B of adjusted EBITDA on CHF 5.6B |
| Adjusted EBITDA growth | CAGR above 20%, 2026–2029 | CHF 567.0M | ~2.2x 2025's level by 2029 |
| Capital return | Up to $1B buyback through Dec 2029 | None | First repurchase program |
The targets are consistent with each other. The sales goal needs roughly 17% a year from the 2025 base, the gross margin target is already being met, and most of the margin expansion is meant to come from spreading SG&A costs over more sales. Management says it is on track to "significantly exceed" the targets from its 2023 Investor Day.
Two caveats apply. The targets are measured in constant currency, so a strong franc will make reported numbers look worse. And "high-teens" growth is a step down from the 26–40% constant-currency rates On posted through 2025. The market is being asked to pay for a slower company.
On vs Nike: The Scorecard
| On Holding (ONON) | Nike (NKE) | |
|---|---|---|
| Latest full year | FY2025: CHF 3.01B (~$3.6B at current rates) | FY2026 (to May 31): $46.4B |
| Trailing-12-month sales | ~CHF 3.22B (~$3.9B) | $46.4B (~12x On) |
| Latest growth, constant currency | +21.6% (Q2 2026) | −2% (FY2026); −4% (Q4) |
| Direct-to-consumer | +34.3% cc (Q2 2026), 45.7% of sales | Nike Direct −8% cc (FY2026); Digital −12% |
| Gross margin | 65.4% (Q2 2026) | 42.9% (FY2026) |
| Buybacks | Up to $1B authorized (Sep 2026) | $123M bought in FY2026 under an $18B program |
| Market value (Sep 23) | ~$10.1B | ~$53.5B (1.48B shares × $36.05) |
| Price / trailing sales | ~2.6x | ~1.2x |
| Price / trailing earnings | ~21x (IFRS net income) | ~17x; ~23x excluding expected tariff recoveries |
| Stock since Dec 31, 2024 | −44.9% | −52.4% |
| From all-time high | −52.6% | about −80% (Nov 2021 peak) |
| Leadership | Founders Allemann and Coppetti co-CEOs since May 2026; new CFO | CEO Elliott Hill; new CFO David Denton since Aug 2026 |
A few rows need context:
- Nike's margin. Nike's Q4 gross margin of 49.2% included about 900 basis points from the expected recovery of $986 million in IEEPA tariffs. Its full-year gross margin of 42.9% is the cleaner comparison. On expects up to $65 million of its own tariff refunds in Q3 2026 and keeps them out of guidance.
- Nike's earnings. Nike's fiscal 2026 diluted EPS of $2.10 includes a $0.52 benefit from those tariff recoveries. Without it, Nike trades at about 23 times earnings, slightly more than On's roughly 21 times.
- Nike's buyback. Nike paid $2.4 billion in dividends in fiscal 2026 but bought back only $123 million of stock (1.8 million shares) under its four-year, $18 billion program, as the company prioritized the dividend during its turnaround. The full-year details are in its fiscal 2026 Form 10-K.
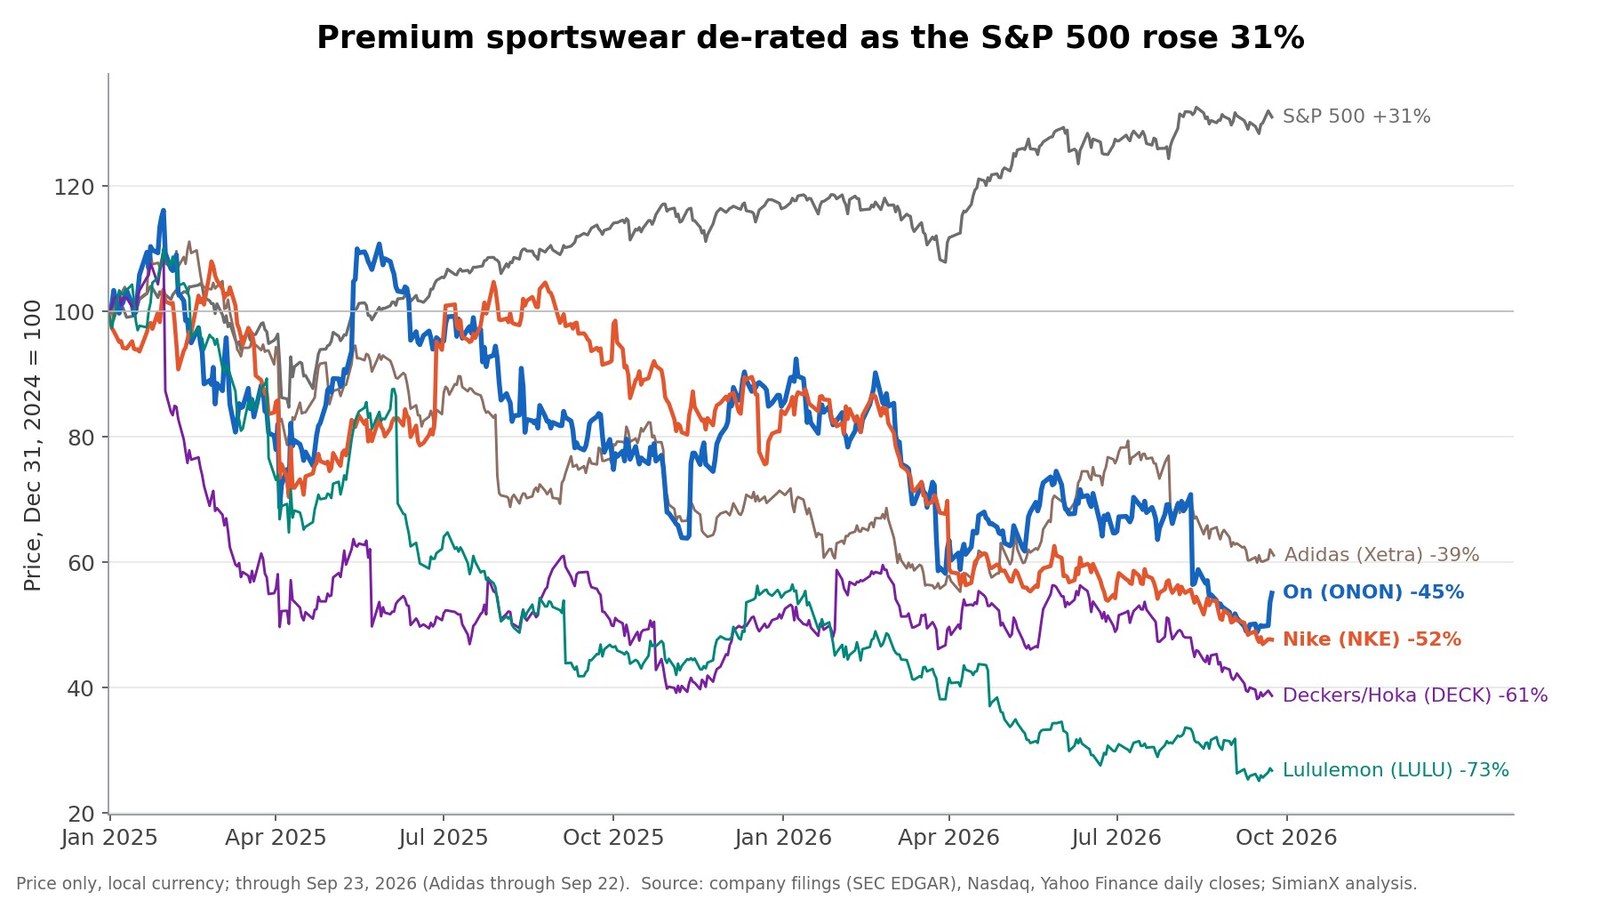
The chart shows the backdrop most coverage missed. Premium sportswear lost value as a group while the S&P 500 rose 31%. Since the end of 2024, On is down 45%, Nike 52%, Deckers (the owner of Hoka) 61%, Lululemon 73% and Adidas 38%. On has already out-performed Nike in the stock market over this period, but only by falling less. For a case study of how deep the de-rating went, read our Lululemon analysis.
Can On Holding Overtake Nike?
That depends on which measure you use:
- Total revenue: no, not this decade. Nike's $46.4 billion is about 12 times On's trailing sales. If On hits CHF 5.6 billion (about $6.8 billion at current rates) in 2029, it would still be around 15% of Nike's current size.
- Market value: far away, but less so. Nike is worth about 5.3 times On, less than half the revenue gap, because investors pay more per dollar of On's faster-growing, higher-margin sales.
- Growth and margins: On already leads. On grows at 20%+ in constant currency against Nike's −2%, earns a gross margin more than 20 points higher and is growing its own stores and website while Nike Direct shrinks.
- Premium running and younger consumers: this is where the contest happens. On says consumers under 34 are over a third of its customers and brand awareness has reached 30%. Nike's turnaround under Elliott Hill aims squarely at performance running. That contest cannot be read from filings, but DTC growth and full-price selling are the closest measurable proxies.
The realistic thesis is not "On replaces Nike." It is "On keeps taking premium share while Nike rebuilds," and the stock is valued on how long that lasts.
How ONON Has Traded After Results Days
| Date | Event | Event-day move | Next 20 trading days |
|---|---|---|---|
| Mar 4, 2025 | Q4 2024 results | +5.8% | −15.7% |
| May 13, 2025 | Q1 2025 results | +11.8% | −1.0% |
| Aug 12, 2025 | Q2 2025 results | +8.9% | −14.0% |
| Nov 12, 2025 | Q3 2025 results | +18.0% | +19.2% |
| Mar 3, 2026 | FY2025 results, 2026 guide | −6.1% | −22.5% |
| May 12, 2026 | Q1 2026 results | −0.6% | +12.3% |
| Aug 11, 2026 | Q2 2026, guidance cut | −20.3% | −13.2% |
| Sep 22, 2026 | Investor Day, $1B buyback | +7.6% | pending |
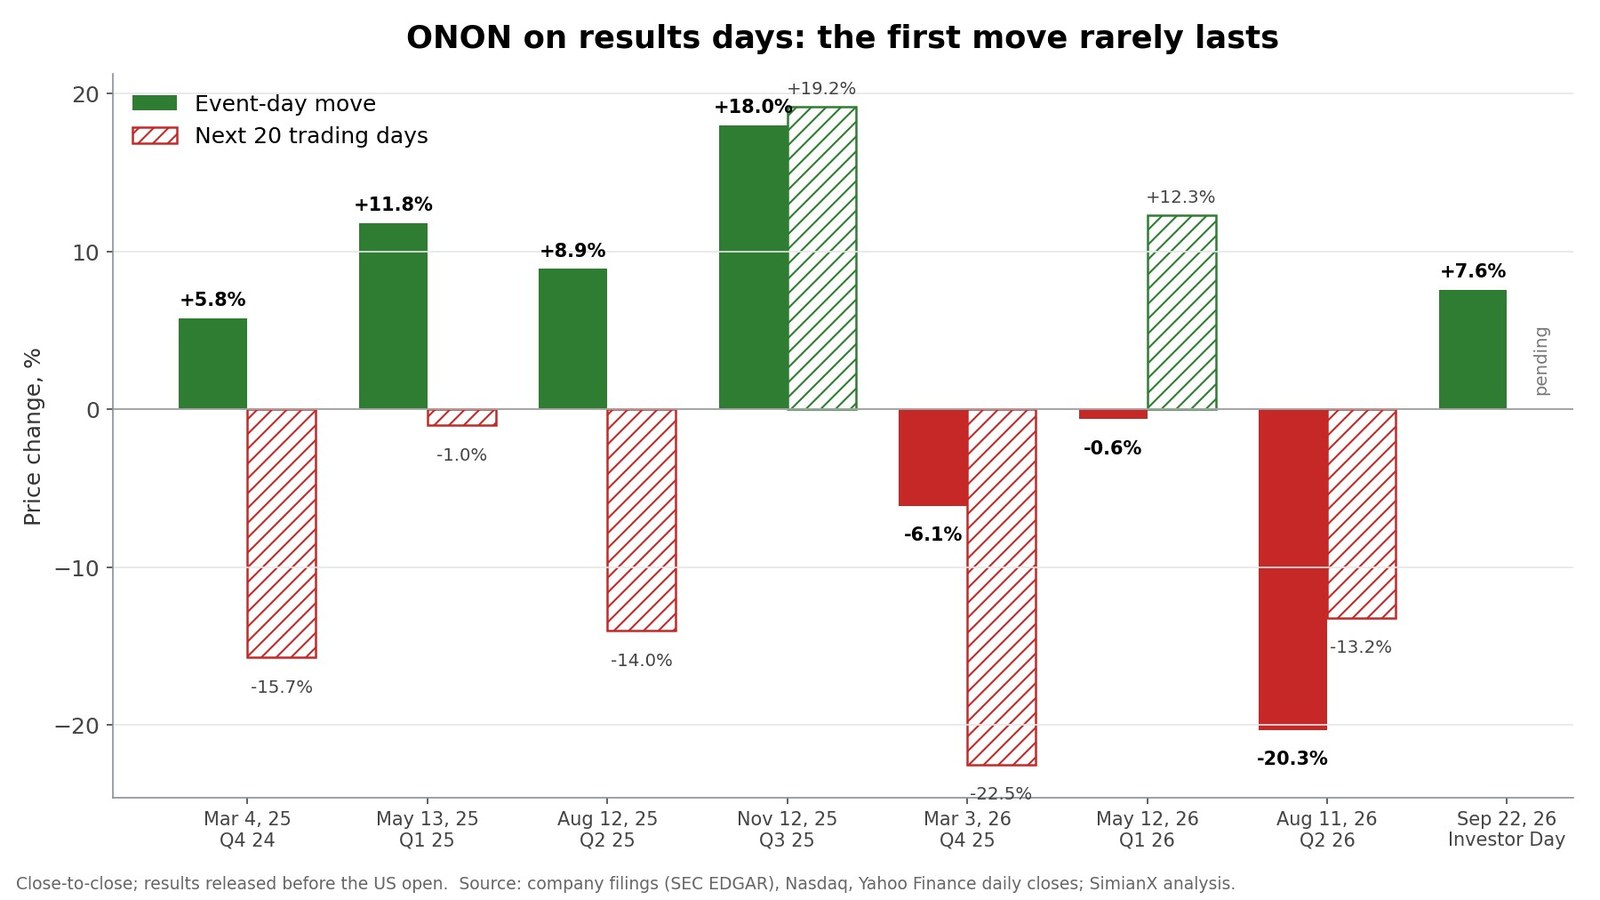
The pattern is mixed but instructive. After three of the four earlier positive event days, the stock was lower 20 trading days later. Only November 2025 kept going. ONON also closed well below its intraday high on several of those days: +14.2% intraday to +8.9% in August 2025, +27.5% to +18.0% in November 2025, and +14.1% to +7.6% in September 2026. That is the same gap-and-fade we documented after Generac's Amazon deal. A buyback can support a stock during that window, which is one reason the September reaction may prove stickier than earlier ones. The table is a small sample, not a forecast.
ONON Valuation: What Must Investors Believe?
At $30.16, On's enterprise value is about $9.3 billion: a $10.1 billion market value, minus $1.46 billion of cash, plus $0.68 billion of lease liabilities. That is about 12 times trailing adjusted EBITDA of CHF 653 million ($790 million). The more useful question is what that price implies for 2029:
| Scenario (from 2025 base) | 2029 net sales | Adj. EBITDA margin | 2029 adj. EBITDA | Today's EV / 2029 EBITDA |
|---|---|---|---|---|
| Company targets met | CHF 5.6B | 22% | CHF 1.23B (~$1.49B) | ~6.2x |
| Growth slows to 12% a year | CHF 4.7B | 20% | CHF 0.95B (~$1.15B) | ~8.1x |
| Stress: 8% a year, promotions | CHF 4.1B | 18% | CHF 0.74B (~$0.89B) | ~10.4x |
Illustrative arithmetic, not a forecast. FX held at ~US$1.21 per franc; enterprise value held at today's level.
If On delivers its plan, today's price looks inexpensive on 2029 earnings. Even the stress case leaves the stock on about 10 times 2029 EBITDA. The market's discount reflects doubt about the path rather than the arithmetic. Guidance has already been cut once in 2026, the franc hurts reported results, and the high-teens plan starts from a quarter guided at 17%.
The buyback helps at the margin. Retiring 10% of the shares at today's price would raise every per-share figure in the table by about 11%, all else equal.
Risks to the ONON Thesis
- More deceleration. Q3 is guided to ~17%. If growth settles in the low teens, the 2029 targets slip and the multiple compresses.
- Currency. A strong franc lowers reported sales and profits. The constant-currency targets will not show this.
- Wholesale reset. Deliberately shipping less to retailers protects pricing, but it also cuts sales now. The Q2 guidance cut showed how the market reacts.
- The US market. Americas growth of 4.5% in francs is the weakest spot for a brand built in US running stores.
- Execution in new categories. Football and golf are new; apparel is scaling quickly from a small base (CHF 54.2 million in Q2).
- Tariffs. Gross margin has absorbed higher US import tariffs so far. Q3 includes up to $65 million of one-off tariff refunds, which will flatter reported gross profit.
- Governance and leadership. The founders control votes through Class B shares, the founders became co-CEOs in May 2026, and a new CFO joined the same month.
- Nike's recovery. Nike has $9.0 billion of cash, a new CFO and a performance-running push. A Nike rebound would hit On's premium share first.
- Buyback execution. Buying at $30 is attractive only if growth holds; buying aggressively into a later rally would dilute the benefit.
What to Watch Next
- Nike's fiscal Q1 2027 results, listed on the Nasdaq earnings calendar for around October 1, 2026: Nike Direct trends and gross margin excluding tariff recoveries.
- On's Q3 2026 results (expected mid-November, based on last year's timing): whether sales grow ~17% in constant currency, the size of the tariff refund in gross profit, and the first buyback purchases.
- The Americas line: whether US growth in francs recovers from 4.5%.
- Wholesale sell-in versus DTC: a return to double-digit wholesale growth would mean retailer inventory is clean.
- 2027 guidance in March 2027, the first year fully inside the new plan.
SimianX AI tracks ONON's price, filings such as 6-K earnings releases and the 20-F, and news in one multi-agent research workflow. See the ONON stock fundamentals, or compare Nike (NKE), Lululemon (LULU) and Deckers (DECK).
FAQ
Why did On Holding stock go up on September 22, 2026?
ONON closed up 7.6% at $29.39 after On announced its first share-repurchase program, of up to $1 billion through December 2029, alongside new 2029 targets. The stock had been up as much as 14.1% intraday before fading. It closed at $30.16 the next day.
How big is On Holding's $1 billion buyback?
At $30.16 per share, $1 billion would retire about 33 million shares, close to 10% of On's roughly 334 million Class A-equivalent shares. On had CHF 1.2 billion (about $1.46 billion) of cash at June 30, 2026, enough to fund the entire program.
Is On Holding bigger than Nike?
No. Nike's fiscal 2026 revenue was $46.4 billion, about 12 times On's trailing sales of roughly $3.9 billion. On's target of at least CHF 5.6 billion in 2029 would still be only about 15% of Nike's current revenue.
Is On growing faster than Nike?
Yes. On grew 21.6% in constant currency in Q2 2026, while Nike's revenue fell 2% on a currency-neutral basis in fiscal 2026. On's gross margin of 65.4% is also more than 20 points higher than Nike's 42.9%.
Why did ONON fall in August 2026?
On August 11, 2026, On cut its 2026 constant-currency growth outlook from at least 23% to the low-20% range, citing deliberate management of wholesale shipments. The stock fell 20.3% that day.
What are On Holding's 2029 targets?
Net sales of at least CHF 5.6 billion, high-teens constant-currency growth from 2026 to 2029, gross margin of at least 65%, an adjusted EBITDA margin of at least 22% by 2029 and adjusted EBITDA growth above 20% a year.
Conclusion
The $1 billion buyback is bigger than the headline suggests. At $30 it would retire about a tenth of On, and the company can pay for it from cash it already holds. It is also eight times what Nike bought back last year. That is a clear signal that management thinks the shares are cheap after a 53% fall from the peak.
The buyback does not change the growth trend. Constant-currency growth has slowed from 40% to about 17% in seven quarters. A strong franc makes reported numbers look weaker still, and the new 2029 plan assumes high-teens growth rather than the pace that built the brand. On is not going to overtake Nike in size. It can keep beating Nike on growth, margins and direct sales, and at about 12 times trailing EBITDA the stock already prices in doubt about that. The next two reports, Nike's around October 1 and On's Q3 in November, will show whether the Investor Day bounce holds.
This article is for research and education only and is not financial advice.
Related Reading
- Lululemon Stock Below $100: Broken Brand or Rare Buy?
- Netflix −4.7%: The $2.8B Warner Fee Inflating Its P/E
- Generac-Amazon Deal: $2.4B Order Behind an $8B Headline
- IEEPA Tariff Refunds: 78 Stocks That Got Paid and How Much
References
- On — Investor Day: 2029 strategy, financial targets and $1B share repurchase (Sep 22, 2026)
- On Holding — Form 6-K with the Investor Day release (SEC)
- On — Q2 2026 results
- On — Q4 and full-year 2025 results
- On Holding — Annual Report on Form 20-F for 2025
- On Holding — co-founders named co-CEOs (Mar 25, 2026)
- On Holding — shareholders' agreement amendment on Martin Hoffmann's shares
- On Holding — 2026 annual general meeting results
- SEC EDGAR — On Holding AG filings
- Nike — fiscal 2026 fourth-quarter and full-year results
- Nike — Form 10-K for fiscal 2026
- Nike — CFO transition announcement (Jun 23, 2026)
- Nasdaq — Nike earnings calendar
- NYSE — ONON quote
- Wikipedia — International Emergency Economic Powers Act (IEEPA)
- Investopedia — share buybacks
- Investopedia — EBITDA
- Investopedia — enterprise value
- On — investor relations
- SimianX — ONON stock fundamentals