42 NVIDIA Earnings Reports, Measured Day by Day
If you are searching for what NVIDIA stock does after earnings, you probably want one thing: the actual numbers, not another preview column. So here they are. This page contains all 42 scheduled NVIDIA earnings reports from February 2016 through May 2026, the exact date each one was filed, and precisely how much NVDA moved the next trading day.
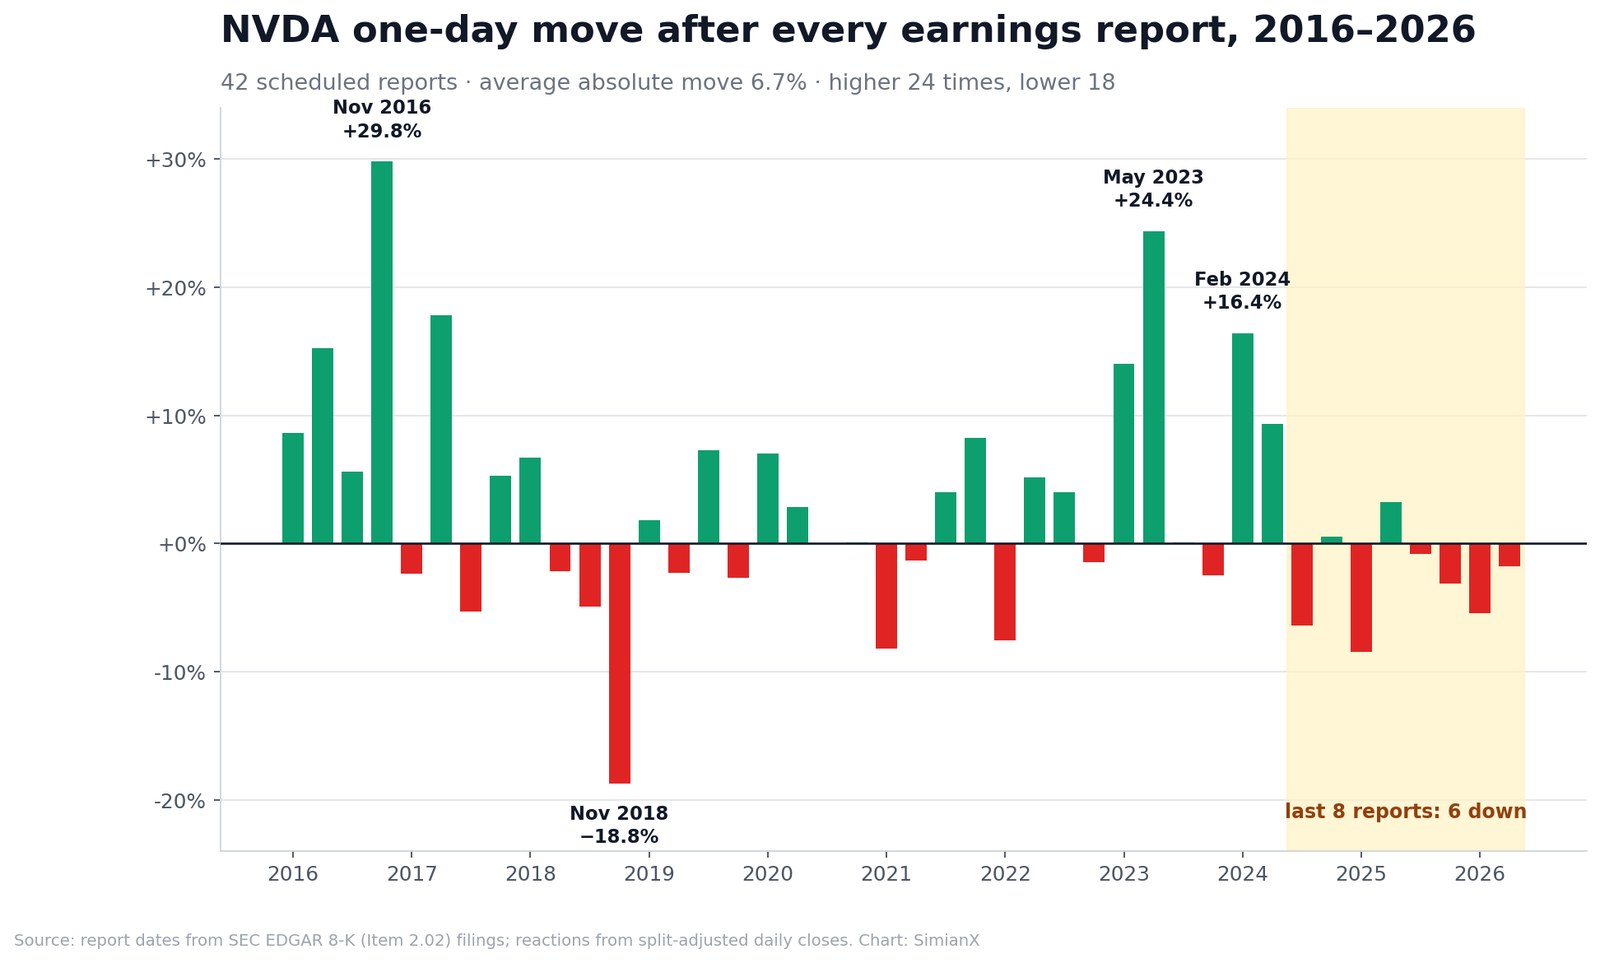
The short answer: NVDA's average one-day reaction is 6.7% in absolute terms, it has closed higher 24 times out of 42 (57%), and the extremes run from +29.8% to −18.8%. But the number that surprises most people is more recent — NVIDIA has now fallen after four consecutive earnings reports, and after six of its last eight, during the single most profitable stretch in the company's history.
Every figure below is reproducible. Report dates come from NVIDIA's own 8-K filings with the SEC, and reactions are computed from split-adjusted daily closes. The methodology section at the end explains exactly how, including the two occasions that most earnings calendars get wrong.
The complete table: every NVIDIA earnings reaction since 2016
NVIDIA reports after the US market closes, so the "reaction day" is always the next trading session. The 5-day column measures the move from the pre-earnings close through four sessions after the reaction day.
| # | Report date | Quarter | Reaction day | 1-day move | 5-day move |
|---|---|---|---|---|---|
| 1 | 17 Feb 2016 | Q4 FY2016 | 18 Feb 2016 | +8.60% | +15.04% |
| 2 | 12 May 2016 | Q1 FY2017 | 13 May 2016 | +15.21% | +22.43% |
| 3 | 11 Aug 2016 | Q2 FY2017 | 12 Aug 2016 | +5.59% | +4.02% |
| 4 | 10 Nov 2016 | Q3 FY2017 | 11 Nov 2016 | +29.81% | +36.33% |
| 5 | 09 Feb 2017 | Q4 FY2017 | 10 Feb 2017 | −2.37% | −7.85% |
| 6 | 09 May 2017 | Q1 FY2018 | 10 May 2017 | +17.83% | +32.90% |
| 7 | 10 Aug 2017 | Q2 FY2018 | 11 Aug 2017 | −5.33% | −1.98% |
| 8 | 09 Nov 2017 | Q3 FY2018 | 10 Nov 2017 | +5.27% | +3.06% |
| 9 | 08 Feb 2018 | Q4 FY2018 | 09 Feb 2018 | +6.69% | +13.32% |
| 10 | 10 May 2018 | Q1 FY2019 | 11 May 2018 | −2.15% | −4.77% |
| 11 | 16 Aug 2018 | Q2 FY2019 | 17 Aug 2018 | −4.90% | +3.65% |
| 12 | 15 Nov 2018 | Q3 FY2019 | 16 Nov 2018 | −18.76% | −28.36% |
| 13 | 14 Feb 2019 | Q4 FY2019 | 15 Feb 2019 | +1.82% | +3.02% |
| 14 | 16 May 2019 | Q1 FY2020 | 17 May 2019 | −2.28% | −8.03% |
| 15 | 15 Aug 2019 | Q2 FY2020 | 16 Aug 2019 | +7.25% | +15.27% |
| 16 | 14 Nov 2019 | Q3 FY2020 | 15 Nov 2019 | −2.67% | +0.19% |
| 17 | 13 Feb 2020 | Q4 FY2020 | 14 Feb 2020 | +7.02% | +8.60% |
| 18 | 21 May 2020 | Q1 FY2021 | 22 May 2020 | +2.86% | +1.14% |
| 19 | 19 Aug 2020 | Q2 FY2021 | 20 Aug 2020 | +0.02% | +5.23% |
| 20 | 18 Nov 2020 | Q3 FY2021 | 19 Nov 2020 | +0.09% | −1.44% |
| 21 | 24 Feb 2021 | Q4 FY2021 | 25 Feb 2021 | −8.22% | −11.69% |
| 22 | 26 May 2021 | Q1 FY2022 | 27 May 2021 | −1.35% | +8.09% |
| 23 | 18 Aug 2021 | Q2 FY2022 | 19 Aug 2021 | +3.98% | +16.66% |
| 24 | 17 Nov 2021 | Q3 FY2022 | 18 Nov 2021 | +8.25% | +11.66% |
| 25 | 16 Feb 2022 | Q4 FY2022 | 17 Feb 2022 | −7.56% | −10.42% |
| 26 | 25 May 2022 | Q1 FY2023 | 26 May 2022 | +5.16% | +15.42% |
| 27 | 24 Aug 2022 | Q2 FY2023 | 25 Aug 2022 | +4.01% | −12.36% |
| 28 | 16 Nov 2022 | Q3 FY2023 | 17 Nov 2022 | −1.46% | +3.83% |
| 29 | 22 Feb 2023 | Q4 FY2023 | 23 Feb 2023 | +14.02% | +9.37% |
| 30 | 24 May 2023 | Q1 FY2024 | 25 May 2023 | +24.37% | +30.23% |
| 31 | 23 Aug 2023 | Q2 FY2024 | 24 Aug 2023 | +0.10% | +4.56% |
| 32 | 21 Nov 2023 | Q3 FY2024 | 22 Nov 2023 | −2.46% | −3.61% |
| 33 | 21 Feb 2024 | Q4 FY2024 | 22 Feb 2024 | +16.40% | +15.10% |
| 34 | 22 May 2024 | Q1 FY2025 | 23 May 2024 | +9.32% | +16.38% |
| 35 | 28 Aug 2024 | Q2 FY2025 | 29 Aug 2024 | −6.38% | −14.65% |
| 36 | 20 Nov 2024 | Q3 FY2025 | 21 Nov 2024 | +0.53% | −7.23% |
| 37 | 26 Feb 2025 | Q4 FY2025 | 27 Feb 2025 | −8.48% | −10.65% |
| 38 | 28 May 2025 | Q1 FY2026 | 29 May 2025 | +3.25% | +5.27% |
| 39 | 27 Aug 2025 | Q2 FY2026 | 28 Aug 2025 | −0.79% | −5.47% |
| 40 | 19 Nov 2025 | Q3 FY2026 | 20 Nov 2025 | −3.15% | −3.36% |
| 41 | 25 Feb 2026 | Q4 FY2026 | 26 Feb 2026 | −5.46% | −6.40% |
| 42 | 20 May 2026 | Q1 FY2027 | 21 May 2026 | −1.77% | −4.13% |
The headline numbers from 42 reports
Aggregating the table gives a clean statistical profile of what an NVIDIA earnings night is actually worth:
- Average absolute move: 6.74%. This is the number to compare against the options market's implied move. If the straddle is pricing less than about 6%, history says that is cheap relative to the past decade.
- Median absolute move: 5.22%. The median sits well below the average, which tells you the distribution has a long tail — a handful of enormous reactions pull the mean up.
- Average signed move: +2.66%. Positive, but driven almost entirely by four monster gains.
- Higher 24 times, lower 18 times (57%). Barely better than a coin flip.
- 22 of 42 reactions (52%) were at least 5%. Twelve were at least 8%.
- Biggest gain: +29.81% on 11 November 2016. Biggest drop: −18.76% on 16 November 2018, when the crypto-mining hangover wiped out a quarter of NVIDIA's channel demand.
Note what this means for anyone holding through the print. A stock that moves an average of 6.7% overnight, with a 57% hit rate, is close to a fair coin with a very large payout on both sides. That is a volatility event, not an edge.
The pattern that matters right now: four straight declines
Here is the part that contradicts the narrative. NVIDIA spent 2023 through 2026 becoming the most valuable company in the world on the back of AI infrastructure demand. Yet its earnings-day reactions over the same window have quietly turned negative.
- The last four reports (Aug 2025, Nov 2025, Feb 2026, May 2026) all closed lower. Average: −2.79%.
- The last eight reports produced only two gains. Average: −2.78%.
- Reactions have also compressed. Average absolute move over the last eight is 3.73%, roughly half the 6.74% long-run figure.
The mechanism is not mysterious, and it is the single most useful thing on this page. NVIDIA has beaten consensus revenue every one of these quarters. The stock still fell. That is what happens when expectations, not results, become the binding constraint: a company guiding to records can still disappoint a market that has already priced records plus a margin. The same dynamic ran through the whole AI complex — see how it played out across the sector in every SOX semiconductor bear market since 1995, and how prior manias resolved in every tech bubble since 1929.
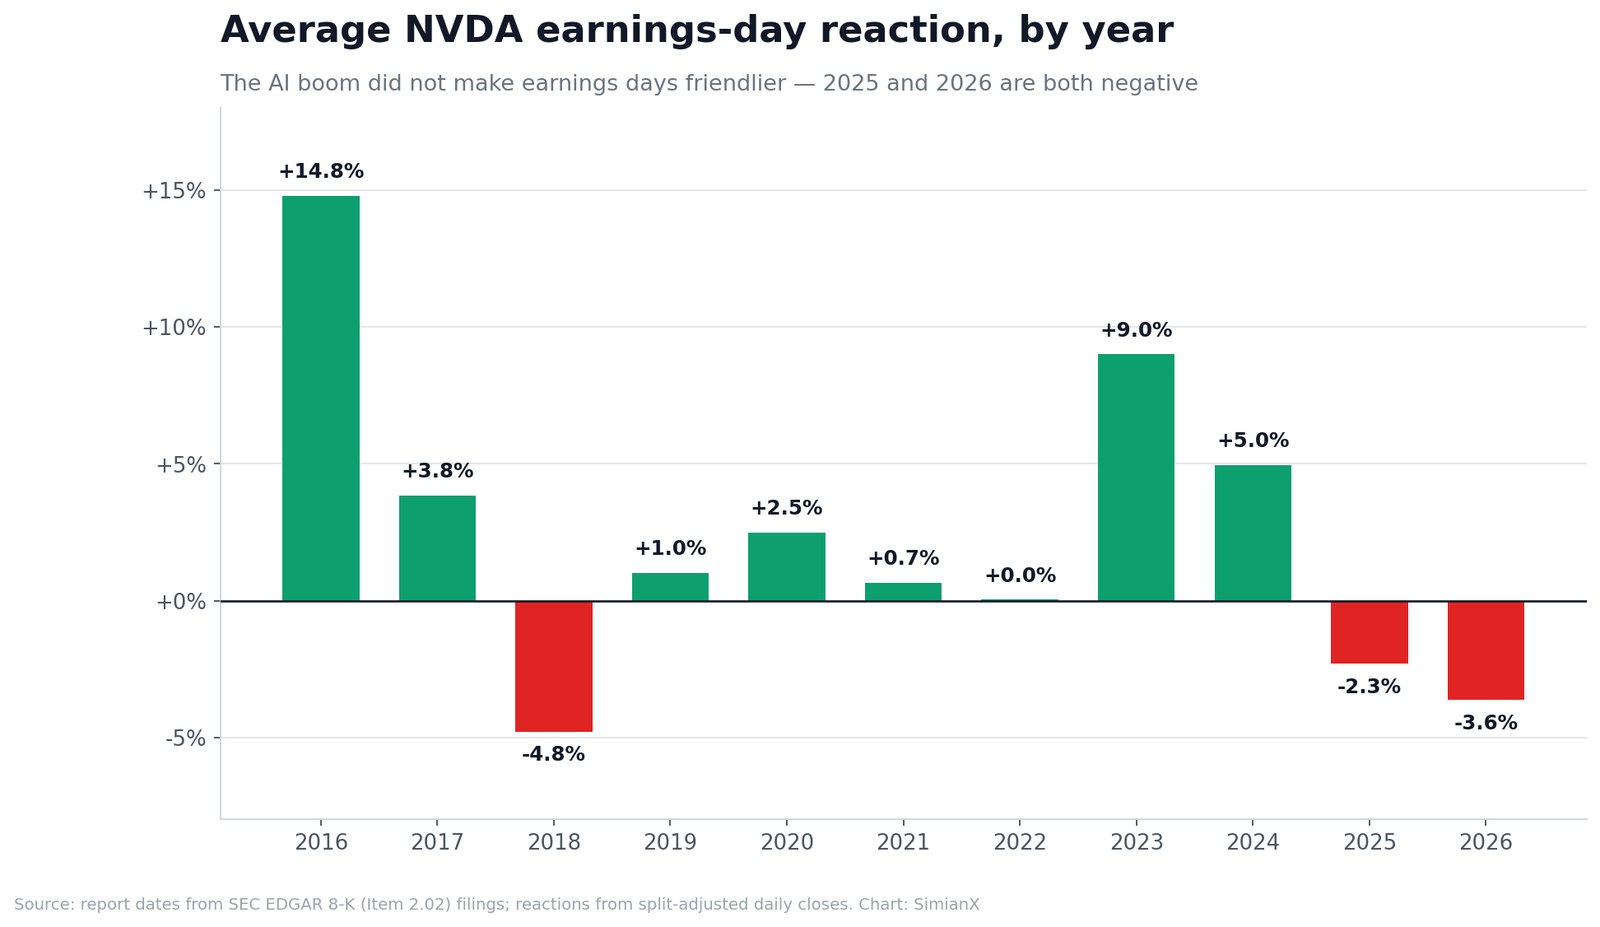
For 2016 and 2017, the average reaction was +14.8% and +3.8%. For 2025 and 2026 so far, it is −2.3% and −3.6%. The business got vastly bigger. The earnings-day payoff went the other way.
Earnings days are not where NVDA's returns came from
This is the most counterintuitive result in the dataset, and it is worth internalising before you plan any trade around the next report.
Take $1 invested in NVDA at the close before the first reaction day in this study (17 February 2016) and hold it to 31 July 2026. You would have roughly $298 — a gain of about 29,690%.
Now take the same $1, but hold NVDA only on the 42 earnings reaction days and sit in cash the rest of the time. You would have $2.58.
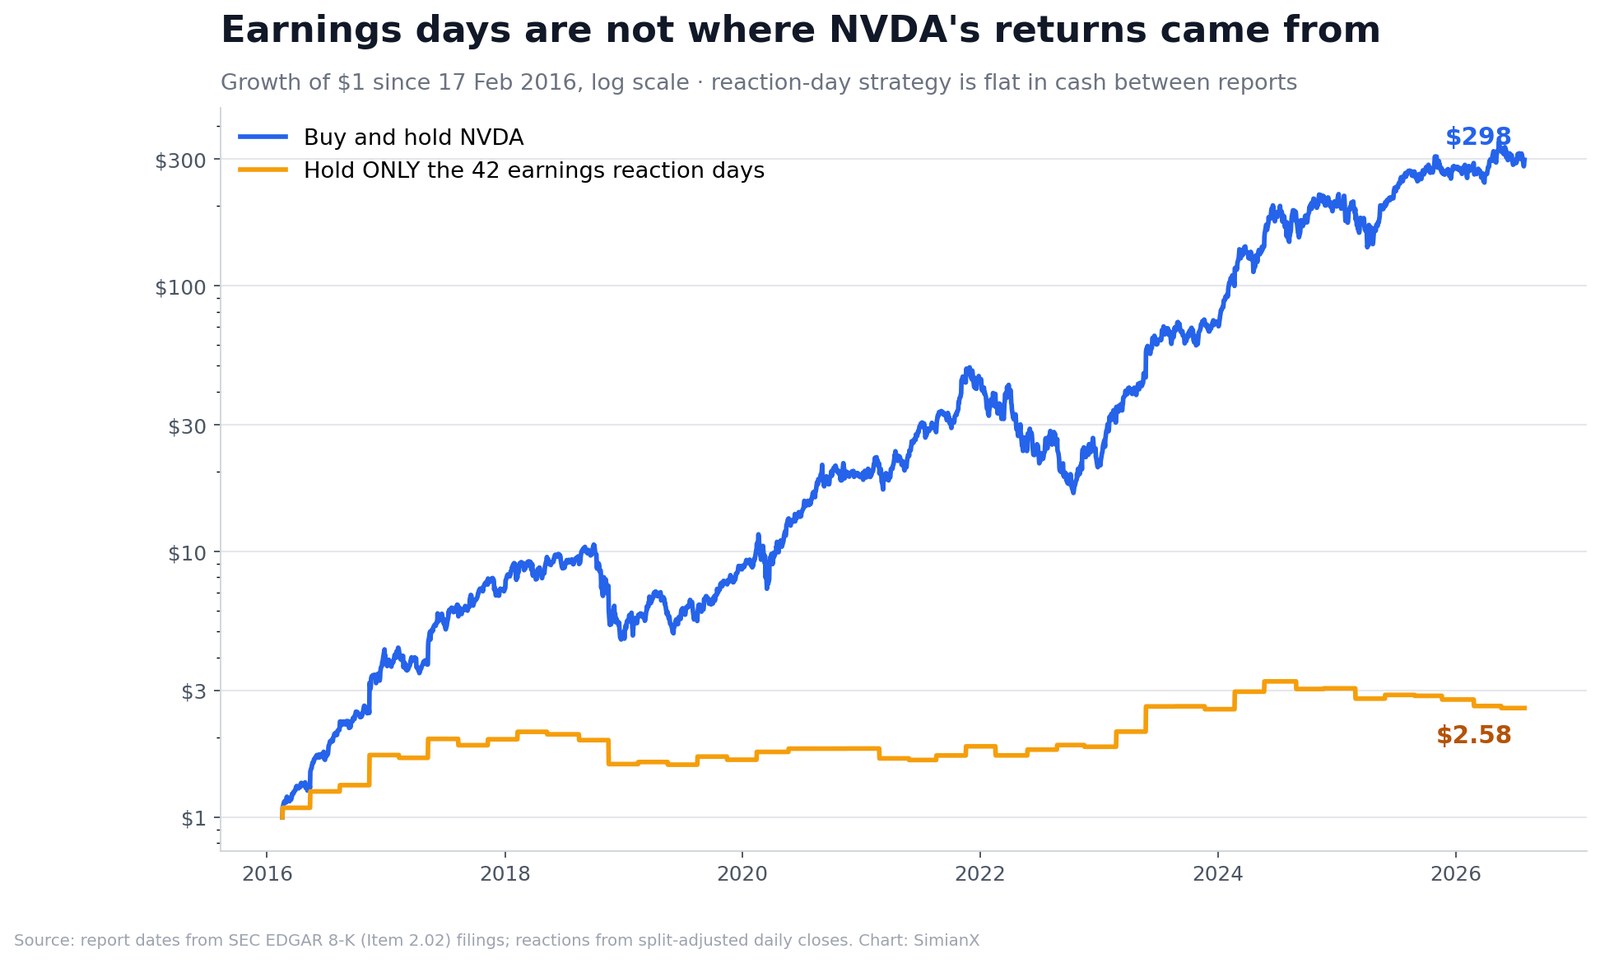
Forty-two of the most-watched trading days of the decade delivered a 2.6x. The other 2,600-odd sessions delivered the rest. NVIDIA's returns were built in the long grind between reports — the re-ratings, the product cycles, the sector flows — not in the overnight gaps that get all the coverage.
This mirrors what the 20 worst days in S&P 500 history show at index level: concentrating your risk into a handful of headline sessions is a good way to take maximum volatility for a fraction of the return.
The two reports that were not on the calendar
Most earnings-history tables you will find online are built by scraping a calendar. That introduces a specific error, and NVIDIA is the textbook case of it.
Twice in the last decade NVIDIA filed an 8-K under Item 2.02 — the item covering results of operations — outside its scheduled reporting date, to pre-announce that revenue would badly miss its own guidance. Both were released before the opening bell, not after the close, so the reaction is the same session, not the next one:
- 28 January 2019: NVIDIA cut its Q4 FY2019 revenue outlook, blaming weak gaming demand as the crypto-mining boom unwound. NVDA fell −13.82% that day. The scheduled report followed on 14 February and moved the stock just +1.82% — the damage was already done.
- 8 August 2022: NVIDIA pre-announced a large Q2 FY2023 gaming shortfall. NVDA fell −6.30% that day, then rose +4.01% on the scheduled report two weeks later.
These two events are excluded from the 42-report table because they are not scheduled quarterly results, and mixing them in would corrupt both the average and the win rate. They are included here because they carry a lesson a calendar cannot teach: NVIDIA's two worst pieces of fundamental news in a decade arrived on days nobody had circled.
Does the first-day move stick?
A fair question for anyone deciding whether to react on the day or wait. Across all 42 reports, the direction of the day-one move was still intact four sessions later 35 times — 83% of the time.
That is a genuinely high persistence rate, and it cuts against the common instinct to fade an earnings gap. It does not mean the move extends; the 5-day column shows plenty of cases where the initial reaction faded in magnitude while keeping its sign. But wholesale reversals within a week are the exception, occurring in roughly one report in six.
The clearest reversal in the table is 24 August 2022: NVDA closed +4.01% on the reaction day, then gave it all back and more, ending the five-day window at −12.36% as the broader market rolled over. Context outside the print can overwhelm it.
What August specifically has looked like
Grouping the 42 reports by reporting month produces a genuine seasonal difference, and it is relevant because NVIDIA has reported its July quarter between 23 and 28 August in each of the last four years.
| Report month | Reports | Average move | Average absolute move | Higher |
|---|---|---|---|---|
| February | 11 | +2.04% | 7.88% | 6 of 11 |
| May | 11 | +6.40% | 7.78% | 7 of 11 |
| August | 10 | +0.36% | 3.84% | 6 of 10 |
| November | 10 | +1.54% | 7.24% | 5 of 10 |
The August print is historically the quietest of the four by a wide margin — an average absolute move of 3.84%, roughly half of February's 7.88%. May has been the most rewarding: +6.40% on average, and home to the +24.37% reaction in 2023 that repriced the entire AI trade.
Treat this as a base rate, not a forecast. Ten observations is a small sample, and the sample is not stable — the last two Augusts printed −6.38% and −0.79%. NVIDIA has not confirmed its next reporting date on this page; check NVIDIA's investor relations site for the official announcement.
How to actually use this table
A reference table is only worth the decisions it improves. Three concrete uses:
1. Price the event honestly. Before the print, compare the options-implied move against the 6.74% average and 5.22% median. When implied volatility is well above both, you are being asked to pay a premium for an event whose historical hit rate is 57%.
2. Separate the beat from the reaction. NVIDIA beat revenue consensus in every one of the last eight quarters and the stock fell in six of them. If your thesis is "they will beat," this table shows that thesis has been insufficient for two years. The question worth answering is what is already priced.
3. Size for the tail, not the average. Twelve of 42 reactions exceeded 8%. A position sized for a typical 5% move is sized wrong for the 12-in-42 chance of something much larger.
If you want the pre-earnings setup broken down live rather than from a static table, SimianX runs a multi-agent workflow over technicals, fundamentals, news and sentiment for any US ticker — open NVDA in the Live Command Room to watch the agents build the case in real time, or let an autopilot monitor the position and alert you when the setup changes. We also publish which AI model is actually the best trader on live profit and loss, and a direct comparison of multi-agent AI versus ChatGPT on NVDA signals.
Methodology
Report dates. Taken from NVIDIA Corporation's 8-K filings containing Item 2.02 (Results of Operations and Financial Condition), retrieved from the SEC EDGAR full-text filing index for CIK 0001045810. These are the dates NVIDIA legally reported, not a third-party calendar estimate.
Reaction day. NVIDIA releases scheduled results after the US close, so the reaction is measured on the next regular trading session: the percentage change from the last close before the release to the close on the following session. The 5-day column measures from that same pre-release close through four sessions after the reaction day.
Prices. Split-adjusted daily closing prices, which correctly span NVIDIA's 4-for-1 split in July 2021 and 10-for-1 split in June 2024. Using unadjusted prices across those dates is the second most common error in tables of this kind.
Exclusions. The two Item 2.02 pre-announcements dated 28 January 2019 and 8 August 2022 are excluded from the 42-report sample and analysed separately, because they were unscheduled and released pre-market.
Coverage. 42 scheduled reports from 17 February 2016 through 20 May 2026. Data through the close of 31 July 2026, when NVDA finished at $200.75.
Frequently asked questions
How much does NVDA usually move after earnings?
The average absolute one-day move across the last 42 scheduled reports is 6.74%, with a median of 5.22%. Just over half of all reactions (22 of 42) were 5% or larger.
Does NVDA usually go up or down after earnings?
Up, but only barely: higher 24 times and lower 18 times, a 57% rate. Over the last eight reports that flipped hard — only two gains, and the last four were all declines.
What is NVDA's biggest ever earnings move?
The largest gain was +29.81% on 11 November 2016. The largest decline was −18.76% on 16 November 2018. In percentage terms, NVIDIA's single worst earnings-related day of the decade was actually the unscheduled −13.82% pre-announcement on 28 January 2019.
Does NVIDIA report before or after the market opens?
After the close, for all scheduled quarterly results in this dataset. The two exceptions were unscheduled pre-market revenue warnings.
Should I buy NVDA before earnings?
This page does not give investment advice. What the data says is that the historical edge from holding through the print is small — a 57% win rate with an average 6.7% swing — and that over the last two years the sign of that edge has been negative despite consecutive revenue beats.
Related reading
- Semiconductor Bear Markets: Every SOX Crash, 1995–2026
- Every Tech Bubble Since 1929: How AI in 2026 Compares
- The 20 Worst Days in S&P 500 History and What Came Next
- S&P 500 Seasonality: The Best & Worst Months 1950–2026
- Which AI Model Is the Best Trader? 30 LLMs on Real P&L
- Browse all SimianX market research
This article is for information only and is not investment advice. Past reactions do not predict future ones.