
 By Marcus Reeve
Industrial Stocks After Midterm Elections: The Record Since 1926
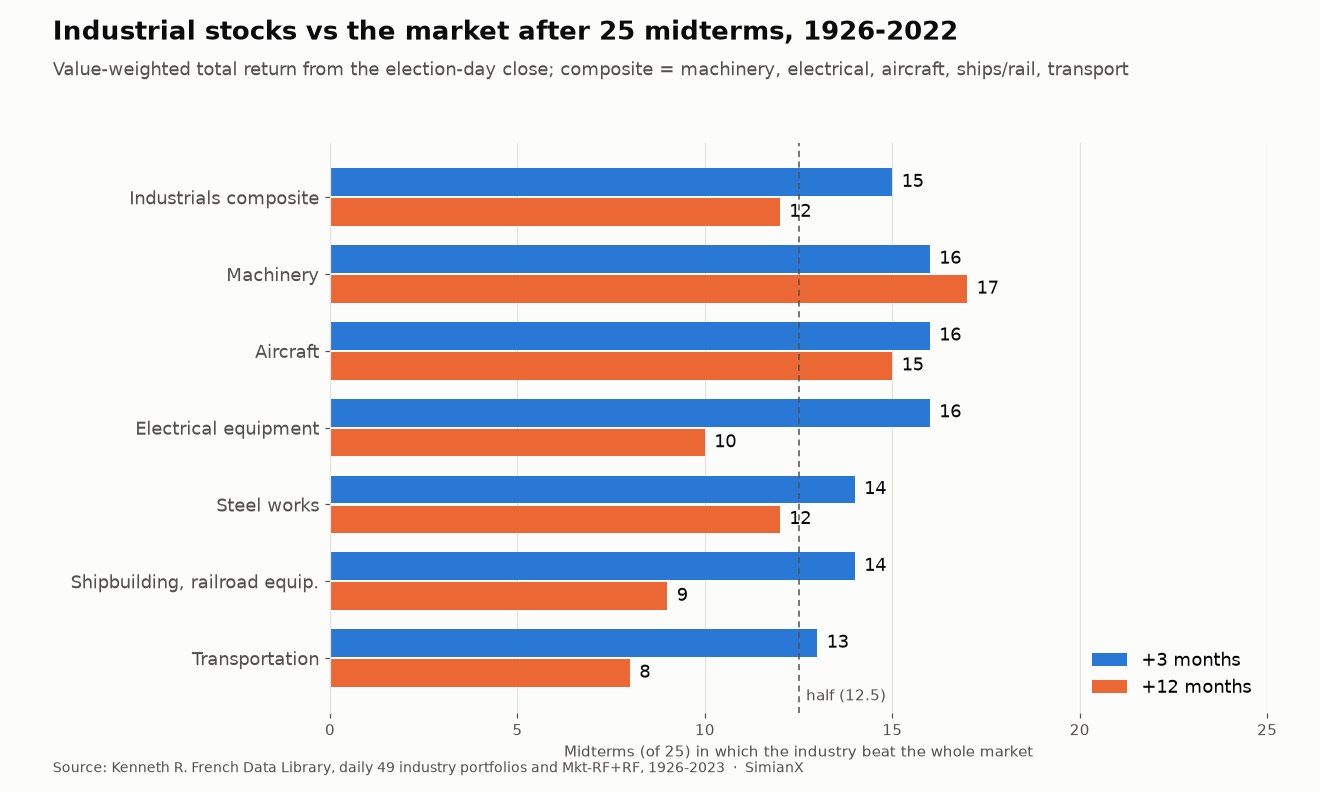
Quick answer: As a group, U.S. industrial stocks have been a coin flip after midterm elections. Across the 25 midterms from 1926 to 2022, a composite of machinery, electrical equipment, aircraft, shipbuilding and railroad equipment, and transportation beat the whole market over the next three months 15 times and over the next twelve months only 12 times, with an average twelve-month edge of zero. Machinery is the exception: it beat the market over twelve months after 17 of 25 midterms. Transportation is the laggard at 8 of 25, and the transport ETF IYT trailed SPY in the year after all five midterms from 2006 to 2022.
Result (as of 1:50 a.m. ET, November 4, 2026): Democrats won control of both the Senate and the House, calls made by AP and NBC News. By AP's count at 1:30 a.m. ET, Democrats had flipped seven Republican-held Senate seats and 16 House seats. Congress will be split from the White House from January 3, 2027.
Infrastructure is the classic midterm talking point. Highway bills, transit money, grid and water spending all have to pass Congress, so a change in who runs the House or Senate sounds like it should move the companies that build the equipment and haul the freight. The hundred-year record says something narrower. Industrials as a whole have not reliably beaten the market after a midterm. One part of the sector, machinery, has a long and fairly consistent winning record. Another part, transportation, has lost more often than it has won.
This page is the industrials and infrastructure spoke of our midterm series. The cross-sector scoreboard ranks twelve broad industries after every midterm since 1926. Here we go one level down, into the industrial groups of the 49-industry data, the industrial and infrastructure ETFs, Caterpillar, and the infrastructure laws Congress has actually passed.
How this was measured
The long sample comes from the Kenneth R. French Data Library, which publishes daily and monthly total returns for 49 value-weighted U.S. industry portfolios back to July 1926. In this article, "industrials" means five of those 49 industries:
- Machinery (French label "Mach"): engines and turbines, farm machinery, construction and mining machinery, elevators, conveyors, cranes, machine tools, pumps and general industrial machinery. This is where Caterpillar (CAT) and Deere sit.
- Electrical equipment ("ElcEq"): power transmission and distribution equipment, motors and generators, lighting and wiring, batteries, and communications equipment.
- Aircraft ("Aero"): aircraft, engines and parts.
- Shipbuilding, railroad equipment ("Ships"): shipyards and makers of locomotives and rail cars.
- Transportation ("Trans"): railroads, trucking, air carriers, shipping lines, pipelines and freight forwarding.
The industrials composite combines the five, weighted by each industry's stock-market value at the end of October of the election year, and held for the window. Two infrastructure input industries are shown alongside for reference: Steel works and Fabricated metal products. The construction industries are left out of the composite on purpose; they are dominated by homebuilders and behave like a housing trade.
The windows start at the last close on or before election day and end at the last close on or before the same date one day, one, three, six and twelve months later. The benchmark is the French total U.S. market return, so dividends are included on both sides. "Beat the market" means the industry's total return was higher than the market's over the same window.
Two caveats on sample size. The aircraft portfolio held one company at the 1926 midterm. Shipbuilding and railroad equipment has never held more than 15 companies at a midterm. The whole five-industry composite held 116 companies in 1926 and 247 in 2022. Transportation carried 68.9% of the composite's weight in 1926; by 2022 the weights were 38.2% transportation, 36.7% machinery, 18.0% aircraft, 5.6% electrical equipment and 1.5% ships and rail equipment. The fabricated metal portfolio has no data before mid-1963, so it covers only 15 midterms.
The ETF sample uses daily closes from Cboe's public delayed-quote history, which start in 2004. That covers five midterms, 2006 to 2022, for XLI, IYT, Caterpillar and ITA (whose data begin on November 1, 2006), and two for PAVE, whose data begin in March 2017. These are price returns without dividends, so they run slightly below the total-return figures in the sector scoreboard.
The scoreboard: industrials after 25 midterms, 1926 to 2022
| Industry | Beat market, +3 months | Beat market, +12 months | Average 12-month return | Median 12-month gap vs market |
|---|---|---|---|---|
| Industrials composite | 15 of 25 | 12 of 25 | +17.6% | −0.8 pts |
| Machinery | 16 of 25 | 17 of 25 | +22.2% | +2.6 pts |
| Aircraft | 16 of 25 | 15 of 25 | +21.4% | +1.5 pts |
| Electrical equipment | 16 of 25 | 10 of 25 | +20.5% | −0.5 pts |
| Shipbuilding, railroad equipment | 14 of 25 | 9 of 25 | +11.5% | −8.0 pts |
| Transportation | 13 of 25 | 8 of 25 | +14.8% | −4.7 pts |
| Steel works | 14 of 25 | 12 of 25 | +16.1% | −0.5 pts |
| Fabricated metal products* | 8 of 15 | 6 of 15 | +11.5% | −4.1 pts |
| Whole U.S. market | avg +7.6% at +3 months | positive 23 of 25 | +17.7% | — |
*Fabricated metal products: 15 midterms, 1966 to 2022.
Three things stand out.
The composite has no twelve-month edge. Twelve wins in 25 is slightly under half. The average twelve-month return, +17.6%, is almost exactly the market's +17.7%, and the median gap is −0.8 points. Anyone who bought "industrials" as a midterm trade got, on average, the market.
The short window looks better, but it is not about the vote. Industrials beat the market over three months after 15 of 25 midterms, with an average edge of +1.8 points. That sounds like a pattern until you check the same November-to-February window in years with no midterm. The test is in the next section.
Inside the composite, the groups split. Machinery and aircraft were above half at both horizons. Electrical equipment, ships and rail equipment, and transportation did well in the first three months and then fell behind. Transportation beat the market over twelve months after only 8 of the 25 midterms, with a median shortfall of 4.7 points.
Is it the midterm, or just November?
A hit rate means little without a baseline. So we ran the same windows from the same calendar date (the first Tuesday after the first Monday in November) in every year from 1926 to 2025, and split them into midterm years, presidential election years and years with no federal election.
| Group, window | Midterm years | Presidential years | Years with no federal election |
|---|---|---|---|
| Industrials composite, +3 months | 15 of 25 (60%) | 16 of 25 (64%) | 33 of 50 (66%) |
| Industrials composite, +12 months | 12 of 25 (48%) | 13 of 25 (52%) | 26 of 49 (53%) |
| Machinery, +12 months | 17 of 25 (68%) | 13 of 25 (52%) | 22 of 49 (45%) |
| Transportation, +12 months | 8 of 25 (32%) | 13 of 25 (52%) | 24 of 49 (49%) |
The composite's three-month record after midterms (60%) is actually a little lower than in the same window of other years (64% and 66%). Industrials tend to do well from early November into February in general; midterms do not add anything.
Machinery is the one group where the midterm year looks different. It beat the market over the twelve months after 68% of midterms, against 52% after presidential elections and 45% in years with no federal vote, with an average edge of +4.5 points. Transportation shows the mirror image: 32% after midterms against roughly half in other years.
Both differences are based on 25 midterm observations. A run of a few lucky or unlucky years can produce a gap this size, and we have no economic mechanism that clearly ties machinery to the midterm calendar. Treat these as a description of the past, not a rule.
Every midterm since 1926: the reference table
Bold marks a group that beat the whole market over that window.
| Midterm | Base date | Market +3m | Industrials +3m | Market +12m | Industrials +12m | Machinery +12m | Transport +12m |
|---|---|---|---|---|---|---|---|
| 1926 | 1926-11-01 | +6.2% | +7.4% | +29.0% | +30.0% | +39.4% | +24.8% |
| 1930 | 1930-11-03 | −3.8% | −4.9% | −35.4% | −45.8% | −51.2% | −49.4% |
| 1934 | 1934-11-05 | −0.4% | +3.4% | +44.5% | +46.6% | +112.7% | +12.1% |
| 1938 | 1938-11-07 | −4.2% | −6.7% | +3.2% | +0.5% | −3.0% | +7.7% |
| 1942 | 1942-11-02 | +12.0% | +10.2% | +32.3% | +29.9% | +30.8% | +31.9% |
| 1946 | 1946-11-04 | +4.2% | +2.9% | +3.1% | −2.5% | +12.3% | −10.6% |
| 1950 | 1950-11-06 | +17.3% | +26.9% | +24.8% | +24.0% | +25.9% | +22.9% |
| 1954 | 1954-11-01 | +16.0% | +22.5% | +32.3% | +25.0% | +26.3% | +35.5% |
| 1958 | 1958-11-03 | +8.8% | +10.0% | +15.9% | +17.5% | +18.5% | +10.3% |
| 1962 | 1962-11-05 | +15.1% | +16.0% | +27.6% | +25.1% | +30.9% | +48.1% |
| 1966 | 1966-11-07 | +11.7% | +20.0% | +22.1% | +27.9% | +32.5% | +9.7% |
| 1970 | 1970-11-03 | +17.2% | +26.9% | +18.1% | +34.9% | +24.8% | +55.7% |
| 1974 | 1974-11-05 | +7.8% | +5.8% | +25.1% | +26.9% | +26.4% | +17.3% |
| 1978 | 1978-11-07 | +6.1% | +5.2% | +15.8% | +13.5% | +16.2% | +7.3% |
| 1982 | 1982-11-02 | +7.0% | +12.3% | +26.1% | +31.1% | +27.6% | +38.4% |
| 1986 | 1986-11-04 | +12.9% | +11.2% | −1.1% | −9.8% | +8.6% | −16.8% |
| 1990 | 1990-11-06 | +18.0% | +23.1% | +34.2% | +33.3% | +15.9% | +52.7% |
| 1994 | 1994-11-08 | +3.6% | +2.9% | +29.6% | +32.7% | +21.5% | +35.4% |
| 1998 | 1998-11-03 | +16.0% | +9.9% | +25.7% | +28.9% | +30.8% | +2.1% |
| 2002 | 2002-11-05 | −6.7% | −6.0% | +20.4% | +29.7% | +38.5% | +21.5% |
| 2006 | 2006-11-07 | +5.9% | +7.0% | +9.4% | +19.9% | +32.1% | +2.1% |
| 2010 | 2010-11-02 | +10.3% | +13.9% | +5.3% | +5.7% | +12.4% | +0.7% |
| 2014 | 2014-11-04 | +2.1% | +1.4% | +6.1% | −4.9% | −11.9% | −4.4% |
| 2018 | 2018-11-06 | −0.3% | +2.0% | +12.6% | +10.1% | +23.9% | +1.9% |
| 2022 | 2022-11-08 | +8.2% | +12.0% | +15.4% | +10.8% | +12.1% | +13.9% |
A few readings from the table:
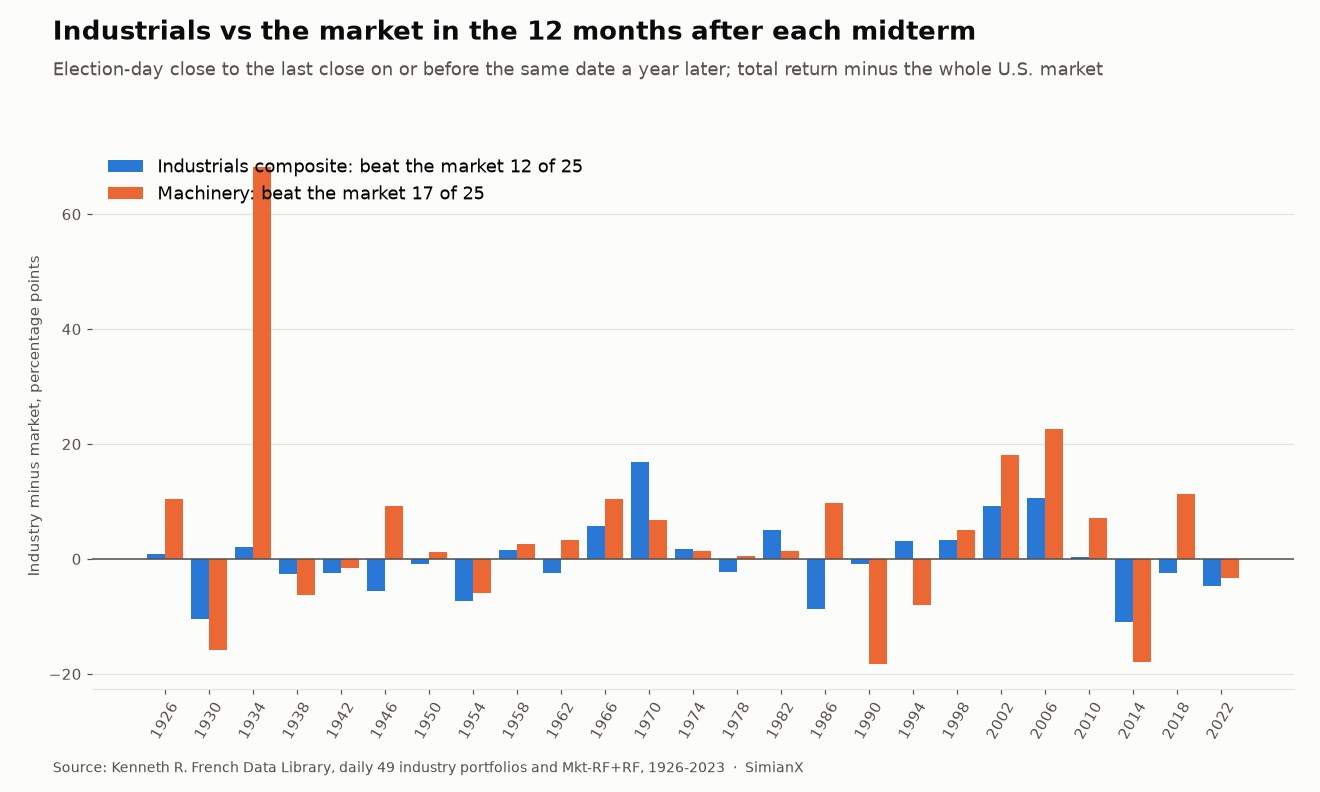
- The biggest industrial win was 1970, when the composite beat the market by 16.8 points over twelve months, led by transportation at +55.7%. The next best were 2006 (+10.6 points) and 2002 (+9.3 points).
- The biggest loss was 2014, an 11.0-point shortfall as machinery fell 11.9% while the market rose 6.1%. Then come 1930 (−10.4 points) and 1986 (−8.6 points).
- Machinery beat the market after eight midterms in a row, from 1958 to 1986. Since 1946 it has won 15 of 20. Its losses since then were 1954, 1990, 1994, 2014 and 2022.
- An early lead often faded. The composite beat the market over three months 15 times; in only 9 of those did it also win over twelve months. 2022 is the latest example: industrials led by 3.8 points after three months and trailed by 4.6 points after twelve.
- Industrials fell over twelve months after four midterms (1930, 1946, 1986 and 2014). The market fell after two of those (1930 and 1986).
When the opposition takes a chamber
The 2026 result puts Congress in the hands of the party that does not hold the White House. In the 25 midterms of this sample, voters handed at least one chamber to the opposition nine times: 1946, 1954, 1986, 1994, 2006, 2010, 2014, 2018 and 2022. (In 1930 the House count was tied at the start of the new Congress, so we leave it out of this group.)
| Group, +12 months | Opposition gained a chamber (9) | All other midterms (16) |
|---|---|---|
| Industrials composite | 3 of 9 beat, avg −2.8 pts | 9 of 16 beat, avg +1.5 pts |
| Machinery | 5 of 9 beat, avg +2.7 pts | 12 of 16 beat, avg +5.5 pts |
| Electrical equipment | 1 of 9 beat, avg −7.5 pts | 9 of 16 beat, avg +8.7 pts |
| Transportation | 2 of 9 beat, avg −6.1 pts | 6 of 16 beat, avg −1.0 pts |
Industrials did worse after the midterms that produced a newly divided Washington. The four cases where the opposition gained ground under a Republican president, as in 2026, are 1954, 1986, 2006 and 2018. The composite beat the market after one of the four, and machinery after three. Four observations are an anecdote, not a statistic. Our gridlock study of 49 Congresses covers divided government across the whole market and is the better guide to that question.
The ETF era: XLI, IYT, CAT and PAVE, 2006 to 2022
The tradeable record tells the same story with fewer data points. Returns are price only, from the election-day close.
Three months after the vote
| Fund (3m) | 2006 | 2010 | 2014 | 2018 | 2022 | Average | Beat SPY |
|---|---|---|---|---|---|---|---|
| SPY (S&P 500) | +4.8% | +9.2% | +1.5% | −0.9% | +7.5% | +4.4% | — |
| XLI (industrials) | +4.7% | +12.7% | +1.3% | +1.9% | +5.6% | +5.2% | 2 of 5 |
| IYT (transportation) | +5.5% | +4.3% | +1.2% | −2.4% | +11.9% | +4.1% | 2 of 5 |
| CAT (Caterpillar) | +9.5% | +24.3% | −16.9% | +0.9% | +8.3% | +5.2% | 4 of 5 |
| ITA (aerospace and defense) | +10.9% | +10.4% | +5.7% | +0.8% | +4.8% | +6.5% | 4 of 5 |
| PAVE (U.S. infrastructure) | n/a | n/a | n/a | −3.7% | +11.0% | +3.6% | 1 of 2 |
Twelve months after the vote
| Fund (12m) | 2006 | 2010 | 2014 | 2018 | 2022 | Average | Beat SPY |
|---|---|---|---|---|---|---|---|
| SPY (S&P 500) | +6.7% | +3.8% | +4.6% | +11.6% | +14.5% | +8.2% | — |
| XLI (industrials) | +14.7% | +1.7% | −0.6% | +12.8% | +4.5% | +6.6% | 2 of 5 |
| IYT (transportation) | −1.2% | −0.7% | −6.9% | +4.9% | +5.6% | +0.3% | 0 of 5 |
| CAT (Caterpillar) | +22.8% | +17.8% | −24.4% | +12.5% | +2.2% | +6.2% | 3 of 5 |
| ITA (aerospace and defense) | +36.3% | +2.2% | +7.1% | +12.8% | +2.9% | +12.3% | 3 of 5 |
| PAVE (U.S. infrastructure) | n/a | n/a | n/a | +9.9% | +13.2% | +11.6% | 0 of 2 |
What the five cycles show:
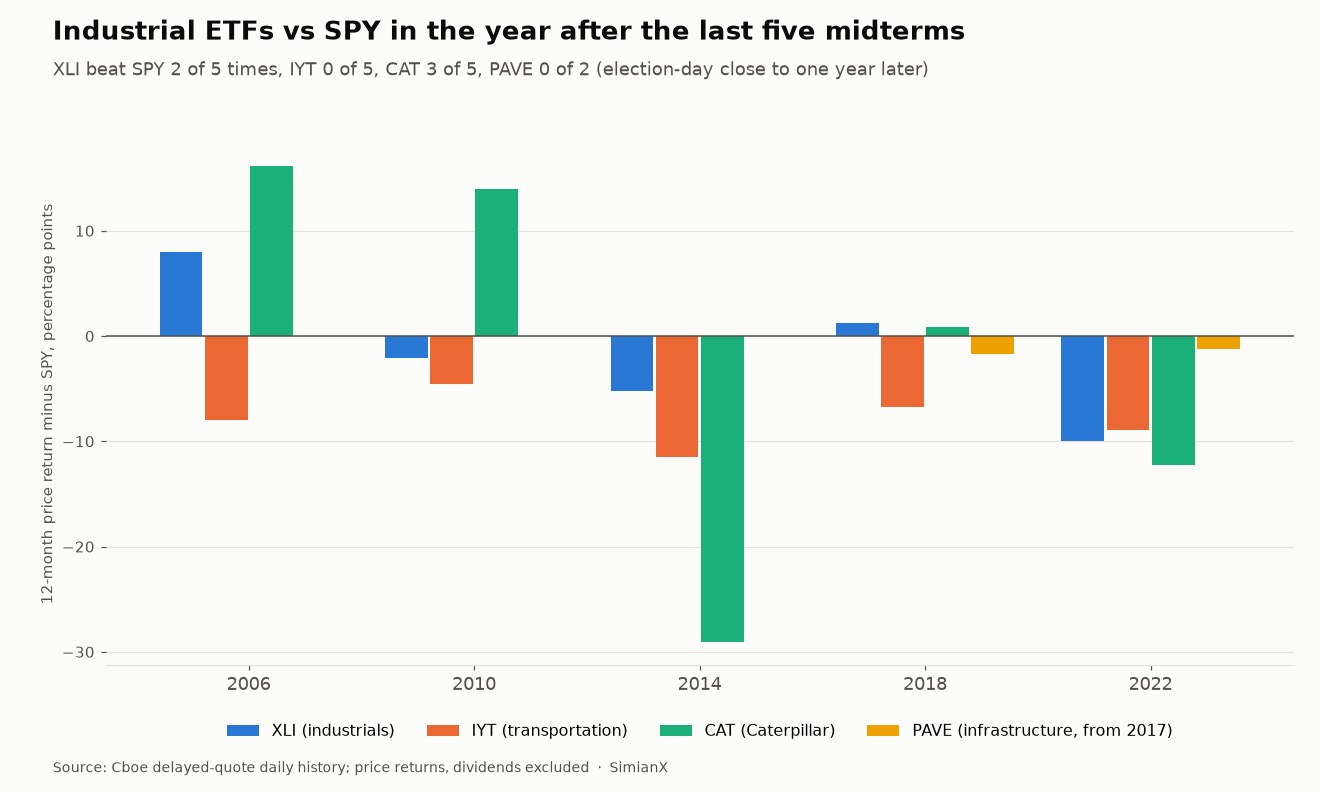
- XLI beat SPY over twelve months twice in five. Its average, +6.6%, trailed SPY's +8.2%. In the 16 non-midterm years from 2004 to 2024 with a full year of data, XLI beat SPY over the same window 7 times, so the midterm record is about the same as any other year.
- IYT never beat SPY in the year after a midterm. It averaged +0.3% against SPY's +8.2%, a gap of almost 8 points a year. This matches the century-long transportation result above.
- Caterpillar is volatile around the vote. It beat SPY over three months four times, but 2014 shows the risk: CAT fell 24.4% in the following year and was 35.3% below its election-day close at its low on September 28, 2015.
- PAVE trailed SPY in both of its cycles, by 1.7 points after 2018 and 1.2 points after 2022, despite the 2021 infrastructure law falling between them. Two observations say very little.
- Drawdowns came anyway. After the 2018 midterm, XLI fell 16.3% from its election-day close to its low on December 24, 2018, slightly more than SPY's 14.8%.
The aerospace and defense fund ITA did better than the other industrial funds, but its holdings overlap with defense contractors, which have their own policy drivers; see defense stocks after the midterms.
What Congress actually passed for infrastructure
The midterm-infrastructure story assumes a new Congress writes a big bill. History shows that the large surface-transportation and infrastructure laws of the last seventy years came from every kind of Congress, and more often from a divided government than a unified one. Dates and Congress numbers below come from the laws' Wikipedia articles; party control is from the Wikipedia table of party divisions of U.S. Congresses.
| Law | Signed | Congress | President | Congress control | Industrials vs market, 12 months after signing |
|---|---|---|---|---|---|
| Federal-Aid Highway Act of 1956 | June 29, 1956 | 84th | Eisenhower (R) | Democratic, both chambers | +0.6 pts |
| ISTEA | December 18, 1991 | 102nd | George H. W. Bush (R) | Democratic, both chambers | +3.9 pts |
| TEA-21 | June 9, 1998 | 105th | Clinton (D) | Republican, both chambers | −6.0 pts |
| SAFETEA-LU | August 10, 2005 | 109th | George W. Bush (R) | Republican, both chambers | +6.1 pts |
| American Recovery and Reinvestment Act | February 17, 2009 | 111th | Obama (D) | Democratic, both chambers | +16.4 pts |
| MAP-21 | July 6, 2012 | 112th | Obama (D) | Senate Democratic, House Republican | +3.6 pts |
| FAST Act | December 4, 2015 | 114th | Obama (D) | Republican, both chambers | +12.1 pts |
| Infrastructure Investment and Jobs Act | November 15, 2021 | 117th | Biden (D) | Democratic, both chambers | +4.5 pts |
Five of the eight were signed under divided government (1956, 1991, 1998, 2012 and 2015), and three under unified government (2005, 2009 and 2021). Three of the eight came from a Congress that had just been elected at a midterm: ISTEA (elected 1990), MAP-21 (elected 2010) and the FAST Act (elected 2014). All three of those were divided governments.
The last column measures the industrials composite against the market from the signing date. The composite was ahead after seven of the eight laws, by an average of 5.2 points and a median of 4.2 points. That result leans on timing: the 2009 Recovery Act was signed three weeks before the March 2009 market low. Without it, the composite was ahead after six of seven laws, by an average of 3.5 points. Eight signing dates spread over 65 years are a small sample, and a law's signing is usually expected well in advance.
The most recent law matters for 2026. The Infrastructure Investment and Jobs Act authorized about $1.2 trillion, of which $550 billion was new spending. Its five-year programs, such as the electric-vehicle charging formula program, were funded for fiscal years 2022 through 2026. The next surface-transportation bill will therefore be written, or extended, by a Congress controlled by the opposition party.
The 2026 setup
Closing prices through November 3, 2026, the last session before the results:
| Fund | 2026 year to date | 12 months since Nov 4, 2025 |
|---|---|---|
| SPY (S&P 500) | +10.6% | +11.7% |
| XLI (industrials) | +10.4% | +12.3% |
| IYT (transportation) | +11.0% | +15.7% |
| PAVE (U.S. infrastructure) | +14.7% | +15.1% |
| ITA (aerospace and defense) | +0.7% | +2.1% |
| CAT (Caterpillar) | +8.9% | +13.9% |
Industrials entered the vote roughly level with the market for the year. XLI was up 10.4% against SPY's 10.6%, but 8.1% below its 2026 high of August 14. The infrastructure fund PAVE was the strongest of the group, up 14.7%. Caterpillar is the outlier: up 8.9% for the year, but 41.4% below its June 30 high of $1,064.90 and down 26.2% in the month before the vote.
Nov 4, 2026: to be added after the close. On the history above, the first session after a midterm has told you very little: the composite beat the market the next day after 15 of 25 midterms, by an average of only 0.2 points.
What the record does suggest for the year ahead is limited. Divided government is the most common setting for highway bills. The composite has lagged after midterms that handed a chamber to the opposition. Machinery has the best long-run record of any industrial group after a midterm, and transportation the worst. None of this is a forecast. Each of these statements rests on between 4 and 25 observations, and the conditions in 2026, including tariffs, rates and the capital-spending cycle, are not those of any earlier midterm.
The limits of this analysis
- Small samples. There are 25 midterms since 1926, 9 opposition gains, 5 ETF cycles, 2 PAVE cycles and 8 infrastructure laws. Every hit rate here has a wide margin of error.
- Industry definitions are old. The French portfolios use SIC codes. Electrical equipment includes communications equipment makers, and transportation includes pipelines and airlines, which do not respond to infrastructure spending the way railroads and truckers might.
- The composite changes shape. Transportation was about two-thirds of the composite in 1926 and about two-fifths in 2022, and early portfolios held few companies.
- Price-only ETFs. The Cboe series excludes dividends; the French returns include them.
- No control for the economy. Many of the industrial wins and losses here line up with recessions, oil prices or interest rates rather than anything Congress did.
How to use this table
Use it as a base rate. If someone argues that industrials should outperform because of the midterm, the hundred-year answer is that the group as a whole has done so about half the time, and no more often than in years without an election. If the argument is specific, for example about machinery or about a new highway bill, the table tells you how often similar situations have worked out and how small that history is. Our live analysis tool can help you look at any individual industrial name in more detail.
Frequently asked questions
Do industrial stocks go up after midterm elections?
Usually, but no more than the market does. The industrials composite rose over the twelve months after 21 of 25 midterms since 1926, and the whole market rose after 23. The composite beat the market over that window only 12 times.
Which industrial stocks have done best after midterms?
Machinery. It beat the market over twelve months after 17 of 25 midterms, including eight in a row from 1958 to 1986, with an average edge of 4.5 points. Aircraft beat the market 15 times. Transportation was the weakest at 8 of 25.
How has XLI done after midterms?
XLI beat SPY over the twelve months after 2 of the 5 midterms from 2006 to 2022, averaging +6.6% against +8.2% for SPY on a price basis. Over three months it was also 2 of 5.
Do infrastructure stocks rise when Congress passes an infrastructure bill?
After the eight major laws listed above, the industrials composite beat the market over the next twelve months seven times. The sample is small and depends heavily on the 2009 Recovery Act, which was signed near a market bottom.
Does divided government help industrial stocks?
After the nine midterms that handed at least one chamber to the opposition, industrials beat the market over twelve months only three times. Five of the eight infrastructure laws in our table came from divided governments. For the market as a whole, see Is Gridlock Good for Stocks?.
Is this investment advice?
No. This is a historical reference table. It does not predict what industrial stocks will do after the 2026 midterms.
The bottom line
Industrials are not a midterm trade. Over 25 midterms the composite beat the market about half the time over twelve months, and its strong November-to-February record shows up just as often in years without an election. The useful detail is inside the sector: machinery has beaten the market after most midterms, transportation after fewer than a third, and the tradeable transport fund has lost to SPY after all five midterms since 2006. Congress has passed most of its big highway bills under divided government, and 2026 has just produced one. What that means for stock prices is not something a sample this small can settle.
Related reading
- Best Sectors After Midterm Elections: 100 Years of Data: the twelve-sector scoreboard this page sits beneath
- Is Gridlock Good for Stocks? 49 Congresses, 1927-2025: divided versus unified government, term by term
- Stock Market After Midterm Elections: Every Cycle 1950–2026: the S&P 500 record
- Bank Stocks After Midterm Elections: 25 Midterms, 1926-2022: the financials spoke
- Do Small Caps Beat Large Caps After Midterms? 1926-2022: the same 25 midterms, split by company size
- Treasury Yields and the Dollar After Midterms, 1962-2022: the bond and currency side
- Do Defense Stocks Rise After Midterms? LMT, RTX, NOC 2026: the defense contractors
Sources
- Kenneth R. French Data Library: 49 Industry Portfolios (daily and monthly, value-weighted returns, number of firms, average firm size) and Fama/French research factors (daily), CRSP data through September 2026.
- Cboe Global Markets delayed-quote daily history for SPY, XLI, IYT, ITA, CAT and PAVE, through November 3, 2026.
- Wikipedia articles on the Federal-Aid Highway Act of 1956, ISTEA, TEA-21, SAFETEA-LU, the American Recovery and Reinvestment Act of 2009, MAP-21, the FAST Act and the Infrastructure Investment and Jobs Act (signing dates, enacting Congress), and "Party divisions of United States Congresses" (chamber control).
- 2026 result: AP and NBC News race calls as of 1:50 a.m. ET, November 4, 2026.