From $17 to $328: Sixteen Years of Tesla Compounding
Tesla went public on Monday, June 29, 2010, at $17.00 per share on the Nasdaq. It sold 13.3 million shares and raised $226.1 million. The stock opened at $17.00, closed its first day at $23.89 — up 40.5% — and became the first American carmaker to go public since Ford in 1956.
That is the answer most people arrive looking for. The more interesting part is what the $17 became.
Tesla has split its stock twice since: 5-for-1 on August 31, 2020, and 3-for-1 on August 25, 2022. Together those make a cumulative 15-for-1 adjustment, so one $17.00 IPO share is fifteen shares today and the split-adjusted IPO price is $1.13. Against the August 9, 2026 close of $328.58, that is a 290-fold return — $1,000 at the IPO is worth about $290,000 today, dividends aside (Tesla has never paid one).
This page is built as a permanent reference: Tesla's IPO facts in full, then the same figures for every other mega-cap tech IPO, so you can see where Tesla actually ranks. The numbers are anchored to the August 9, 2026 close and the methodology is spelled out at the end.
Tesla's IPO in Full
| IPO date | Monday, June 29, 2010 |
| Exchange / ticker | Nasdaq · TSLA |
| Offer price | $17.00 per share |
| Shares sold | 13.3 million |
| Gross proceeds | $226.1 million |
| First-day open | $17.00 |
| First-day close | $23.89 (+40.5%) |
| Valuation at first-day close | roughly $2 billion |
| Profitable quarters at IPO | none |
| Stock splits since | 5-for-1 (Aug 31, 2020), 3-for-1 (Aug 25, 2022) |
| Cumulative split factor | 15-for-1 |
| Split-adjusted offer price | $1.13 |
| Price on Aug 9, 2026 | $328.58 |
| Total return since IPO | ≈ 290× |
Why This IPO Was Unusual
Three things made June 29, 2010 strange even at the time.
It was the first American automaker to go public since Ford in 1956. Fifty-four years had passed. Detroit had spent the previous year in bankruptcy court — GM and Chrysler both went through Chapter 11 in 2009 — and here was a California company asking public markets to fund a new car business from scratch.
Tesla had never posted a profitable quarter. Not one, in seven years of operating. The company priced its offer on a roadmap: a $109,000 sports car built on a Lotus chassis, a sedan that did not exist yet, and a claim that battery costs would fall. Contemporary coverage was openly skeptical — CNN's day-of piece ran under the headline that investors were giddy while auto experts stayed wary.
Demand pushed the price above the filed range. Tesla had registered a $14–$16 band and priced at $17.00, then upsized the deal. The market's enthusiasm was visible before the first trade printed.
Every one of those facts argued for caution, and every one of them was, in hindsight, irrelevant to the sixteen-year outcome. That is worth sitting with before treating any IPO-day narrative as information.
What the First Day Told You (Almost Nothing)
First-day pops get the headlines. Here is what they were worth as a predictor.
| Company | Offer | First-day close | Day-one move | Total return since |
|---|---|---|---|---|
| NVIDIA | $12.00 | $21.00 | +75.0% | 8,958× |
| Tesla | $17.00 | $23.89 | +40.5% | 290× |
| Alphabet | $85.00 | $100.34 | +18.0% | 167× |
| Netflix | $15.00 | $16.75 | +11.7% | 692× |
| Meta | $38.00 | $38.23 | +0.6% | 16× |
Five data points is far too few to claim a rule, and this sample refuses to give a clean one. NVIDIA popped hardest and did compound best. But Alphabet popped 18% and sits second-to-last on total return, while Netflix popped less than half as much and beat it more than fourfold. Meta's flat debut was widely written up at the time as a botched offering; it has since compounded at 21.3% a year, ahead of Apple's 19.3% over a much longer stretch.
The honest summary: day-one price action measures underwriter pricing and allocation scarcity. It does not measure the business.
Where Tesla Ranks Against Every Other Big Tech IPO
Here is the full reference table. Every figure is split-adjusted so the comparison is apples to apples.
| Company | IPO date | Offer price | Splits since | Cumulative factor | Split-adj. offer | Aug 9, 2026 close | Total return |
|---|---|---|---|---|---|---|---|
| Apple | Dec 12, 1980 | $22.00 | 5 | 224:1 | $0.0982 | $313.33 | 3,190× |
| Microsoft | Mar 13, 1986 | $21.00 | 9 | 288:1 | $0.0729 | $499.99 | 6,857× |
| Amazon | May 15, 1997 | $18.00 | 4 | 240:1 | $0.0750 | $274.48 | 3,660× |
| NVIDIA | Jan 22, 1999 | $12.00 | 6 | 480:1 | $0.0250 | $223.96 | 8,958× |
| Netflix | May 23, 2002 | $15.00 | 3 | 140:1 | $0.1071 | $74.14 | 692× |
| Alphabet | Aug 19, 2004 | $85.00 | 2 | 40:1 | $2.1250 | $354.30 | 167× |
| Tesla | Jun 29, 2010 | $17.00 | 2 | 15:1 | $1.1333 | $328.58 | 290× |
| Meta | May 18, 2012 | $38.00 | 0 | 1:1 | $38.00 | $592.10 | 16× |
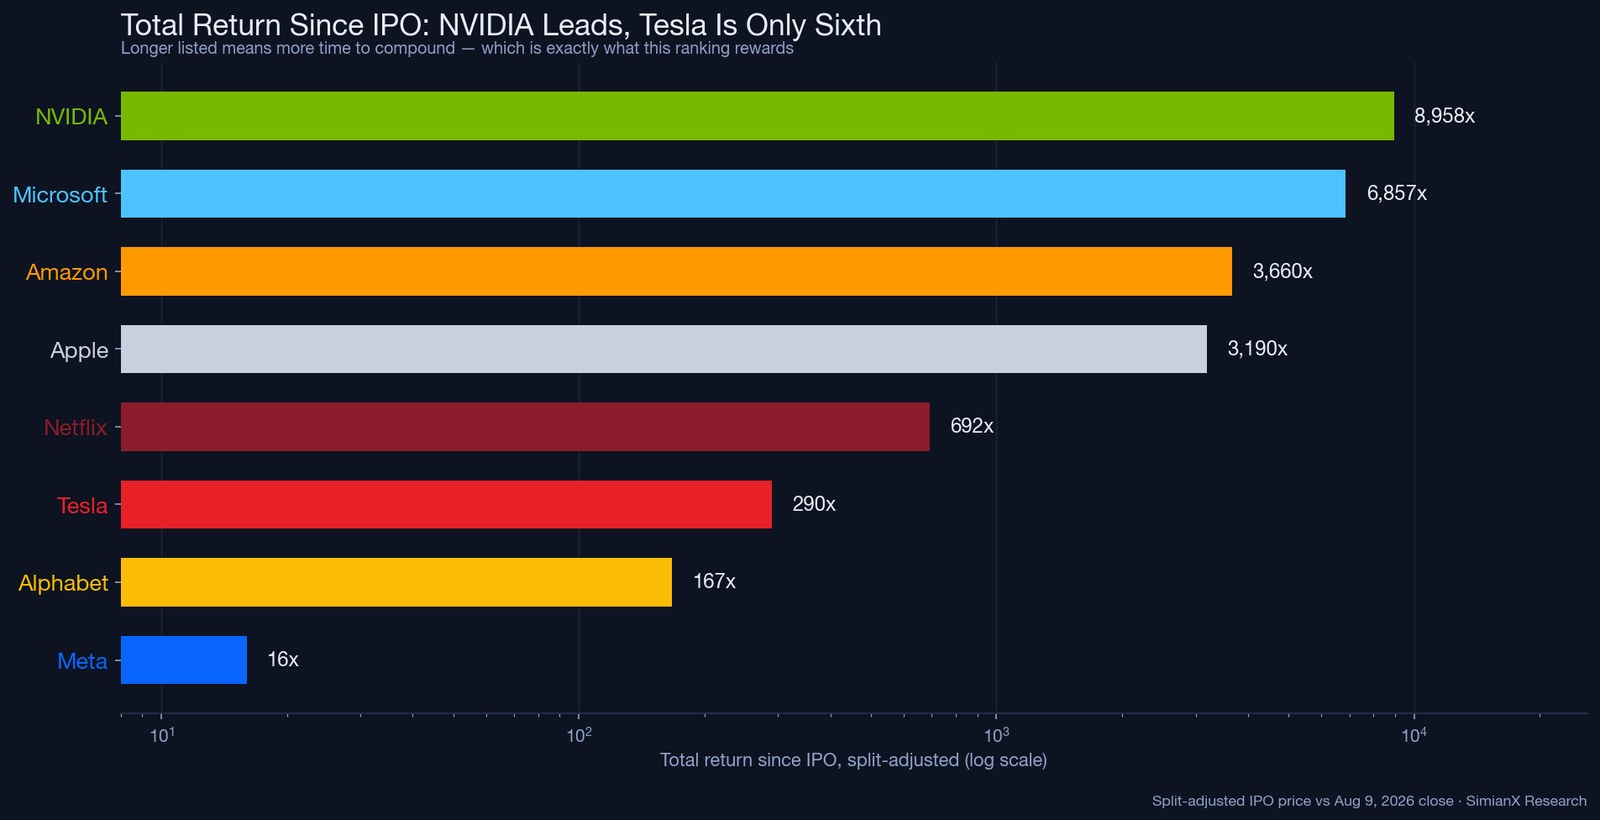
By total return, Tesla ranks sixth of eight. That surprises people who remember the 2020–2021 run. NVIDIA's 8,958× dwarfs it; so do Microsoft, Amazon and Apple, all of which multiplied by more than a thousand.
The Ranking Flips When You Correct for Time
Total return is a deeply unfair scoreboard, because it rewards one thing above all else: how long the stock has been listed. Apple has had 46 years to compound. Tesla has had 16.
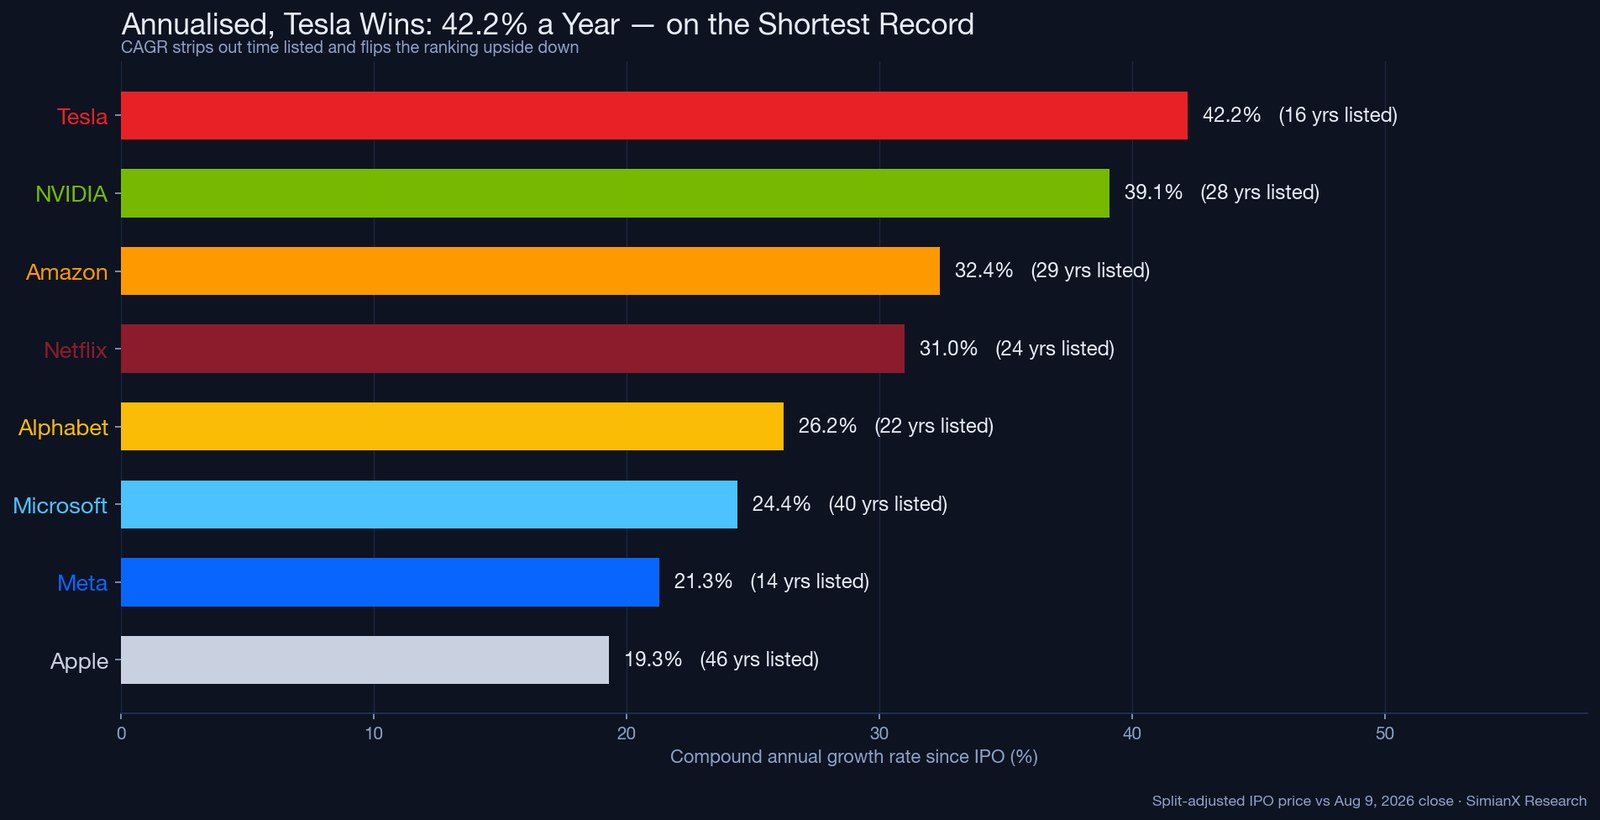
Strip out the clock and rank by compound annual growth rate instead, and the table turns over.
| Rank | Company | CAGR since IPO | Years listed | Total return |
|---|---|---|---|---|
| 1 | Tesla | 42.2% | 16 | 290× |
| 2 | NVIDIA | 39.1% | 28 | 8,958× |
| 3 | Amazon | 32.4% | 29 | 3,660× |
| 4 | Netflix | 31.0% | 24 | 692× |
| 5 | Alphabet | 26.2% | 22 | 167× |
| 6 | Microsoft | 24.4% | 40 | 6,857× |
| 7 | Meta | 21.3% | 14 | 16× |
| 8 | Apple | 19.3% | 46 | 3,190× |
Tesla has compounded faster than any of them — 42.2% a year, every year, for sixteen years. It sits sixth on the total-return board purely because it started last.
This is the single most useful thing in this article, and it generalises far beyond Tesla: when someone shows you a giant multiple, the first question is always over how long. Apple's 3,190× is a 19.3% annual return. Tesla's much smaller 290× is 42.2% annual. The bigger number describes the weaker compounding machine.
What $1,000 at the IPO Became
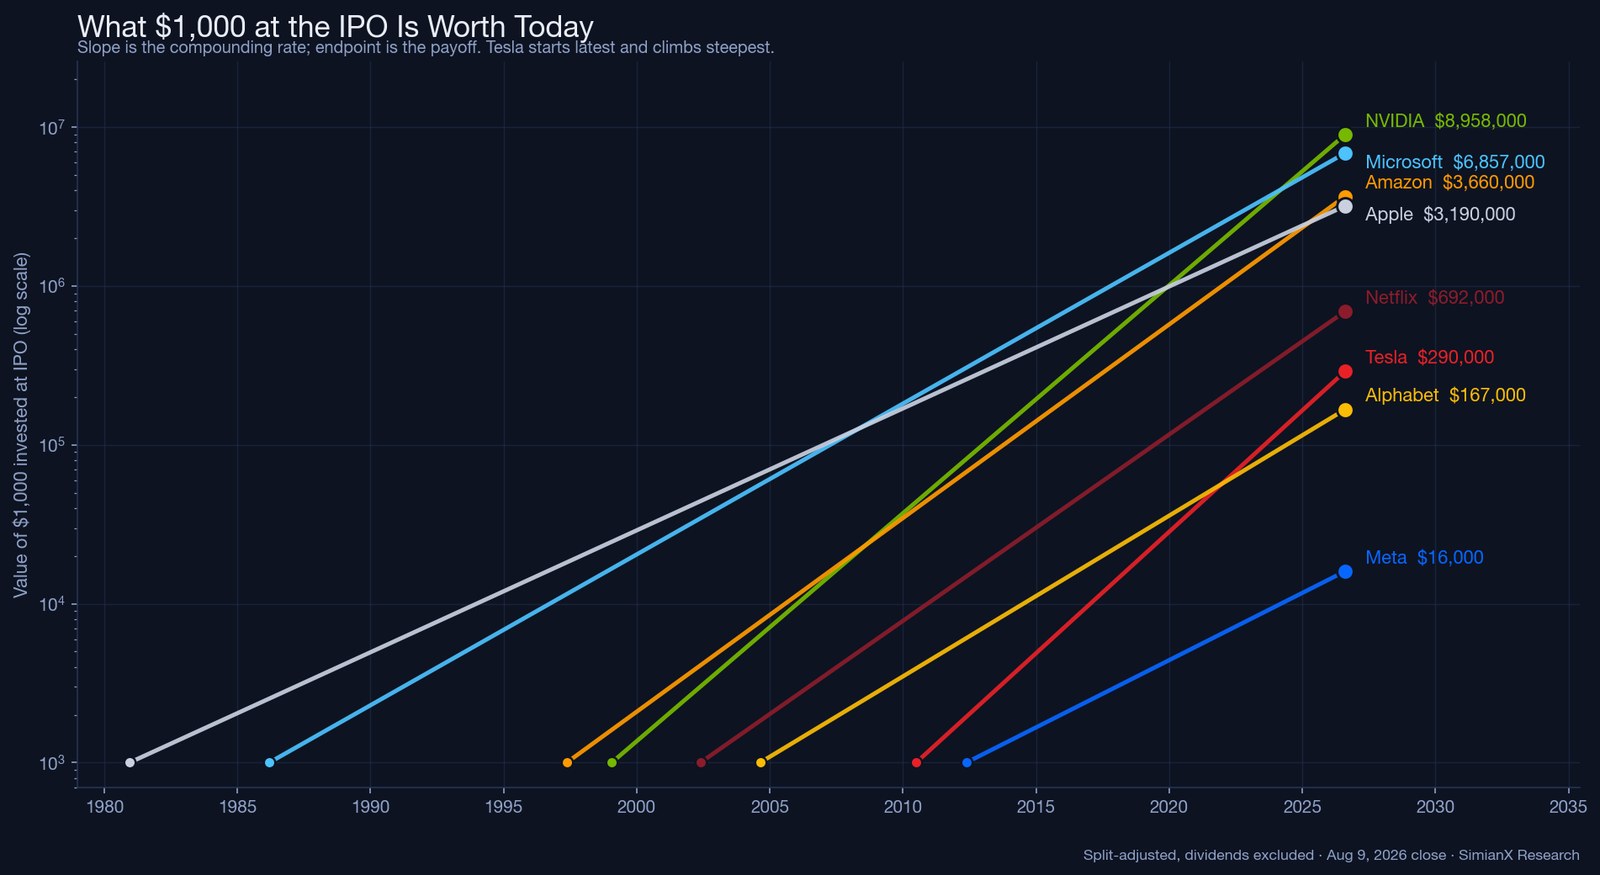
The same data, drawn as money over time. Each line runs from the IPO to today on a logarithmic scale, so the slope is the compounding rate and the endpoint is the payoff.
| Company | $1,000 at IPO is now |
|---|---|
| NVIDIA | $8,958,000 |
| Microsoft | $6,857,000 |
| Amazon | $3,660,000 |
| Apple | $3,190,000 |
| Netflix | $692,000 |
| Tesla | $290,000 |
| Alphabet | $167,000 |
| Meta | $16,000 |
Tesla's line is the steepest on the chart and also the shortest. That is the whole story in one picture.
A caveat that matters: these are the survivors. Pets.com, Webvan and Theranos are not in this table, and neither are the hundreds of 1999–2000 listings that went to zero. Picking the eventual winner at the offer price is the hard part; the compounding is what happens if you were right and held on. Tesla fell more than 70% from peak to trough in 2022 alone. Almost nobody actually captured the full 290×.
Frequently Asked Questions About Tesla's IPO
What date did Tesla IPO?
June 29, 2010, on the Nasdaq under the ticker TSLA.
What was Tesla's IPO price?
$17.00 per share. It had originally filed a $14–$16 range and priced above it on strong demand.
How much did Tesla raise in its IPO?
$226.1 million from 13.3 million shares, valuing the company at roughly $1.7 billion.
What was Tesla's IPO price adjusted for splits?
$1.13. The 5-for-1 split in August 2020 and the 3-for-1 in August 2022 combine to a 15-for-1 factor, so $17.00 ÷ 15 = $1.13.
How much would $1,000 in Tesla's IPO be worth today?
About $290,000 as of the August 9, 2026 close of $328.58 — a 290-fold return, or 42.2% compounded annually. Tesla pays no dividend, so price return is total return.
Was Tesla the first car company to go public in a long time?
Yes. Tesla was the first American automaker to hold an IPO since Ford Motor Company in 1956.
Which tech IPO has produced the best return?
NVIDIA, at roughly 8,958× from its January 1999 offer price of $12. By annualised return, though, Tesla leads at 42.2%.
Has Tesla ever split its stock?
Twice — 5-for-1 effective August 31, 2020, and 3-for-1 effective August 25, 2022.
Watching These Names Now
The IPO is history; the compounding is not. Every company in the table above has a live SimianX page with a continuously refreshed multi-horizon AI read — short-term technicals, mid-term trend structure and long-term fundamental posture, each carrying its own confidence score: Tesla, NVIDIA, Apple, Microsoft, Amazon, Alphabet, Meta and Netflix.
If you would rather interrogate the numbers than read them, a live multi-agent analysis session puts a team of AI models on any ticker's chart and filings on demand, Market Pulse scans the whole tape for 52-week highs and unusual moves as they happen, and autopilots run that analysis on a schedule so the next big move doesn't arrive unwatched.
For the other end of the same story — what these companies are worth now rather than what they listed at — see Amazon Joins the $3 Trillion Club, which tracks every $1T-to-$5T milestone with the same split-adjusted discipline.
Methodology and Sources
Offer prices, dates and proceeds are the terms in each company's final prospectus as reported contemporaneously; Tesla's IPO details are corroborated by CNN Money's June 29, 2010 coverage and Google's by its $85 Dutch-auction pricing. Cumulative split factors are the product of every forward split since listing: Apple 2×2×2×7×4 = 224; Microsoft nine splits = 288; Amazon 2×3×2×20 = 240; NVIDIA 2×2×2×1.5×4×10 = 480; Netflix 2×7×10 = 140; Alphabet 2×20 = 40 (the 2014 factor reflects the Class C distribution rather than a conventional split, which is why GOOGL and GOOG histories differ slightly); Tesla 5×3 = 15; Meta none.
Split-adjusted offer price = offer price ÷ cumulative factor. Total return = Aug 9, 2026 close ÷ split-adjusted offer price. CAGR = total return^(1 ÷ years listed) − 1, with years measured in actual days ÷ 365.25. Dividends are excluded throughout — this matters most for Apple and Microsoft, whose true total returns are meaningfully higher than the price returns shown; it does not affect Tesla, NVIDIA, Amazon, Alphabet, Netflix or Meta over most of their listed lives. Figures are price returns for a buy-and-hold from the offer price, which almost no retail investor could actually obtain at IPO allocation. Definitions: market capitalization, CAGR, stock split.
More reference tables like this one in the SimianX story library.
Related Reading
- Amazon Joins the $3 Trillion Club: The Complete Timeline
- How Long Every Bear Market Took to Recover: 1929-2022
- Every S&P 500 Bear Market Since 1929: Duration and Recovery
- AI Momentum Unwind 2026: Why Semiconductor Stocks Fall
- Apple WWDC 2026: Siri AI & Gemini Impact on AAPL Stock
- AppLovin Stock 2026: Can AI Advertising Keep APP Growing?
- Oura IPO Delayed: What the S-1 Shows Behind the $13.5B Ask