
What Kept the $4,000 Floor Under Gold as the War Widened
On the morning of 29 July 2026, Iran fired ballistic missiles at United States forces. US Central Command said every one of them was intercepted. Oil was already trading above $100 a barrel with the Strait of Hormuz declared closed. President Trump promised Iran a "beating."
Gold rose 0.22%, to $4,036 an ounce.
That is the single most important fact about gold in the second half of 2026. The textbook says missiles plus closed shipping lanes plus $100 oil equals a safe-haven melt-up. Instead, gold barely twitched — and then, hours later, jumped to roughly $4,095 not because of the war but because the Federal Reserve left interest rates alone. Gold in 2026 has stopped trading on fear and started trading on real interest rates. Everything in the H2 outlook follows from that one substitution.
This is a data piece, not a forecast piece. Every gold price figure is sourced and dated. Every GLD figure is computed from our own daily candle store, and we show the arithmetic so you can check it.
Gold's 2026 round trip, in one chart
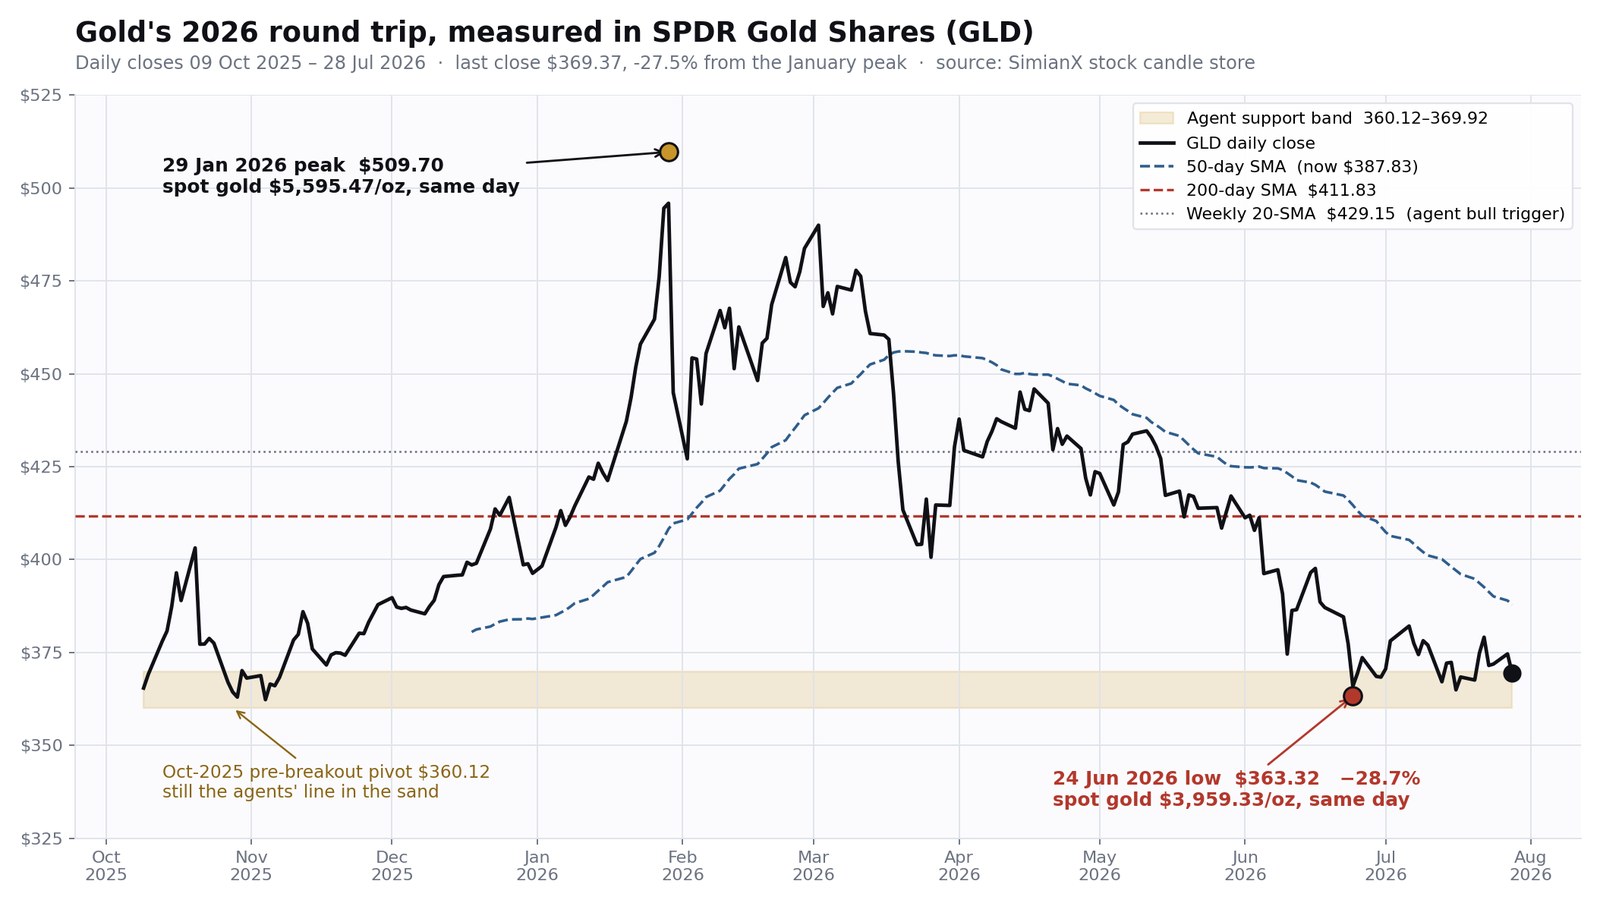
Gold set 12 all-time highs in early 2026 and peaked on 29 January at an intraday spot print of $5,595.47, with the official LBMA benchmark fixing a record $5,405.00 the same day. It then fell to an intraday low of $3,959.33 on 24 June, per the World Gold Council's mid-year outlook. That is a peak-to-trough decline of 29.2% in under five months.
The SPDR Gold Shares trust, the largest gold ETF in the world, tells the identical story from a completely separate data path. Our candle store has GLD's 200 most recent sessions. Its highest print, $509.70, lands on 29 January 2026 — the same day as spot gold's record. Its lowest 2026 print, $363.32, lands on 24 June 2026 — the same day as spot gold's trough. GLD's peak-to-trough decline is 28.7%, within half a percentage point of spot.
The month-by-month reference table
Here is gold's cycle measured in GLD, aggregated from daily closes. October 2025 is partial (our window opens 9 October) and July 2026 runs through the 28th. Every price in it is a GLD share price in US dollars, not a per-ounce gold price — one GLD share is backed by roughly 0.09 troy ounces of bullion, so July's $369.37 close corresponds to spot gold near $4,036 an ounce.
| Month (GLD, $/share) | Open | High | Low | Close | Change | Intra-month peak-to-trough |
|---|---|---|---|---|---|---|
| Oct 2025* | $373.13 | $403.30 | $360.12 | $368.12 | −1.3% | −10.7% |
| Nov 2025 | $368.91 | $388.18 | $361.39 | $387.88 | +5.1% | −6.9% |
| Dec 2025 | $390.61 | $418.45 | $382.91 | $396.31 | +1.5% | −8.5% |
| Jan 2026 | $401.62 | $509.70 | $396.25 | $444.95 | +10.8% | −22.3% |
| Feb 2026 | $434.01 | $483.90 | $422.55 | $483.75 | +11.5% | −12.7% |
| Mar 2026 | $490.10 | $492.15 | $399.20 | $430.29 | −12.2% | −18.9% |
| Apr 2026 | $435.00 | $448.70 | $414.16 | $423.66 | −2.6% | −7.7% |
| May 2026 | $421.41 | $437.42 | $404.30 | $417.12 | −1.0% | −7.6% |
| Jun 2026 | $409.86 | $414.40 | $363.32 | $368.38 | −10.1% | −12.3% |
| Jul 2026† | $371.20 | $383.60 | $363.60 | $369.37 | −0.5% | −5.2% |
Three numbers in that table deserve to be pulled out.
January was not a rally, it was a blow-off. GLD opened the month at $401.62 and printed $509.70 — and still closed the month at $444.95, having given back most of the spike. The intra-month peak-to-trough swing was 22.3%. When a market travels that far in both directions inside 20 sessions, the high is usually a liquidity event, not a valuation.
March did the structural damage. GLD opened March at $490.10, five dollars below its all-time high, and closed at $430.29. That −12.2% month is when the trend broke: the 50-day average rolled over and the price lost the 200-day average, and it has not closed a month above it since.
The bottom is holding on the second test. June's low of $363.32 (24 June) was retested on 17 July at $363.60 — 28 cents higher. Two touches, no break. That is the entire bull case for H2 in one line, and the entire bear case is the possibility that the third test fails.
Measured properly, 2026 has been much less dramatic than the headlines. GLD's first close of the year was $398.28 and its last was $369.37 — −7.3% year to date, which reconciles precisely with the World Gold Council's "down roughly 7%." Realised volatility across those 200 sessions annualises to 30.7%, against a 20-year average of 17%. Gold has not collapsed. It has become twice as volatile while going slightly down.
Why the correction happened: war became a rate story
Three catalysts turned January's melt-up into a 29% drawdown, and they compound in a way most gold commentary gets backwards.
1. The Fed chair changed, and the dot plot flipped. Kevin Warsh took over the Federal Reserve as a self-declared hawk. Markets that entered 2026 pricing rate cuts spent the spring repricing toward hikes — our own analysis of Warsh's first Fed meeting caught the moment the dot plot turned, and the political pressure to cut instead has not moved him. Goldman Sachs has removed every remaining 2026 cut from its forecast and pushed easing out to June 2027. Gold pays no coupon, so its opportunity cost is the real yield on a Treasury bond; when the market stops expecting cuts, that cost rises every day you hold the metal.
2. Hormuz made the rate problem worse, not better. This is the counterintuitive engine of 2026. The closure of the Strait of Hormuz pushed crude above $100. Higher oil feeds directly into headline inflation, and a hawkish Fed responds to inflation by keeping rates high or raising them. So the geopolitical shock arrived through the rate channel as a headwind to gold, roughly cancelling its own safe-haven bid. War normally lifts gold; in 2026 war lifted the thing that suppresses gold. Our reference work on how markets actually trade invasions and on the Iran conflict's effect on US equities shows this pattern is not unique to gold — geopolitical shocks decay faster than almost anyone expects.
3. The financial bid left, even as the physical bid stayed. JPMorgan quantified the mechanism: since late February, gold has fallen roughly $20 an ounce for every 1 basis point rise in 10-year real yields. That is the cleanest single statistic in the 2026 gold market. Investors responded accordingly — GLD has seen more than $14 billion of outflows since 1 March 2026, including a single-day withdrawal of $2.91 billion on 4 March, the largest in over a decade. The trust's net assets stood near $128.6 billion in mid-July.
For a longer view of how gold behaves when the macro regime turns against it, our gold safe-haven scorecard across every US recession since 1973 is the companion piece to this article.
What our AI agents actually said about gold
We ran a live multi-agent analysis of GLD at 01:04 UTC on 29 July 2026 — hours before the Fed decision. SimianX runs four specialist agents in parallel rather than one model with one opinion, and on gold they disagreed, which is exactly why the structure is useful.
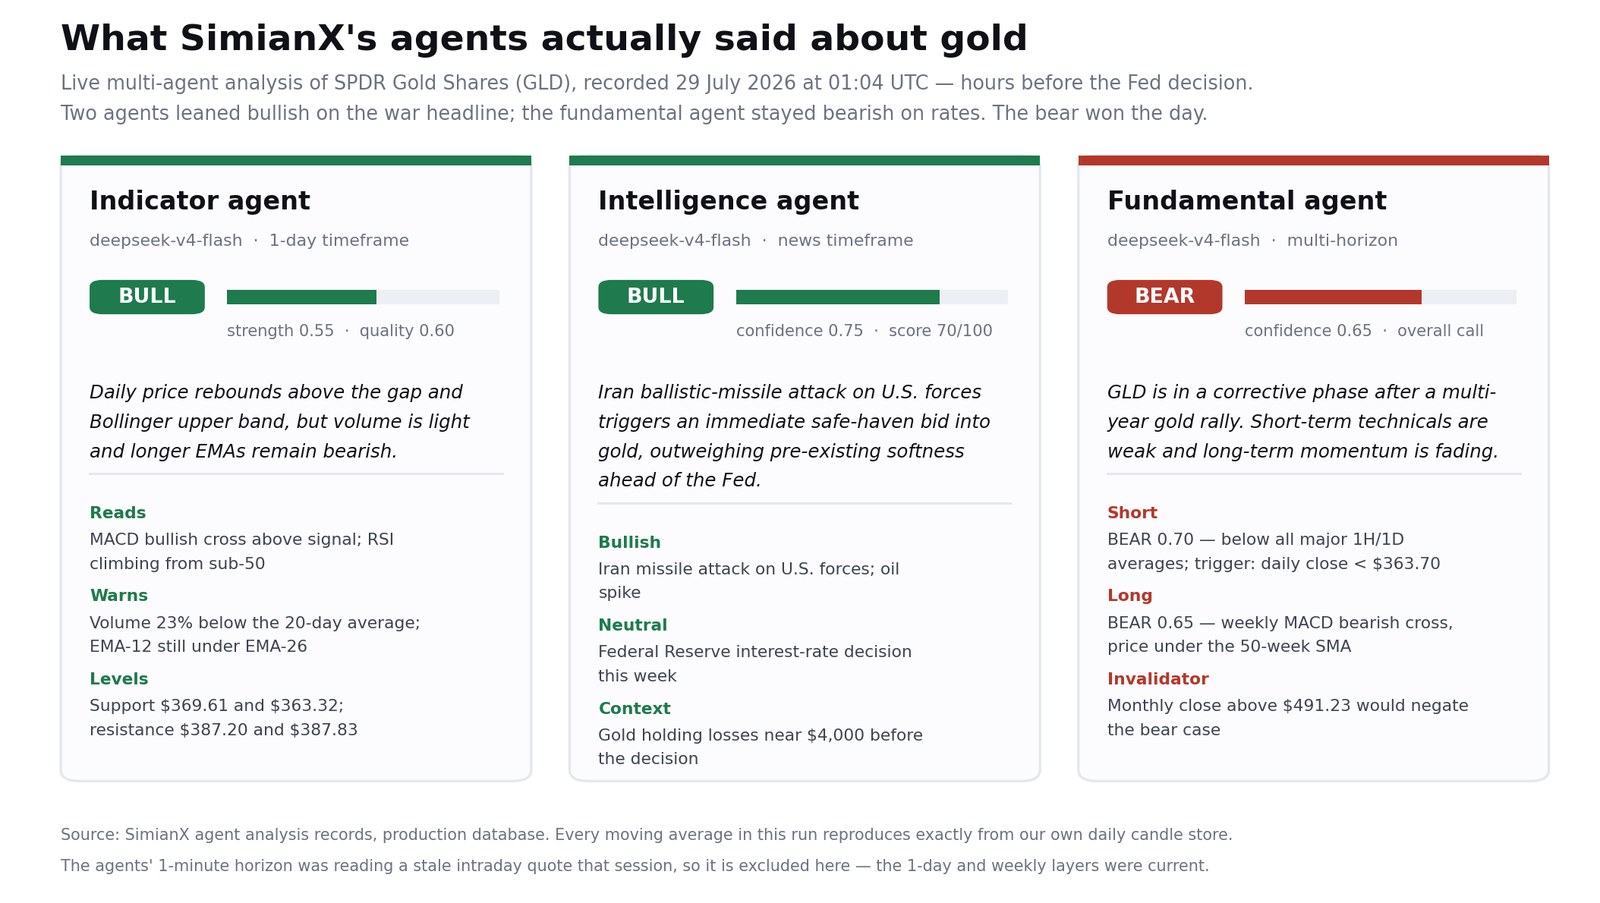
The indicator agent (1-day timeframe) called it a bullish bounce with a strength of 0.55 and quality of 0.60: a MACD bullish cross above the signal line and RSI climbing out of the sub-50 zone, but with two explicit warnings — volume 23% below its 20-day average, and EMA-12 still trapped below EMA-26. A rebound it did not trust.
The intelligence agent (news timeframe) was the most bullish of the three at 0.75 confidence, scoring the tape 70 out of 100. Its verdict, verbatim: "Iran ballistic-missile attack on U.S. forces triggers immediate safe-haven bid into gold, outweighing pre-existing softness ahead of the Fed decision." It marked the missile attack and the oil spike bullish and the Fed decision neutral.
The fundamental agent overruled both, with a bearish overall call at 0.65 confidence: "GLD is in a corrective phase after a multi-year gold rally. Short-term technicals are weak and long-term momentum is fading." It split the call across horizons — bearish 0.70 on the short horizon (price below every major 1H and 1D average, negative daily MACD, sub-average volume) and bearish 0.65 on the long horizon (weekly MACD bearish crossover, price beneath the 50-week average) — while noting the multi-year uptrend remains structurally intact above $251.66.
The fundamental agent was right, in the narrow sense that matters: gold did not break out on the missiles. It moved on the Fed. An earlier run on 22 June had reached the same conclusion from the opposite side of the news cycle, calling gold bearish because "bond markets [are] pricing in two rate hikes this year."
Methodology, and one honest caveat. Every moving average in that run reproduces exactly from our own daily candle store — we recomputed SMA-20 at $373.02, SMA-50 at $387.83, SMA-200 at $411.83 and EMA-12/26/50 at $372.57/$376.77/$387.16, and each matched the agent output to the cent. The agents' 1-minute horizon, however, was reading a stale intraday quote left over from a June session, so its "current price" of $384.74 was wrong and we have excluded that layer here. GLD's actual last confirmed close was $369.37 on 28 July. We are showing you this rather than hiding it because it is the correct way to read any AI market analysis: check the layer, check the timestamp, and trust the levels more than the narration. You can reproduce the whole run yourself on the live analysis desk.
The bid that never left: central banks
While ETF investors sold, official reserve managers bought — and this is the strongest argument against treating 2026 as the end of the gold cycle.
Central banks purchased a net 244 tonnes in Q1 2026, up 3% year on year and the fastest quarterly pace in more than a year, per the World Gold Council. Poland led with 31 tonnes as part of a multi-year plan to reach 700 tonnes; Uzbekistan added 25; the People's Bank of China took 40 tonnes across the first half. The Council's full-year 2026 estimate is roughly 850 tonnes, against 863 tonnes in 2025 and a pre-2022 annual average of 400–500 tonnes. Goldman Sachs models about 60 tonnes a month and expects buying to continue rising through 2026.
The ETF data contains the same split if you read tonnage instead of dollars. Global gold ETF assets under management fell 6% over the six months to about $526 billion — but total holdings rose by 18 tonnes to 4,047 tonnes, and H1 net flows were still positive at roughly +$8 billion. Dollar AUM fell because the price fell. The metal did not leave the vaults. Bar and coin demand hit its second-highest level ever in Q1.
That is the structural floor under the $4,000 level: a price-insensitive buyer that accelerates when the price dips.
H2 2026 expectations: the scenario map
The World Gold Council's mid-year outlook, titled Point break, declines to give a point forecast and instead says that if conditions do not materially change, gold may trade ±5% around $4,100 an ounce through the second half. It names three upside catalysts — worsening economic or geopolitical conditions, a reversal in rate expectations, and renewed long-term investor participation — against three downside risks: dollar strength, rising rates, and risk-on sentiment.
Wall Street clusters above that band, and notably nobody is calling for a new record.
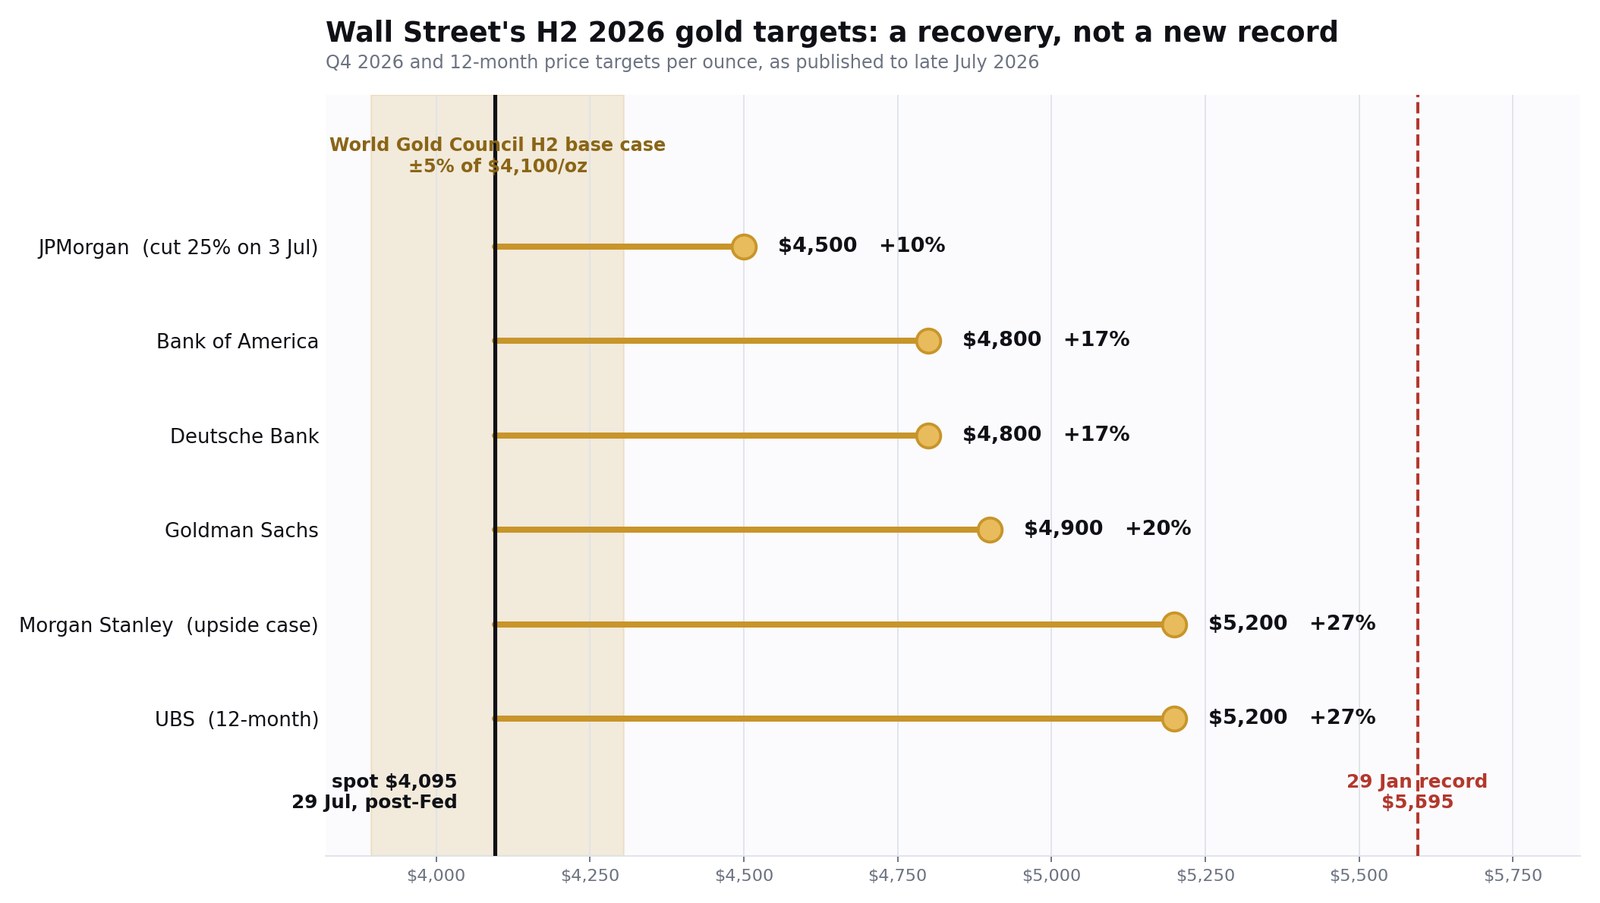
JPMorgan cut its Q4 2026 target by 25% to $4,500 on 3 July, having published $6,000 just three weeks earlier on 9 June — it cited fading ETF inflows, including the first monthly outflow from Asian funds since August 2025. Bank of America and Deutsche Bank both sit at $4,800, Goldman Sachs at $4,900 for Q4, and Morgan Stanley (upside case) and UBS (12-month) both at $5,200, against a Morgan Stanley base case nearer $4,400. Even the top of that range is 7% below January's peak.
Combining the external forecasts with our agents' own trigger levels gives a scenario map with falsifiable conditions rather than opinions:
| Scenario | Trigger | Gold implication | GLD level |
|---|---|---|---|
| Bear resumption | Daily close below $363.70; Fed hikes in September | Retest and break of the $4,000 floor | Below $363.32 opens $351–$360 |
| Range / base case | Neither level breaks; Fed stays on hold | ±5% of $4,100 through Q4 | $369–$392 |
| Recovery | Weekly close above $429.15; real yields fall | $4,500–$4,900 bank targets engage | Reclaim $411.83, then $429.15 |
| New record | Rate cuts return plus a fresh supply shock | Above $5,405 LBMA | Above $491.23 monthly |
The asymmetry worth noting: the September Fed meeting is genuinely live. The July decision was a hold, but three of twelve members dissented in favour of a 25 basis point hike. Two more converts and the bear case triggers itself.
The levels that decide it
These are our agents' own numbers, dated 29 July 2026, and they are the cheapest way to hold yourself accountable in H2.
| Level | What it is | Why it matters |
|---|---|---|
| $363.32 / $363.70 | June low and the agents' short-horizon trigger | Twice-tested floor; a daily close below confirms the bear case |
| $369.92 | Weekly lower Bollinger band | Long-horizon bear trigger on a weekly close below |
| $373.02 | 20-day SMA | The short-term pivot; price closed 28 July just beneath it |
| $387.83 | 50-day SMA | First real resistance; rejected repeatedly since March |
| $411.83 | 200-day SMA | The line that defines "correction" versus "bear market" |
| $429.15 | Weekly 20-day SMA | The agents' explicit bullish confirmation trigger |
| $491.23 | Monthly upper Bollinger band | A monthly close above invalidates the bear case entirely |
| $251.66 | Monthly 50-period SMA | The multi-year uptrend's actual invalidation point |
For context on how long recoveries of this size normally take, our reference table on how long every bear market took to recover is the relevant base rate — GLD needs +38.0% from $369.37 simply to touch $509.70 again.
How to track this without watching a screen
Gold in H2 2026 is a two-variable problem: the real yield and the Strait. Both move on scheduled events and unscheduled headlines, which is an awkward combination for a human.
- Run the same analysis we did on GLD, IAU, the miners via GDX, Newmont and Agnico Eagle, or silver via SLV. The four agents run in parallel and you see each one's reasoning, not just a verdict.
- Market Pulse flags 52-week and 30-day breaks plus news events across the market, which is how the oil-and-gold linkage shows up before it reaches the price you care about.
- Autopilots re-run the analysis on your schedule and notify you when a trigger like "daily close below $363.70" actually fires.
- Auto Digest merges the four agents into one daily briefing by email, Discord or Telegram.
Analysis runs are priced in points; the plans page shows what each tier includes.
Frequently asked questions
Is the gold bull market over?
Not on the evidence. Gold is 27% below its January record but roughly 160% higher over six years, central banks are on pace for an 850-tonne year, and ETF tonnage rose in H1 even as dollar AUM fell 6%. Our fundamental agent's own invalidation level for the multi-year uptrend is $251.66 in GLD terms — a very long way beneath $369.37. What ended in January 2026 was the melt-up, not the cycle.
Why didn't gold spike when Iran attacked US forces?
Because in 2026 the war raises inflation expectations, a hawkish Fed answers inflation with higher-for-longer rates, and higher real yields are gold's direct opportunity cost. JPMorgan measures the sensitivity at about $20 an ounce per basis point of 10-year real yield. The safe-haven bid was real but roughly cancelled by the rate channel it triggered.
What is the single most important number for H2 2026?
The 10-year real yield, not the gold price. After that, the September FOMC vote count — July was a 9–3 hold, and three dissenters already wanted a hike.
Where does $4,000 come from as a floor?
It is where the price-insensitive buyer lives. Spot gold bottomed at $3,959.33 intraday on 24 June with an LBMA low of $4,001.80 on 25 June, then held on the July retest. Central bank and bar-and-coin demand accelerated into that dip rather than fading.
Is GLD the same as owning gold?
Close, not identical. GLD is a physically backed trust, so it tracks bullion minus its expense ratio, which is why its 28.7% drawdown differs slightly from spot's 29.2%. It trades only during US market hours, so overnight spot extremes — like January's $5,595.47 print — may not appear in its candles.
How does gold compare with Bitcoin as a hedge in 2026?
They have decoupled. Gold now trades almost purely on real yields, while Bitcoin trades on liquidity and risk appetite; on 29 July gold gained on the Fed hold while Bitcoin stalled. Treating them as interchangeable "debasement trades" stopped working this year.
Methodology and sources
GLD prices, moving averages, monthly aggregates, drawdowns, year-to-date returns and realised volatility are computed from SimianX's own daily candle store, 200 sessions ending 28 July 2026. Agent verdicts, confidences and levels are read directly from our production analysis records for the run at 01:04 UTC on 29 July 2026; the stale 1-minute layer in that run is disclosed above and excluded. Spot gold records, the June low, year-to-date performance and the H2 band are from the World Gold Council mid-year outlook 2026; central bank tonnage from WGC Gold Demand Trends Q1 2026 and ETF flows from WGC Goldhub. The July FOMC outcome and the 9–3 vote split are from CNBC and goldsilver; the post-decision move from FXStreet and Bloomberg via Financial Post. The current target range of 3.50%–3.75% is per Trading Economics. Bank targets and the real-yield sensitivity are as reported to late July 2026, including JPMorgan's cut to $4,500. Prices move; the dates above are the point of this article.
Nothing here is investment advice.
Related reading
- Gold in Every US Recession Since 1973: A Safe-Haven Scorecard
- Warsh's First Fed Meeting 2026: The Dot Plot Flips to Hike
- July CPI Report 2026: Inflation Falls, Fed Hike in Doubt
- Every Fed Rate Hike Cycle Since 1983
- Iran War Impact on Stocks: Risk-Off Returns as Oil Surges
- Buy the Invasion? 9 of 12 Wars Saw Stocks Rally
- How Oil Market Volatility Is Shaking US Stocks
- How Long Every Bear Market Took to Recover, 1929–2022